

17th August 2026
Headline metal prices lag physical reality. How copper treatment charges (TC/RCs), smelter economics, and warehouse inventories predict commodity market moves.

13th August 2026
Why weak U.S. grain export movements stem from FOB price uncompetitiveness rather than logistics bottlenecks. Impact analysis on barge freight, basis, and crush margins.

12th August 2026
Beijing didn't lift critical mineral controls it hardened enforcement. Discover why low approval rates and November 2026 deadlines trigger new supply risks.
12th August 2026
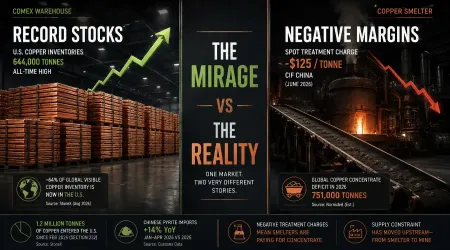
U.S. copper stockpiles are hitting records, but negative treatment charges reveal a historic concentrate shortage. Discover why the inventory pile is a head-fake

12th August 2026
Sulphuric acid is quietly rationing uranium, nickel, and copper output . Explore how copper smelter cuts and grade declines trigger a multi-market supply squeeze

6th August 2026
Beyond copper, obscure computing metals like tin, tungsten, tantalum, and indium face structural AI demand shocks and tight Chinese export controls.
4th June 2026
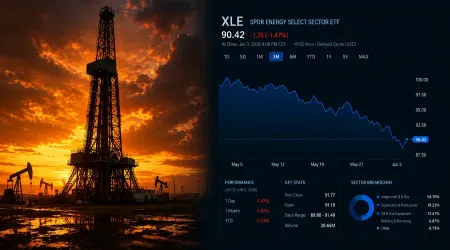
Brent crude holds near $97, but $XLE is sharply decoupling from the commodity rally. A forensic look at the relative weakness Wall Street is tracking.
27th March 2026
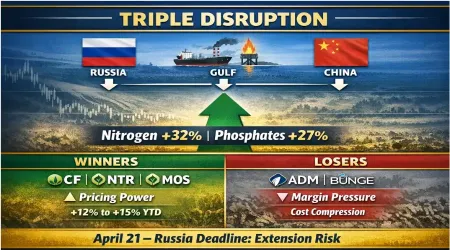
Russia export pause, Gulf shipping disruptions, and China curbs tighten fertilizer markets. Nitrogen +32%, phosphates +27%. Winners: CF, NTR, MOS. Losers: ADM, BG.

24th March 2026
Brent crude falls 11% on ceasefire hopes, then rebounds 14% after Iran denial. Here’s how the narrative split repriced Fed expectations – and the three signals to watch.
23rd March 2026
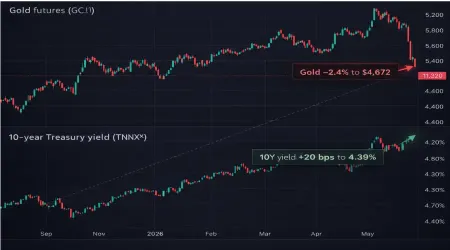
Gold is falling while yields and the dollar rise. Here’s how the discount rate mechanism links gold’s drop to stock valuation compression—and why earnings haven’t yet adjusted.
19th March 2026
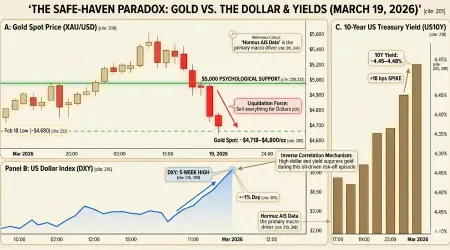
Gold breaks $5,000 as $112 oil and a hawkish Fed trigger a "sell everything" regime. Discover why the safe-haven trade failed and the key MCX levels to watch.
19th March 2026
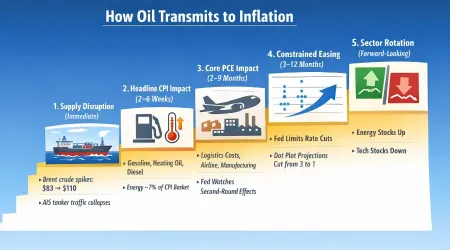
Iran war oil surge hits $110+ Brent as March 2026 FOMC cuts projections to one. Here is how the transmission works - and what traders are monitoring.

16th March 2026
Oil tops $105 on Iran fears, gold nears $3,150, copper slips below $5.10. The split signal traders are watching in commodities. March 16, 2026

5th March 2026
Oil climbed 3% despite bearish EIA inventory data and an OPEC+ production hike. The geopolitical premium tied to Iran conflict risk now outweighs supply-side fundamentals.
3rd March 2026
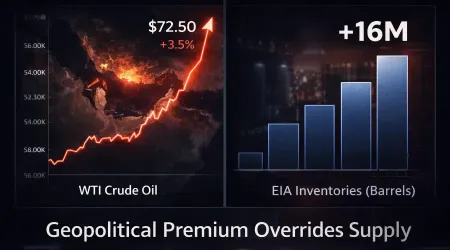
Oil rises 3.5% despite a record EIA build as geopolitical risk drives markets. Gold gains, silver diverges, and yields climb in a cross-asset shift.

2nd March 2026
WTI and Brent jump over 7% after Iran-related headlines while gold and silver advance. Bond yields edge higher with limited cross-asset confirmation.
27th January 2026
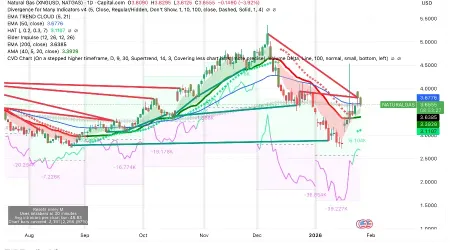
Natural gas surged 120% after Winter Storm Fern, while crude inventories rose and gold stayed firm. Deep dive into commodity market divergences.

24th January 2026
Gold nears $5,000, silver surges 37%, oil stays range-bound. Learn what these commodity signals reveal about de-dollarization, energy transition, and geopolitics.

24th January 2026
Gold hit $5,000 and silver surged 37% in 2026. Learn how gold and silver differ, their risks, upside potential, and which suits conservative vs aggressive investors.

24th January 2026
Why is gold at $5,000? Will oil spike? Is silver better than gold? We answer the most important commodity price questions affecting your money in 2026.