
BreakoutBulletin | BB Macro Intelligence Series
Part of the Macro Intelligence Master Guide
Educational commentary only. Not investment advice.
The Market Rotation That Confuses Growth Investors
Every few years the stock market enters a phase that wrong-foots investors focused on technology. Oil prices rise. Copper rallies. Steel climbs. Shipping demand increases. Companies tied to the physical economy begin outperforming the broader index while the high-multiple growth names stall or fall.
In 2022, when crude oil surged past $100 following the Russia-Ukraine invasion, the energy sector gained approximately 60% while the S&P 500 fell 19%. That kind of divergence is not random. It follows a consistent logic rooted in the commodity cycle, one of the four primary macro forces that drive sector leadership across economic cycles.
Understanding this cycle helps investors interpret why certain sectors lead the market and how long those leadership phases tend to last. It also connects directly to the Sorting Hat framework , where commodity-driven companies occupy House Ravenclaw – the group that thrives when the physical economy is expanding.
The Commodity Cycle: How It Works
Commodities sit at the foundation of the global economy. Energy fuels transportation and manufacturing. Metals like copper and aluminum are structural inputs for construction and electronics. Agricultural commodities support food supply chains.
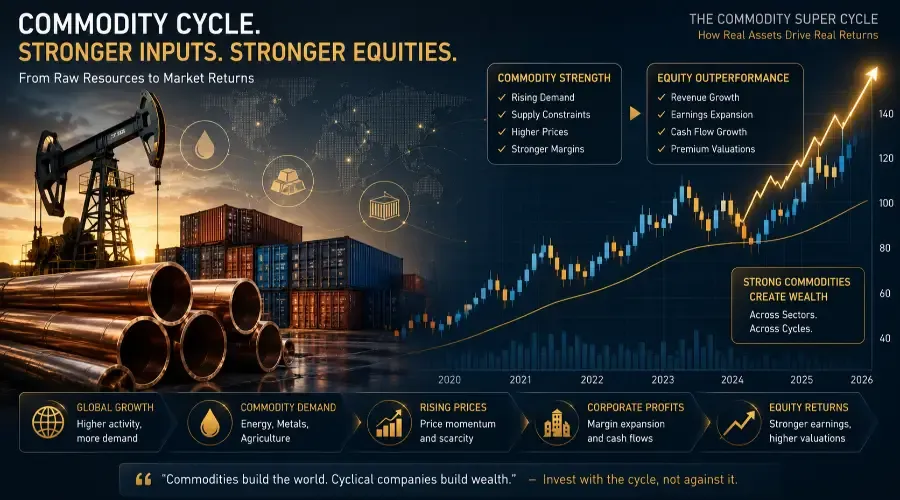
Demand for these resources moves with the broader economic cycle. When global growth accelerates, factories produce more goods, construction projects expand, and infrastructure spending increases. Rising demand pushes commodity prices higher. That price increase flows directly into the revenues of companies that produce those resources.
The sequence runs: global growth drives factory output, factory output drives raw material demand, raw material demand drives commodity prices, and commodity prices drive producer revenues.
Commodity cycles do not operate in isolation. They interact with interest rates, dollar strength, and risk sentiment – forces that the Market Regime Identification Framework tracks simultaneously to classify the current environment.
Why Cyclical Companies React So Strongly: Operating Leverage
Commodity producers and industrial businesses are structurally different from technology or consumer companies. Their cost bases are largely fixed: mines, oil fields, and steel mills carry similar operating costs whether commodity prices are $60 or $100 per barrel.
When prices rise, revenue increases directly while costs stay flat. A mining company that sees copper prices rise 20% may report a 40% or greater increase in operating profit. This is operating leverage – and it is what makes cyclical stocks so responsive during commodity upcycles.
The same mechanism works in reverse. When prices fall, revenue drops while fixed costs remain, compressing margins rapidly. This asymmetry is what makes cyclical stocks both attractive during upcycles and risky during downturns.
This sensitivity to economic activity also connects to interest rates. Rising borrowing costs can slow capital spending and reduce demand for industrial inputs, which is why cyclical stocks often come under pressure during aggressive rate-hike cycles – a relationship covered in Why Rising Interest Rates Hurt Growth Stocks .
The Supply Lag: Why Commodity Price Spikes Persist
Commodity markets have a structural characteristic that technology markets do not: supply cannot adjust quickly.
Building a new oil field takes 5 to 8 years from discovery to production. A new copper mine takes 7 to 10 years from exploration to output. Even when demand rises sharply, producers cannot increase supply on demand. This multi-year lag is what creates sustained price spikes rather than brief fluctuations.
During periods of supply constraint, commodity producers operate at unusually strong profit margins. Investors recognize these conditions quickly, and capital flows into the sectors that benefit directly from elevated prices – often faster than the underlying supply response can develop.
The 2022 energy rally illustrates the dynamic. Three forces converged simultaneously: post-COVID demand recovery, Russia-Ukraine supply disruption, and a decade of underinvestment in new production during the low-price years of 2015–2020. That combination produced one of the strongest commodity rallies in recent memory, with energy stocks gaining roughly 60% in a year when every other sector declined.
Which Sectors Benefit Most
Within the S&P 500, four sectors are most directly linked to commodity cycles.
Energy – Companies involved in oil and natural gas production, drilling, and services. Revenue tracks crude prices directly. Commonly tracked ETFs include the Energy Select Sector ETF (XLE) and the Oil and Gas Exploration ETF (XOP).
Materials – Mining companies, chemical manufacturers, and metals producers. Copper miners respond to industrial demand; gold miners respond to different forces entirely. Commonly tracked ETFs include the Materials Select Sector ETF (XLB) and the Gold Miners ETF (GDX).
Industrials – Manufacturing, construction equipment, and infrastructure-related businesses. These companies benefit from increased capital spending during economic expansions. A commonly tracked ETF is the Industrial Select Sector ETF (XLI).
Transportation – Airlines, railroads, and shipping companies benefit from higher trade volumes, though fuel costs create a partial earnings offset. Commonly tracked ETFs include the Transportation ETF (IYT) and the Global Jets ETF (JETS).
These sectors experience the most dramatic earnings changes during commodity upcycles, and tend to reverse just as sharply when prices correct.
Currency movements add another layer to this analysis. A weaker dollar tends to boost global demand and commodity prices by making dollar-denominated commodities cheaper for overseas buyers. Moreover, a weaker dollar often coincides with a global liquidity expansion that further supports commodity demand, amplifying the tailwind. A stronger dollar can create headwinds through the same mechanism in reverse. That relationship is covered in How a Strong Dollar Affects the S&P 500 .
Why Commodity Cycles Eventually Reverse
Commodity booms contain the seeds of their own reversal. Rising prices attract new investment in production capacity. As new supply enters the market over the following years, the price support weakens. Simultaneously, high commodity prices slow demand: energy costs increase operating expenses, construction projects become more expensive, and manufacturers substitute or reduce consumption.
Upcycles typically run 3 to 7 years, followed by downturns of similar duration. Cycle duration can vary significantly depending on structural shifts such as the energy transition, geopolitical supply disruptions, or sudden demand shocks. The 2000s commodity supercycle, driven by China's industrialisation, lasted nearly a decade and saw copper rise from $0.60 to over $4.00 per pound before reversing sharply in 2011. These turning points rarely arrive in isolation – they coincide with broader shifts in global growth and monetary policy that the Daily Market Analysis Framework tracks through internals, credit spreads, and sector flow data.
What to Monitor in Commodity Markets
Professional investors track several indicators when assessing commodity cycle conditions.
Global manufacturing PMI – Readings above 50 signal expansion and rising commodity demand across major economies. The composite PMI for China, the U.S., and the Eurozone together provide the broadest demand signal.
Inventory levels – The Energy Information Administration publishes weekly oil inventory data. The London Metal Exchange reports warehouse levels for copper, aluminium, and other metals. Falling inventories signal tightening supply; rising inventories signal the reverse.
Infrastructure spending plans – Major government programs signal multi-year demand for materials. China stimulus packages, U.S. infrastructure legislation, and European green energy investment all carry multi-year demand implications for metals and energy.
Geopolitical events – Supply disruptions in key producing regions carry immediate price implications. Middle East tensions affect oil. Political instability in Chile and Peru affects copper. Sanctions on Russia affect multiple commodity markets simultaneously.
Capital expenditure trends – Rising capex among major producers signals confidence in sustained high prices; falling capex signals the opposite and historically precedes the next supply shortage cycle.
Risks in Cyclical Sectors
Commodity investing carries risks that do not apply to other sectors.
Volatility is extreme in both directions. A 30% decline in a commodity price can cut producer profits in half or more through the same operating leverage that amplifies gains on the upside.
Political risk is significant. Mining operations can be nationalised. Production can be disrupted by strikes or civil unrest. Export taxes and royalty regimes can change with little warning, as has occurred repeatedly in Latin America and Africa over the past decade.
Regulatory shifts can alter sector economics structurally. Carbon taxes, emissions limits, and environmental permitting requirements affect the long-term viability of fossil fuel and mining projects.
Technological change creates long-term demand uncertainty. The transition toward electric vehicles increases copper demand per vehicle – EVs require roughly 2.5 to 4 times more copper than internal combustion vehicles – but battery chemistry evolution and efficiency improvements introduce uncertainty into long-run demand projections for specific metals.
Additionally, in severe risk-off episodes, cyclical stocks can decline sharply even if commodity prices remain elevated, due to forced selling and contagion across equity markets.
Implementation: Gaining Cyclical Exposure
For those monitoring the space, commonly tracked sector ETFs include the Energy Select Sector ETF (XLE), which holds major integrated oil companies; the Materials Select Sector ETF (XLB), which covers chemicals and mining; and the Industrial Select Sector ETF (XLI), which spans manufacturers and infrastructure businesses. Transportation-focused ETFs such as IYT and JETS are also widely followed.
For direct commodity exposure, the Invesco DB Commodity Index Tracking Fund (DBC) and the iShares S&P GSCI Commodity-Indexed Trust (GSG) are widely tracked instruments that provide broad commodity index exposure.
Individual stocks that serve as bellwethers in their respective industries include Exxon Mobil (XOM) in energy, Freeport-McMoRan (FCX) in copper mining, and Caterpillar (CAT) in industrial equipment.
Where We Are Now: March 2026
As of March 2026, oil trades above $100 per barrel for the first time since 2022 and copper is near all-time highs. Geopolitical tensions affecting Middle East supply, combined with years of underinvestment in new production during the low-price period of 2015–2020, are providing structural support to the rally.
However, as early April 2026 demonstrated, energy stocks can stall even with elevated commodity prices if institutional flow data indicates rotation has paused. Tracking sector ETF relative strength and volume against the broader index, as outlined in the Daily Market Analysis Framework , helps distinguish between a sustained rally and a temporary divergence.
The forces that could reverse the rally include diplomatic de-escalation in the Middle East, demand destruction from sustained high prices, and a sharper-than-expected global growth slowdown. Whether the current commodity strength is a sustained upcycle or a geopolitically driven spike depends on which of these forces dominates over the next two to four quarters. Tracking how commodity sector ETFs behave relative to the broader index – and whether that outperformance is narrowing or broadening – provides the most direct read on institutional conviction in the cycle. That process fits within the sector flow analysis step of the Daily Market Analysis Framework .
Key Takeaways
| Concept | Summary |
|---|---|
| Cycle driver | Global growth raises demand for raw materials, which flows into producer revenues |
| Operating leverage | Fixed cost structures amplify earnings during price upcycles – and compress them during downturns |
| Supply lag | New mines and oil fields take 5–10 years to develop, sustaining price spikes during demand surges |
| Cycle length | Upcycles historically run 3–7 years, but duration can vary with structural shifts |
| Key sectors | Energy, Materials, Industrials, Transportation |
| Risk factors | Volatility, political risk, regulatory change, technological shifts, equity-market contagion |
| Leading indicators | Global PMI, commodity inventory levels, government capex plans, geopolitical supply signals |
Go Deeper: Breakout Bulletin Macro Intelligence Series
- The Sorting Hat for Stocks – Master guide to all four macro stock groups
- How to Read the Stock Market Like a Professional: The 5-Layer Framework – Regime identification, internals, and daily execution
- Why Rising Interest Rates Hurt Growth Stocks – How rate cycles interact with commodity demand
- How a Strong Dollar Affects the S&P 500 – Currency effects on commodity prices and multinational earnings
- Defensive Stocks Explained – Where capital goes when the commodity cycle turns
- Market Regime Identification Framework – Classifying the current environment
- Daily Market Analysis Framework – Applying macro signals in a structured daily process
- Sector Rotation Strategy – How commodity cycles drive sector leadership rotation
- Pre-Market Routine for Macro Traders – How to track commodity signals before the market opens
This article is published by BreakoutBulletin for educational purposes only. It does not constitute investment advice or a recommendation to buy or sell any security. Commodity cycles and sector performance vary across economic conditions and should be interpreted within broader market context. References to specific ETFs, sectors, and historical examples are for illustrative purposes only. Past performance is not indicative of future results. BreakoutBulletin is an educational content platform and is not a registered investment advisor, broker-dealer, or financial institution.