
Stock price is the number most investors look at first. It's also one of the least informative data points for understanding a company's size. Market capitalization is the metric that actually answers the question.
The Calculation
Market capitalization equals the current stock price multiplied by the total number of shares outstanding.
Apple trading at $180 with 15.5 billion shares outstanding produces a market cap of roughly $2.8 trillion. Tesla trading at $250 with approximately 3.2 billion shares outstanding produces a market cap of approximately $800 billion. Despite Tesla's higher per-share price, Apple is more than three times larger by market cap.
This relationship – between share price and company size – is consistently misread by new investors. A $5 stock is not a "cheaper" company than a $200 stock. It may be dramatically larger or smaller depending on how many shares exist.
Why the Distinction Matters
Berkshire Hathaway Class A (BRK.A) trades above $600,000 per share. Its market cap of roughly $900 billion is substantial but smaller than Apple's. The per-share price reflects the company's decision never to split its Class A shares – not any particular measure of company scale.
Conversely, a stock trading at $0.50 may represent a company with 10 billion shares outstanding, placing it in the hundreds of millions in total market cap – larger than many businesses with double-digit share prices.
The only number that tells you how big a company actually is, by the market's current assessment, is market cap.
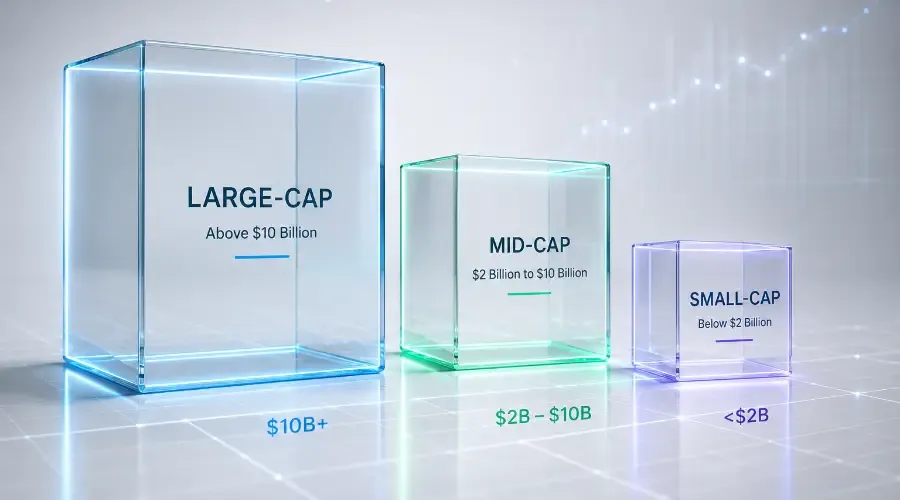
The Three Categories
Large-cap: above $10 billion
Companies with market caps above $10 billion are the most established public businesses. Apple, Microsoft, Amazon, JPMorgan Chase, and Johnson & Johnson are in this category. Large-cap companies tend to have longer operating histories, more diversified revenue streams, stronger balance sheets, and lower volatility than smaller companies. They grow more slowly, which is the trade-off for greater stability.
Mid-cap: $2 billion to $10 billion
Mid-cap companies are typically established businesses in growth phases – past the startup risk stage but still expanding market share, geographic reach, or product lines. They carry more volatility than large-caps and more growth potential. Many of today's large-caps were mid-caps 10 to 15 years ago.
Small-cap: below $2 billion
Small-cap companies carry the highest risk profile. They may be profitable or not, growing rapidly or struggling to scale, and they trade with lower daily volume – which means prices can swing significantly on relatively small orders. A meaningful percentage of small-cap companies fail or stagnate. A smaller percentage produce the kind of multi-year returns that draw investors to the category.
The risk-return profile of small-caps suggests keeping their share of a portfolio intentional and limited, particularly early in an investing timeline when losing capital has the most compounding impact.
How Market Cap Appears in Practice
Most financial platforms display market cap directly on a company's profile page. Google Finance, Yahoo Finance, and brokerage apps all show it prominently. It's one of the first numbers to check when evaluating an unfamiliar company.
Market cap also explains index construction. The S&P 500 is market-cap weighted, which is why Apple and Microsoft represent approximately 7% of the index each – their size in the market proportionally determines their weight in the index.
Market Cap vs. Valuation
Market cap is not the same as a company being fairly valued. A company can be large by market cap and still be overpriced relative to its earnings, cash flows, or growth prospects. A small company can be undervalued despite a modest market cap.
Market cap tells you how the market currently values the company based on prevailing share price. Whether that valuation is justified requires additional analysis – earnings growth, margins, competitive position, and future prospects. Market cap is the starting point, not the conclusion.
Practical Takeaway
Before buying any stock, check the market cap. It tells you the category (large, mid, or small), which implies a rough risk and volatility profile. It also prevents the common mistake of equating a high stock price with a larger, safer company – a correlation that doesn't hold.
This content is for educational purposes only and does not constitute investment, legal, or tax advice. Investing in securities involves risk, including possible loss of principal. Always conduct your own research and consult a licensed financial professional before making investment decisions.
Market cap is the primary metric for understanding company size and risk profile. The natural next step is understanding how companies in different size tiers behave differently - and how the growth-vs-value distinction cuts across those tiers.
→ Stock Categories and Types → The complete framework for categorising stocks by size and style - www.breakoutbulletin.com/article/stock-categories-market-cap-growth-value
→ Large-Cap, Mid-Cap, and Small-Cap Stocks → The risk, return, and volatility profile of each tier - www.breakoutbulletin.com/article/large-cap-mid-cap-small-cap-stocks-explained
→ Growth vs. Value Stocks → How pricing philosophy interacts with company size across market cycles - www.breakoutbulletin.com/article/growth-vs-value-stocks-for-teens