
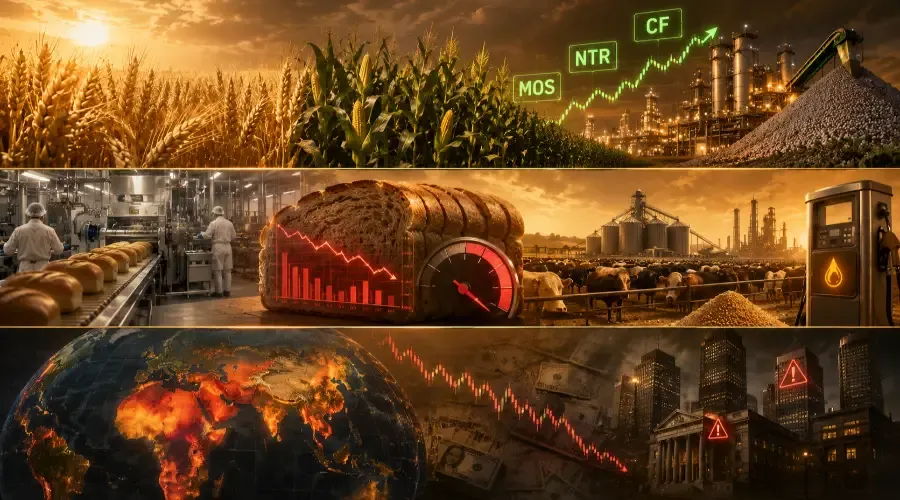
A grain price spike playbook for agricultural commodity trading – how food inflation investing, fertiliser stocks, and the ethanol market signal sector rotation before the crowd catches on.
A grain spike is not a single story about bread prices. It’s three stories that hit the market at different speeds, and the sector that wins is the one most traders sell by mistake. The first story is food inflation tearing through XLP margins within a quarter. The second is ethanol math rattling an obscure corner of the energy complex. The third, the one that takes the longest to arrive, is emerging-market credit stress showing up in bank portfolios. None of them looks like a standard commodity cost-push, and all of them start with an XLB fertiliser trade that most retail books get backwards. This post maps every link in the chain, with precise sector direction, timing, and the early-warning data to watch before the crowd catches on.
Al Jazeera tracked the consumer pain mounting in real time in March 2022 as wheat and corn prices surged following Russia's invasion of Ukraine. The Bureau of Labor Statistics had already documented the mechanism in an earlier analysis: high grain prices ripple throughout the economy through channels most traders never trace. The USDA Economic Research Service had studied agricultural commodity price spikes dating to the 1970s and drawn the same conclusion each time – the economic transmission runs further and deeper than commodity markets alone suggest. What none of those sources did was convert the grain spike into a US stock-sector winners-and-losers map with a trading framework attached. That is the gap this post fills – because a wheat and corn spike runs three simultaneous transmission pathways through the economy, and the most important sector call is one most traders get completely wrong: XLB is a winner, not a loser.
Why This Matters More Than Most Traders Realize
Wheat and corn are not niche agricultural commodities with limited equity market relevance. They are foundational inputs to the global food system, the US ethanol industry, the global livestock sector, and the fertiliser demand cycle – four supply chains that collectively touch every GICS sector in the S&P 500 to some degree.
The quantitative framing makes the stakes concrete. Corn alone is the most produced crop in the United States – approximately 15 billion bushels annually – and its uses span food manufacturing (high-fructose corn syrup, corn starch, corn flour), ethanol production (approximately 40% of US corn goes to ethanol), and animal feed (approximately 36% of US corn goes to livestock feed). Wheat is the primary input for flour, bread, pasta, and processed grain products consumed by every American household. When both spike simultaneously – as they did in 2008, 2010-2011, and 2022 – the transmission runs through food manufacturing, energy markets, livestock farming, and emerging market economies simultaneously.
What most analysis misses is the three-pathway structure of the transmission. Most posts describe grain spikes as a food inflation story. That is one pathway. The ethanol channel creates a second pathway into energy markets. The emerging market food stress creates a third pathway into global credit markets. Understanding all three – and the sector implications of each – is the institutional-grade analytical edge that this post provides. [LINK: Agriculture Hub]
The Chain Reaction: Three Simultaneous Pathways Through the Economy
Pathway One: The Food Inflation Chain
The first sector to move in the food pathway is always Materials (XLB) – and it moves as a winner, not a loser. This is the most counter-intuitive sector call in the entire agriculture series, and the one most retail traders get backwards. When wheat and corn prices spike, farmers face a powerful economic incentive to plant more acres of those high-value crops in the next growing season. To plant more acres, they need more fertiliser – nitrogen fertiliser for corn, potassium for wheat, phosphate for both. The companies that produce these fertilisers – Mosaic Company, Nutrien, CF Industries, and ICL Group – all sit within XLB or are directly comparable to XLB constituents. These companies see their order books fill immediately as grain price signals reach the agricultural input purchasing cycle. The BLS research on grain price ripple effects specifically identified fertiliser cost inflation as one of the first documented transmission responses. Expect XLB fertiliser names to outperform broader XLB by 15–30% in the quarter following a major grain spike – the most reliable sector winner in an agricultural commodity event.
The second movement in the food pathway reaches food manufacturers (XLP) within one to two quarters. General Mills, Kraft Heinz, Campbell Soup, J.M. Smucker, and Tyson Foods all carry wheat flour, corn-derived ingredients, or corn-fed livestock as primary cost inputs. When CBOT wheat futures move from $6 to $12 per bushel, the flour cost embedded in a bread loaf doubles – but the retail price of that bread cannot double simultaneously without destroying demand. The margin compression for food manufacturers is immediate and documented: the BLS producer price index for processed grain products historically follows CBOT wheat with a six to twelve week lag. XLP faces earnings estimate reductions within one to two quarters of a sustained grain spike as COGS revisions flow through analyst models.
The third movement in the food pathway is the livestock multiplier – a secondary transmission that most analysis skips entirely. Approximately 36% of US corn goes to animal feed. When corn spikes, the cost of feeding cattle, hogs, and poultry rises in the same quarter. Meat producers (Tyson Foods, Pilgrim's Pride within XLP) face a double squeeze: they buy corn-fed livestock at higher costs and sell processed meat products into a consumer base that is already spending more on staple grains. This livestock channel amplifies XLP's margin compression beyond what the direct grain cost impact would suggest.
Pathway Two: The Ethanol-Energy Link
The second pathway runs through the energy complex and is unique to corn among agricultural commodities. Approximately 40% of US corn production goes to ethanol refineries, where it is converted to fuel ethanol blended into gasoline under the Renewable Fuel Standard (RFS) mandate. When corn spikes, ethanol production costs rise – which pushes ethanol prices higher and creates ripple effects through the gasoline blending economics. Corn ethanol producers and integrated biofuel companies within the energy complex see their input costs surge alongside corn.
The counter-movement within XLE is the RINs (Renewable Identification Numbers) credit system. Oil refiners that blend ethanol into gasoline are issued RINs credits; refiners that cannot blend must purchase RINs from those who can. When corn spikes and ethanol production becomes more expensive, the economics of the RINs credit market shift – creating margin changes for both ethanol producers and conventional oil refiners. This mechanism is specific to corn and has no equivalent in wheat, soybean, or any other agricultural commodity.
Pathway Three: Emerging Market Credit Stress
The third pathway runs outside the US equity market entirely – but it creates a measurable XLF risk signal. The United States, Canada, Australia, and a handful of other countries are net grain exporters. Most of the world's population lives in net grain-importing countries – Egypt, Indonesia, Pakistan, Nigeria, the Philippines, Morocco, and dozens of others. When wheat and corn spike, these nations face a higher import bill measured in US dollars. Their trade deficits widen, their foreign exchange reserves deplete, their currencies face depreciation pressure, and their governments face fiscal stress from food subsidy programs.
When this EM stress reaches the level where sovereign credit ratings are pressured or currency crises emerge – as it did in 2010-2011 when the Arab Spring was partly catalysed by food price stress – US financial institutions with EM loan exposure face rising credit risk. XLF banks with significant developing market operations or EM bond exposure see their credit risk metrics deteriorate in the two to four quarters following a sustained grain spike that produces genuine EM fiscal stress.
Sector-by-Sector Impact: Who Wins, Who Loses, and When
A practical note on position expression: The fertiliser call is most direct through individual names like MOS, NTR, or CF rather than broad XLB, because the latter includes steel, chemicals, and miners that dilute the grain spike signal. Similarly, the XLP underweight is a basket-level view, but the genuine pain sits inside processed-food manufacturers-not household products or tobacco, which are also in XLP. For XLF, isolating EM-exposed banks matters; a blanket XLF short or underweight captures a lot of domestic credit noise unrelated to grain prices. The percentage estimates below are broad ETF-level guides, but execution benefits from drilling into the sub-sector or single-name level.
Materials (XLB) – Strong Positive – Immediate to 1–3 Months. Fertiliser companies are the primary equity market winners from a grain price spike – the most important and most frequently missed call in agricultural commodity analysis. Mosaic Company, Nutrien, and CF Industries see order book acceleration as farmers respond to higher grain prices by planning expanded acreage for the next growing season. The mechanism is timing-sensitive: fertiliser purchasing decisions happen in the two to three month window before planting, so a spring grain spike drives fall fertiliser orders, and a fall spike drives spring orders. XLB fertiliser names historically outperform the broader XLB ETF by 15–30% in the two quarters following a major grain spike. This is the single most reliable and most overlooked sector trade in agricultural commodity events.
Energy (XLE) – Mild Positive – 1–3 Months. The ethanol channel creates a modest positive for the energy sector. Higher corn prices raise ethanol costs, which eventually support ethanol pricing through the blending mandate economics. The direct XLE impact is limited because major integrated oil companies have diverse revenue streams that dwarf their ethanol exposure. The cleaner expression is in pure-play ethanol producers, but these are small-cap names outside major ETFs. Expect 1–2% relative outperformance for the corn-ethanol-exposed sub-sector of XLE, with the broader ETF showing near-neutral signal.
Industrials (XLI) – Mild Positive – 1–3 Months. Agricultural equipment manufacturers – John Deere, AGCO Corporation, CNH Industrial – within or comparable to XLI components see order acceleration when grain prices spike, as farmers' improved revenue outlook prompts investment in new equipment. This is the agricultural capex response to higher crop prices. Deere's management has historically flagged grain price levels as a key driver of equipment replacement demand in their quarterly earnings calls. Expect 2–3% relative outperformance in agricultural equipment names within XLI during sustained grain spikes.
Utilities (XLU) – Mild Negative – 1–3 Months. The food inflation channel that grain spikes create feeds into CPI, which raises inflation expectations, which pressures bond-proxy sectors like XLU through the interest rate expectations mechanism. The connection is indirect but consistent with every prior cost-push commodity post. Expect 1–2% relative underperformance as the rate expectations channel activates.
Real Estate (XLRE) – Mild Negative – 1–3 Months. Rising food inflation feeds into broader CPI expectations and upward pressure on interest rates, which compresses real estate valuations through the discount rate channel. The connection is the same second-order mechanism as in crude oil and natural gas posts – commodity-driven CPI risk raises rate expectations, which pressures rate-sensitive assets. Expect 1–2% relative underperformance over two quarters.
Technology (XLK) – Mild Negative – 1–3 Months. The Fed policy channel: sustained grain-driven food inflation increases the probability of a hawkish monetary policy response, which compresses long-duration growth stock multiples. The direct connection between wheat/corn and technology company economics is negligible; the indirect rate expectations channel produces a modest headwind. Expect 1–2% relative underperformance in a sustained, large-magnitude grain spike scenario.
Consumer Discretionary (XLY) – Moderate Negative – 3–9 Months. When food costs rise – the most inelastic component of consumer spending – households reduce discretionary spending to maintain food and essential purchasing. The income substitution effect from food inflation to discretionary spending compression is well-documented in the BLS Consumer Expenditure Survey: lower-income households reduce restaurant visits, clothing purchases, and entertainment spending first when food-at-home costs rise. Expect 3–5% relative underperformance over two to three quarters in a sustained grain spike, concentrated in value-market consumer brands rather than premium discretionary.
Consumer Staples (XLP) – Significant Negative – 1–3 Months. This is the most important losing sector call in a grain spike and the one that arrives faster than most traders expect. Food manufacturers face COGS surge within one to two quarters – wheat flour costs, corn syrup costs, corn-fed meat costs, and corn-based packaging materials all move with CBOT prices. The pricing power question is central: large branded food companies can eventually raise retail prices, but the time lag between input cost spike and approved retail price increase is typically two to four quarters, compressing margins in the interim. XLP historically underperforms SPY by 4–7% over two quarters following a major grain spike, with the margin compression appearing in the first earnings cycle after the spike and continuing through the retail price recovery cycle.
Communication Services (XLC) – Mild Negative – 3–9 Months. Consumer stress from food inflation reduces discretionary spending including media subscriptions and entertainment, and compresses corporate advertising budgets as food manufacturers face reduced revenue. Expect 1–2% relative underperformance over two to three quarters.
Healthcare (XLV) – Mild Negative – 3–9 Months. Nutritional stress from food price inflation – particularly in lower-income populations – has documented health consequences that eventually raise healthcare utilisation. The more immediate XLV connection is through the inflation expectations channel: grain-driven CPI raises rate expectations, which compresses healthcare growth multiples modestly. Expect 1% relative underperformance in sustained large-magnitude spikes.
Financials (XLF) – Moderate Negative – 3–9 Months. The EM credit risk channel is XLF's primary grain spike exposure. Banks with significant EM loan portfolios or EM sovereign bond exposure face rising credit risk as food-importing nations face fiscal stress. The timeline is long – EM fiscal stress from food prices builds over two to four quarters before appearing in credit market indicators – but the magnitude can be significant when the grain spike is large and sustained enough to trigger genuine sovereign stress in food-dependent nations. Expect 2–4% relative underperformance in XLF names with material EM credit exposure in a major, sustained grain spike scenario.
Historical Cases That Confirm the Pattern
2007–2008 | The Global Food Crisis – Pathways Confirmed at Scale
The 2007–2008 global food crisis sent CBOT wheat from approximately $4 per bushel in mid-2007 to a peak of $13 by March 2008 – a 225% surge – and corn from $3.50 to over $8 by June 2008. The USDA ERS documented the event as the most severe agricultural price spike since the 1970s. The three-pathway transmission played out simultaneously: fertiliser companies within XLB saw explosive demand as farmers globally tried to expand acreage in response to price signals – Mosaic Company's stock tripled from 2007 to its 2008 peak. XLP food manufacturers reported severe margin compression across the 2007–2008 fiscal years as wheat flour and corn syrup costs rose faster than they could raise retail prices. The EM credit pathway activated with particular severity – the FAO food price index triggered food riots in over 30 countries, and several food-importing nations sought IMF emergency lending. XLF banks with EM exposure saw their sovereign credit risk metrics deteriorate throughout H1 2008, though this was partially obscured by the simultaneous GFC credit crisis. Lag window: XLB fertiliser names immediate; XLP margin compression within two quarters; EM credit stress within three to four quarters.
2010–2011 | Russian Drought, Arab Spring, and the EM Pathway Confirmation
A severe Russian drought in summer 2010 destroyed approximately one-third of Russia's wheat crop, triggering an export ban and sending CBOT wheat from $4.50 to $8.60 per bushel within weeks. Corn simultaneously spiked on US growing season concerns. The EM pathway produced its most historically significant outcome: the FAO Food Price Index reached an all-time record in February 2011, directly preceding the Tunisian uprising in December 2010 and the Egyptian revolution in January 2011 – events collectively identified as the Arab Spring. The food-to-geopolitical chain of causation documented by Al Jazeera and multiple academic studies demonstrated that the EM stress pathway from grain spikes can produce geopolitical risk events that feed back into US equity markets as risk-off signals. Mosaic and Nutrien predecessors surged 40–60% as fertiliser demand accelerated. XLP food companies reported their worst margin quarters in a decade. XLY restaurant chains and casual dining reported traffic declines as food-at-home costs crowded out restaurant spending. Lag window: XLB fertiliser within weeks; XLP margin compression within two quarters; EM geopolitical risk realisation three to four months after the grain peak.
2022 | Ukraine War and the Full Pathway Activation
Russia's invasion of Ukraine in February 2022 triggered the most geographically concentrated grain supply shock in modern history. Ukraine supplied approximately 30% of global wheat exports and 15% of global corn exports – meaning a single military event removed a massive share of seaborne grain supply within weeks. CBOT wheat jumped from $7.50 to $13.63 per bushel within a month; corn moved from $6.50 to $8.20. Al Jazeera documented consumer pain mounting in real time across food-importing nations. The XLB fertiliser trade was complicated by the simultaneous surge in natural gas prices (Russia is a major fertiliser producer, and natural gas is the primary feedstock for nitrogen fertiliser) – Mosaic and Nutrien saw extraordinary performance as both the grain price signal and the Russian fertiliser supply disruption worked simultaneously in their favour. XLP food companies like General Mills and Kraft Heinz reported the worst cost inflation in their modern operating histories, with gross margin compression of 300–500 basis points in the quarters following the spike. The ethanol channel added complexity: corn near $8/bushel made ethanol production marginally uneconomical at existing blending mandate levels, pressuring ethanol producers within XLE. Lag window: XLB fertiliser immediate; XLP earnings misses within two quarters; retail food price pass-through appearing in CPI food-at-home data within three quarters.
The Reversal Signal: When the Grain Spike Trade Is Over
Grain price spikes are the most weather-dependent major commodity event – meaning the reversal signal often comes from a forecast, not from realised production data.
Watch the USDA WASDE report monthly (released the second week of each month). The World Agricultural Supply and Demand Estimates is the most authoritative source for global grain balance sheet data. When the WASDE shows global ending stocks recovering toward historical average – specifically when wheat stocks-to-use rises above 30% or corn stocks-to-use rises above 13% – the fundamental supply tightness that drove the spike is resolving. The WASDE release that first shows supply recovery is historically a reliable reversal signal.
Monitor the US Drought Monitor weekly (drought.gov, published every Thursday). For corn specifically, drought recovery in the US Corn Belt – a weekly improvement in drought conditions across Iowa, Illinois, Indiana, and Nebraska – is a supply recovery signal that precedes USDA production estimate revisions by four to eight weeks. When Drought Monitor data shows three consecutive weeks of drought improvement across the primary corn-producing counties, the spike is losing its weather-premium support.
Watch XLB fertiliser stock relative performance as the leading indicator of the reversal. Fertiliser companies are the first to benefit from a grain spike and among the first to peak – because their order books respond to farmer planting intentions, which are finalised six to eight months before the next harvest. When Mosaic and Nutrien begin underperforming XLB broadly after a period of outperformance, the fertiliser order cycle is signalling that farmer planting expansion plans are complete and the incremental demand surge is finished.
The Before/During/After Playbook
Before: What to Watch for Early Warning
Monitor the USDA Crop Progress Report weekly (published every Monday at 4pm EST by the USDA National Agricultural Statistics Service at nass.usda.gov during the growing season). The Crop Progress report rates the condition of corn and winter wheat crops on a scale of very poor to excellent. When the percentage of corn rated good-to-excellent falls below 60% during July – the critical pollination period – the setup for a weather-driven spike is forming. Three consecutive weekly deteriorations in crop condition ratings during July and August have historically preceded CBOT corn price surges of 15% or more within four to six weeks.
Track the US Drought Monitor weekly (drought.gov, Thursdays) for the US Corn Belt states. When D2 (severe) or D3 (extreme) drought conditions expand to cover more than 25% of Iowa, Illinois, Indiana, or Nebraska acreage during the growing season – states that collectively produce approximately 60% of US corn – the probability of a production miss large enough to spike prices rises dramatically. This data is free, weekly, and geographically specific enough to identify regional crop stress before it appears in any official USDA estimate.
Monitor the FAO Food Price Index monthly (fao.org, released first Friday of each month). The FAO tracks global food prices across cereals, dairy, meat, sugar, and vegetable oils. When the cereals sub-index rises more than 10% year-over-year for three consecutive months, the global grain price environment is tightening enough that the EM credit risk pathway is beginning to activate. Watching the FAO alongside CBOT prices gives you the geographic spread of the spike – whether it is US-domestic or global – and therefore whether the EM credit risk channel in XLF is relevant.
During: Positioning When Grain Prices Are Spiking
Buy Mosaic Company (MOS), Nutrien (NTR), and CF Industries (CF) directly or through broad XLB exposure as the primary expression of the grain spike. These three names are the most direct equity market beneficiaries of higher grain prices through the fertiliser demand channel, and they consistently outperform the broader XLB ETF during grain spike events. If you prefer the ETF approach, XLB provides diluted exposure with less concentration risk. Size the fertiliser position for a two to three quarter time horizon – fertiliser order acceleration typically runs for two growing seasons following a major grain price spike.
Underweight XLP relative to benchmark as the food manufacturer margin compression trade. This is not a short – it is a relative underweight that positions your portfolio to benefit from XLP's underperformance versus SPY without requiring a directional bet on absolute consumer staples returns. The entry is at the first USDA WASDE report that shows tightening global grain supply, before analyst earnings estimate revisions have caught up to the cost reality. Reduce the underweight when XLP management calls begin using language like "we are implementing price increases across our portfolio" – that language signals that the pass-through is underway and the worst of the margin compression is visible.
Monitor CBOT wheat and corn spreads (nearby futures versus deferred futures, available on the CME Group website) as a duration indicator. When nearby futures trade at a significant premium to deferred futures (backwardation) – meaning the market believes the shortage is current rather than structural – the spike is likely weather-driven and will resolve within one to two growing seasons. When the forward curve is flat (nearby and deferred prices similar), the market is pricing a structural supply shortage that could sustain the price spike for multiple years. The curve shape determines your position time horizon: backwardation means trade for one to two quarters; flat curve means hold the fertiliser position for two to three growing seasons.
After: The Lagged Rotation Trade
Add XLP on the first WASDE showing global supply recovery, when the grain price has fallen 20% or more from its spike peak and the forward curve has moved back to contango (deferred futures at a premium to nearby). XLP food manufacturers' margin recovery lags the commodity price decline by two to three quarters – the price pass-through that was compressing margins during the spike continues for one quarter after grain prices fall, as previously committed high-cost inventory clears. Buying XLP into the commodity price correction, before the margin recovery appears in earnings, has historically produced the best entry for the XLP recovery trade.
Reduce Mosaic and Nutrien positions when the USDA planting intentions report (published late March each year) shows corn planting intentions have expanded to the maximum practical acreage – typically when corn planted area approaches 92–95 million acres. At that level, the fertiliser demand response to the price spike has been fully fulfilled and incremental demand growth from further acreage expansion is limited. This planting data is the leading indicator of fertiliser order book saturation.
Watch XLY restaurant and casual dining sub-sector for recovery signals two to three quarters after grain prices peak. As food-at-home costs normalise from spike levels, consumer spending patterns begin reverting – restaurant visits recover, entertainment spending rebuilds. The XLY restaurant recovery typically begins four to six months after FAO Food Price Index year-over-year comparisons turn negative (meaning food prices are now below year-ago levels), as the income substitution effect that diverted spending from restaurants to grocery stores reverses.
The 3 Mistakes Most Retail Traders Make
Mistake 1: Selling XLB Because "Commodity Costs Are Rising"
The most common and most costly grain spike trading error is applying the cost-push framework mechanically and concluding that rising agricultural input costs must be bad for XLB – because every prior commodity post showed cost rises hurting XLB downstream users. Wheat and corn are the exception that overturns that pattern. XLB fertiliser companies are sellers of agricultural inputs, not buyers of grain. When grain prices spike, their customers – farmers – see higher revenue and therefore buy more fertiliser, boosting XLB fertiliser revenue rather than compressing it. Traders who sell XLB during a grain spike, expecting the standard cost-push XLB headwind, are selling the primary winner in the agricultural commodity event. The fertiliser sub-sector of XLB should be bought on a grain spike, not sold.
Mistake 2: Treating XLP as a Safe Haven During Food Inflation
The second mistake is buying XLP as a defensive position when grain prices spike, reasoning that consumers always buy food regardless of price and therefore food company stocks are safe havens during food price shocks. This logic confuses the inelasticity of consumer food demand with the economics of food manufacturing. Consumers do continue buying food – but the food manufacturers cannot immediately pass through the cost increase to retail prices. The lag between COGS surge and approved retail price increase is two to four quarters. During that lag, XLP margins compress significantly and earnings estimates are revised lower. XLP is not a defensive safe haven during a food commodity spike – it is the primary large-cap victim. The genuine defensive plays are XLV and XLU, not XLP.
Mistake 3: Ignoring the EM Credit Risk Timeline
The third mistake is expecting the EM credit risk channel to activate immediately and positioning for XLF underperformance in the first month after a grain spike. The EM fiscal stress that grain spikes create builds over two to four quarters – governments deplete foreign exchange reserves, subsidy programs strain budgets, and sovereign credit ratings are reviewed on quarterly or semi-annual cycles. If you short XLF within the first month of a grain spike expecting immediate EM contagion, you will be stopped out by the normal financial market volatility before the signal activates. The institutional approach monitors the FAO Food Price Index over multiple months, watches EM sovereign CDS spreads (Bloomberg) for widening, and only reduces XLF allocation on EM exposure when spreads on food-importing nation sovereigns begin widening consistently over six or more consecutive weeks.
Bottom Line: The One-Sentence Institutional Framework
When wheat and corn spike, buy XLB fertiliser names immediately as the primary winner, underweight XLP food manufacturers for the margin compression trade, monitor the USDA WASDE monthly for the reversal signal, and treat XLF EM credit exposure as a three-to-four quarter lagged risk rather than an immediate sell.
This framework works across cycles because the agricultural input purchasing cycle that makes fertiliser companies the primary grain spike beneficiaries does not change between 2008 and 2022. Farmers respond to higher grain prices by planning expanded acreage, and expanded acreage requires fertiliser – that decision sequence is as reliable as any in commodity markets. The XLP margin compression is equally structural: food manufacturers always face a lag between input cost spikes and retail price recovery, and that lag has appeared in every major grain spike documented in USDA ERS research dating to the 1970s.
The retail edge is owning the right side of XLB – fertiliser, not mining or steel – which requires understanding that agricultural commodity spikes run the cost-push chain in the opposite direction from every other commodity post in this series.
Key Takeaways: Grain Spike Sector Map at a Glance
- Wheat prices spike and corn prices spike → fertiliser stocks (MOS, NTR, CF) consistently lead. The immediate demand surge for nitrogen, phosphate, and potash makes the XLB fertiliser trade the highest-conviction long in any major grain rally.
- XLP food manufacturers don’t get a pass. The lag between spiking grain inputs and retail price adjustments creates a predictable window of margin compression, making XLP the key relative underweight in a food inflation investing playbook.
- Corn ethanol economics create a second-order XLE signal. Ethanol production costs rise with corn, shifting RINs credit markets and pressuring pure-play ethanol producers, though the broad XLE impact remains mild.
- EM food inflation crisis builds on a 2–4 quarter lag. Use the FAO Food Price Index and sovereign CDS spreads to time the XLF exposure reduction, not the immediate commodity move.
- The USDA WASDE report, US Drought Monitor, and CBOT curve shape are your positioning and reversal dashboard. Stock-to-use ratios, drought recovery, and backwardation tell you whether the spike is fleeting or structural.
Frequently Asked Questions
Q1. Why do wheat and corn prices spike?
Wheat and corn prices spike because of droughts, wars, export bans, supply shortages, or disruptions in global agricultural trade. Weather and geopolitics are the biggest drivers.
Q2. Which sectors benefit when grain prices rise?
Fertiliser companies within the Materials sector (XLB) are usually the biggest winners because farmers increase fertiliser purchases to expand crop production.
Q3. Why does XLP struggle during grain inflation?
Food manufacturers face rising wheat flour, corn syrup, livestock feed, and packaging costs before they can raise retail prices, causing temporary margin compression.
Q4. How do corn prices affect energy markets?
Corn is heavily used in ethanol production. Rising corn prices increase ethanol production costs and impact gasoline blending economics under the Renewable Fuel Standard.
Q5. Why are fertiliser stocks important during grain spikes?
Higher grain prices encourage farmers to plant more acreage, increasing demand for nitrogen, phosphate, and potash fertilisers.
Q6. What is the USDA WASDE report?
The USDA World Agricultural Supply and Demand Estimates (WASDE) report tracks global grain supply, demand, and ending stocks. Traders use it to identify reversal signals in grain markets.
Q7. How do wheat and corn spikes impact emerging markets?
Food-importing countries face higher import bills, currency pressure, fiscal stress, and rising sovereign credit risk when grain prices surge.
Q8. Which stocks usually outperform during agricultural inflation?
Fertiliser companies such as Mosaic, Nutrien, and CF Industries historically outperform during major grain price spikes.
This post is part of the BreakoutBulletin "What Happens When" series. [LINK: Agriculture Hub] · [LINK: Series Pillar Page]
Educational content only. Not investment advice. Past sector performance patterns do not guarantee future results