
What Happens When Uranium Prices Spike
A uranium bull market doesn’t behave like an oil or gas shock – and the traders who treat it that way learn an expensive lesson.
Analysts began discussing the possibility of uranium reaching $300 per pound – and the debate was no longer about whether it could happen, but what sequence of events would drive it there.
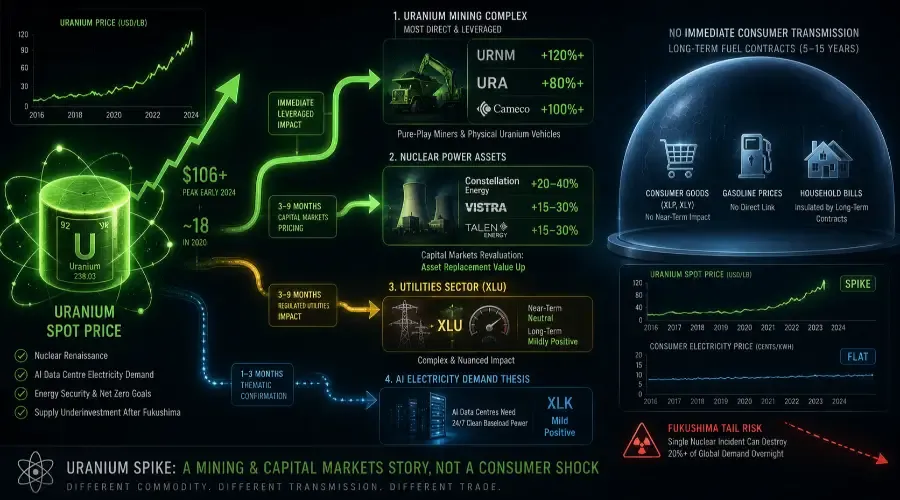
Uranium had already surged from roughly $18 per pound in 2020 to a peak above $106 in early 2024 – a nearly 500% rally in four years. The move was driven by the convergence of three powerful forces: a global nuclear power renaissance, explosive AI data center electricity demand that made low-carbon baseload power strategically critical, and a uranium supply chain still recovering from a decade of underinvestment following Fukushima.
What happens when uranium prices spike is a fundamentally different question from what happens when oil or gas prices spike – and the traders who apply the wrong framework lose money while the right trade runs without them. The uranium spike trading strategy that works strips away the usual energy sector playbook and starts from scratch.
Why This Matters More Than Most Traders Realize
Uranium is the only major energy commodity where a price spike does not translate directly or quickly into higher consumer energy costs – and that single structural fact changes everything about how you should trade it.
When crude oil spikes, gasoline prices rise within weeks and consumers feel it immediately. When natural gas spikes, utility bills follow within one to two regulatory cycles. When uranium spikes, the electricity bills of nuclear power consumers change by almost nothing in the near term, because nuclear utilities buy uranium fuel on long-term contracts that span five to fifteen years. The spot price of uranium – the price you see quoted on commodities platforms – is almost irrelevant to the current operating cost of an existing nuclear power plant. Utilities locked their fuel costs years ago.
What a uranium spike actually reprices is the entire forward economics of nuclear power – the capital markets thesis for building new reactors, the profitability of uranium miners, the strategic value of existing nuclear capacity, and the investment case for a sector that was written off after Fukushima and is now being reconsidered as the only scalable low-carbon baseload electricity source. One concrete data point frames the scale: uranium's fuel cost represents only 5–10% of a nuclear plant's total operating cost, compared to 70–80% for a gas-fired power plant. That asymmetry is the entire story. [LINK: Energy Hub]
The Chain Reaction: How a Uranium Spike Moves Through the Economy
The first sector to move is always the uranium mining complex – but here is the critical nuance that separates this post from every generic energy analysis: the uranium mining complex is not cleanly housed within XLE. The standard energy ETF holds crude oil producers, natural gas companies, and oil services businesses. Uranium miners are a small component at best. The primary vehicles for uranium exposure are specialised ETFs – the Global X Uranium ETF (URA) and the Sprott Uranium Miners ETF (URNM) – and individual stocks like Cameco Corporation, NexGen Energy, and Kazatomprom. When uranium prices spike, URA and URNM move dramatically while XLE barely registers the signal. In practice, the uranium ETF choice between URA and URNM defines the whole trade.
The second movement involves the capital markets repricing of nuclear power broadly, and it operates through a different mechanism than other commodity shocks. A uranium spike signals that the cost of building and fuelling new nuclear capacity is rising – which makes existing nuclear capacity more valuable, because replacement cost has increased. This is analogous to what happens in real estate when construction costs rise: existing properties appreciate because they are cheaper to own than to build new. Nuclear utilities with large existing reactor fleets – companies like Constellation Energy, Vistra, and Talen Energy – see their stock prices reprice as the market raises its estimate of the replacement value of their reactor assets. This is a capital markets valuation story, not an operating cost story.
The third movement reaches the broader Utilities sector (XLU) in a nuanced and counterintuitive way. Unlike a natural gas spike – where regulated gas utilities face immediate margin compression – a uranium spike has a mixed and complex effect on nuclear utilities. In the short term, operating nuclear plants are largely insulated because their fuel contracts are long-dated. In the medium term, a sustained uranium spike raises the forward cost assumptions for nuclear fuel procurement, which utilities must disclose in regulatory rate case filings, potentially supporting arguments for rate increases. In the long term – three to five years – a structural uranium bull market validates the economics of nuclear power expansion, which is bullish for utilities committed to nuclear generation. The XLU signal from a uranium spike is therefore mildly positive over a long horizon, neutral to mildly negative over the near term, and most importantly: far smaller in magnitude than the XLU signal from a gas spike.
The fourth movement is the electricity market repricing channel. Uranium spikes that signal a genuine structural shift in nuclear fuel availability raise the long-term cost assumptions for electricity generated from nuclear power – which, because nuclear is baseload generation that sets marginal electricity prices during off-peak hours, affects electricity market forward curves. Industrial electricity consumers, data centre operators, and energy-intensive manufacturers face higher long-term power purchase agreement costs when nuclear fuel cost structures shift upward. This channel transmits over years, not months, and primarily affects the capital expenditure planning of energy-intensive industries rather than their current operating costs.
The consumer and downstream economic transmission from a uranium spike is the most attenuated of any energy commodity. There is no equivalent to the gasoline consumer feeling the price at the pump, no XLP manufacturer facing immediate packaging cost increases, no XLI trucker repricing freight contracts. The uranium spike lives primarily in the mining stocks, the capital markets valuation of nuclear assets, and the very long-duration planning models of utilities and industrial electricity users. Trading it requires a completely different toolkit from every other energy commodity.
Sector-by-Sector Impact: Who Wins, Who Loses, and When
Energy (XLE) – Mildly Positive via Miners Only – Immediate.
The uranium mining sub-sector within XLE is small but present – and it moves dramatically when uranium spikes. However, the more important expression is outside XLE entirely: URA and URNM provide the undiluted uranium mining exposure that XLE cannot. Within XLE, the oil and gas majors are completely unaffected by uranium price moves. If you use XLE as your uranium expression, you are capturing perhaps 2–5% of XLE's weighted exposure to the uranium thesis, producing a muted and misleading signal. The correct approach is to use URA or URNM for uranium exposure and treat XLE separately.
Materials (XLB) – Mild Positive – Immediate to 1–3 Months.
The connection runs through the broader mining and materials complex. Uranium price spikes are often associated with broader commodity market themes – energy transition demand, supply chain geopolitics, resource scarcity pricing – that lift the entire mining complex including copper, lithium, and rare earths. XLB receives a sympathy lift when uranium is spiking as part of a broader energy transition commodity repricing. The magnitude is modest – 1–2% relative outperformance – and the connection is thematic rather than fundamental.
Industrials (XLI) – Mild Negative – 3–9 Months.
Energy-intensive industrial manufacturers face a long-dated cost headwind if uranium spikes signal structurally higher electricity costs in nuclear-powered regions. The transmission timeline is measured in years rather than months – power purchase agreements and utility rate structures adjust slowly. For practical trading purposes, the XLI impact of a uranium spike is negligible in any time horizon below twelve to eighteen months. The exception is nuclear construction companies and nuclear engineering firms within XLI, which benefit directly from a nuclear build-out thesis – but these are small sub-components of the ETF.
Utilities (XLU) – Complex Mixed – 3–9 Months.
The XLU signal from a uranium spike is the most analytically complex in this entire series. Pure nuclear utilities with large existing reactor fleets see their asset replacement value increase – which is bullish for their stock prices. Gas-fired utilities are unaffected. Regulated utilities face a long-dated fuel cost assumption revision that may support future rate case arguments. The net XLU signal is approximately neutral in the first six months, shifting to mildly positive over a twelve to twenty-four month horizon as the nuclear asset revaluation thesis becomes clearer. This is fundamentally different from the strong negative XLU signal produced by a natural gas spike.
Real Estate (XLRE) – Neutral – No Material Impact.
The transmission chain from uranium prices to real estate valuations is so attenuated – running through long-term electricity costs, rate expectations, and economic growth scenarios – as to be non-tradeable within any practical investment horizon. XLRE is effectively insulated from uranium price moves. The interest rate channel that connects other commodity spikes to XLRE does not apply cleanly here because uranium spikes do not immediately move inflation expectations the way oil or gas spikes do.
Technology (XLK) – Mild Positive – 1–3 Months.
This is a counterintuitive positive signal unique to the uranium sector. The AI data centre electricity demand thesis – which is one of the primary drivers of the nuclear renaissance and therefore a contributor to uranium demand – connects uranium price strength to the technology sector bullishness narrative. When uranium spikes on AI-driven electricity demand expectations, XLK technology stocks and particularly data centre infrastructure names receive a positive read-through: the market is implicitly confirming that AI electricity demand is real and large enough to reprice nuclear fuel. The magnitude is mild – 1–2% – but the direction is positive, making uranium the only energy commodity with a positive XLK correlation.
Consumer Discretionary (XLY) – Neutral – No Material Near-Term Impact.
The consumer transmission from uranium to discretionary spending does not exist on any practical investment horizon below three to five years. Electricity costs for households are set by utility rate cases that lag uranium spot prices by years via the long-term contract structure. You do not need to adjust your XLY positioning based on a uranium spike.
Consumer Staples (XLP) – Neutral – No Material Near-Term Impact.
The same logic applies to staples: the input cost chain from uranium to consumer goods does not transmit on any tradeable timeline. XLP companies face higher electricity costs in the very long run if uranium structurally reprices nuclear power, but this is a decade-long story, not a sector rotation trade.
Communication Services (XLC) – Neutral – No Material Impact.
No tradeable connection exists between uranium price spikes and communication services sector performance within any reasonable investment horizon.
Healthcare (XLV) – Mild Positive – Thematic Only.
Nuclear medicine – imaging tracers, cancer radiotherapy isotopes – represents a small but growing market that benefits from the broader nuclear industry investment cycle. Companies producing medical isotopes and nuclear medicine delivery systems see modest positive sentiment when the nuclear sector broadly attracts investment. This is a thematic correlation, not a fundamental transmission, and the magnitude is negligible for XLV as a whole.
Financials (XLF) – Mild Positive – 1–3 Months.
Investment banks and specialty finance companies advising on nuclear power plant construction, uranium streaming agreements, and nuclear energy project financing benefit from increased deal flow when uranium spikes trigger a nuclear investment cycle. Uranium royalty companies – the equivalent of gold streaming companies but for nuclear fuel – see significant outperformance. The XLF-level signal is mild because these activities are small relative to the broader financials sector, but at the sub-sector level, the nuclear finance niche can produce large individual stock moves.
Historical Cases That Confirm the Pattern
2003–2007 | Cigar Lake Flooding and the First Great Uranium Bull Market
This is the foundational case study for uranium spike analysis. Uranium prices sat near $7 per pound from 1990 to 2003– a prolonged depression caused by post-Cold War weapons-grade uranium entering the civilian market, suppressing mine development for over a decade.
The flooding of Cameco’s Cigar Lake mine – the world’s largest undeveloped high-grade uranium deposit – in October 2006 was the supply shock that sent uranium from approximately $45 in early 2006 to a peak of $136 per pound in June 2007, a near-tripling in eighteen months.
Cameco stock went from approximately $15 in 2003 to over $50 at the peak.
The uranium ETF equivalent that existed at the time saw similar performance. XLU utilities moved modestly positive as the nuclear asset revaluation thesis emerged, but the dominant trade was entirely in mining stocks. Consumer sector impacts were essentially zero – electricity bills did not move perceptibly during this period. Lag window: mining stocks repriced immediately and sustained throughout the cycle; XLU mildly positive over twelve months; no downstream consumer sector transmission detected.
2011 | Fukushima Disaster – The Uranium Collapse Case
The March 2011 Fukushima nuclear disaster in Japan provides the inverse case study – and it is essential context for understanding uranium spike analysis because it demonstrates what reverses the trade. When Fukushima caused Japan to shut down all 54 of its nuclear reactors, uranium demand collapsed by approximately 20% of global consumption overnight.
Uranium fell from $73 per pound to under $50 within months, and continued declining to below $18 by 2016. URA fell over 70% from its pre-Fukushima high over the following five years. XLU utilities with nuclear exposure sold off initially on regulatory risk concerns before recovering as gas prices provided alternative generation economics.
The lesson: uranium bull markets are uniquely vulnerable to single catastrophic events at nuclear facilities – a risk that has no equivalent in oil or gas commodity markets. Any position in uranium miners requires this tail risk in your framework.
Lag window: mining stocks repriced within days; XLU nuclear utilities fell 10–15% within two weeks on regulatory risk; full recovery took years.
2020–2024 | The Nuclear Renaissance and the AI Electricity Demand Thesis
Uranium's move from approximately $18 per pound in 2020 to over $106 in early 2024 represents the most structurally grounded uranium bull market in the commodity's history.
Unlike the 2003–2007 cycle – which was primarily supply-driven – the 2020–2024 move combined multiple demand catalysts: energy security concerns post-Russia-Ukraine (Europe needed non-Russian baseload power), net-zero emissions commitments requiring zero-carbon firm power, and the emergence of AI data centre electricity demand projections that made the 24/7 reliability of nuclear power uniquely attractive.
Cameco stock rose from approximately $8 in 2020 to over $60 at the 2024 peak. URNM gained over 400% from its 2020 lows.
Technology companies – Microsoft, Google, Amazon – signed nuclear power purchase agreements for the first time, confirming the AI-nuclear connection and producing the positive XLK read-through described in the sector analysis above.
Lag window: URA and URNM repriced throughout the multi-year cycle; XLK technology data centre thesis positive read-through confirmed in 2023–2024; XLU nuclear utility companies outperformed gas utilities significantly over the 2023–2024 period.
The Before/During/After Playbook
Before: What to Watch for Early Warning
Monitor the Ux Consulting Company uranium spot price and term price indicators (uxc.com, published weekly). Unlike crude oil and natural gas – which have highly liquid futures markets with real-time pricing – uranium trades primarily in over-the-counter markets with weekly price assessments rather than continuous futures quotes. The Ux spot price and the term price (the price utilities pay in long-term contracts) are the two numbers that matter. When the spot price rises faster than the term price – meaning the spot premium over term prices is widening – it signals that immediate demand is outstripping available spot supply, a historically reliable precursor to a sustained bull market.
Track reactor restart and new construction announcements from the World Nuclear Association (world-nuclear.org, updated continuously). Every reactor restart, life extension approval, or new construction contract announcement represents incremental demand for uranium fuel on a known forward timeline. The cumulative demand signal from a wave of announcements – as occurred in 2022–2023 when Belgium extended reactor life, France accelerated its nuclear programme, and multiple US utilities received life extension approvals – precedes the uranium spot price move by six to twelve months. This is the structural demand indicator that the smart money watches before the commodity traders respond.
Watch Cameco Corporation's quarterly earnings guidance and contract book disclosures (publicly available in Cameco's quarterly reports, filed on SEDAR and EDGAR). Cameco is the world's largest publicly traded uranium producer and its management commentary on contract book fill rates, production guidance, and price realisation is the most reliable forward indicator available for uranium market tightness. When Cameco management discusses difficulty filling long-term contracts at commercially attractive prices – language that signals utilities are competing for supply – the setup for a spike is forming.
During: Positioning When the Spike Is Live
Buy URNM (Sprott Uranium Miners ETF) for the most concentrated miner exposure rather than URA (which includes some nuclear utilities and diversified miners) or XLE (which barely captures uranium at all). URNM holds only pure-play uranium miners and physical uranium holding vehicles, giving you the highest beta to uranium price moves among available ETFs. The leverage ratio of URNM to uranium spot has historically been approximately 2–3x in bull markets – a 50% move in uranium spot has historically produced 100–150% moves in URNM. Size positions accordingly and set stop losses at meaningful technical levels rather than arbitrary percentages.
Add Constellation Energy (CEG) within XLU as the nuclear utility expression of the spike – separately from your mining position. Constellation operates the largest nuclear fleet in the United States and its earnings are directly tied to electricity market pricing that benefits from the higher replacement cost thesis described above. This is a lower-volatility, longer-duration expression of the uranium thesis compared to mining stocks, and it provides portfolio balance: miners are high-beta and high-volatility; nuclear utilities are moderate-beta and more durable.
Monitor the physical uranium trust vehicles – Sprott Physical Uranium Trust (U.UN on the Toronto Stock Exchange) – as a real-time indicator of institutional buying interest. When Sprott's trust is buying uranium in the spot market to back new share issuance, it directly tightens physical supply. Rising trust assets under management alongside rising uranium spot prices confirm that institutional demand is real, not speculative positioning in derivatives. This confirmation signal distinguishes a genuine supply-demand-driven spike from a momentum trade.
After: The Lagged Rotation Trade
Watch for the term price to catch up to the spot price (Ux Consulting weekly data) as the signal that the acute phase of the spike is ending. Historically, uranium spikes that begin in the spot market eventually pull the term price higher as utilities seeking to lock in long-term supply sign new contracts at elevated prices. When the spot-to-term premium narrows below $5 per pound – meaning spot and term prices have converged – the urgency trade is largely complete and the structural multi-year thesis takes over from the tactical spike trade.
Rotate from pure-play miners (URNM) into nuclear utilities (XLU nuclear sub-sector) approximately six to twelve months after a significant spike, as the capital markets revaluation of existing nuclear assets becomes the dominant return driver rather than the immediate miner revenue repricing. The miners capture the early-cycle move; the utilities capture the multi-year structural revaluation. The rotation mirrors the progression from early-cycle to mid-cycle within the nuclear bull market thesis.
Monitor new nuclear power purchase agreement announcements from technology companies and data centre operators as the signal that the AI electricity demand thesis is translating from narrative into contracted revenue. Microsoft's deal with Constellation for Three Mile Island restart power, announced in 2023, was the proof-of-concept moment that technology company demand for nuclear power was commercially real. Each subsequent PPA announcement of similar scale confirms the structural demand story and extends the investment thesis beyond the commodity trading cycle into a multi-year capital markets theme.
The 3 Mistakes Most Retail Traders Make
Mistake 1: Using XLE as the Uranium Expression
The most common and most costly mistake is buying XLE when uranium spikes because it is the familiar energy ETF and the one that shows up first in a search for energy sector exposure. XLE's uranium mining exposure is minimal – typically under 2% of the ETF's weighting – meaning a 100% move in uranium produces perhaps a 1–2% contribution to XLE's total return. You are not expressing the uranium thesis; you are expressing the crude oil and natural gas thesis with a trace amount of uranium accidentally included. The institutional approach is to use URNM for pure uranium mining exposure, URA for a slightly broader nuclear sector basket, or Cameco directly for the single largest-cap expression of the trade. XLE belongs in a completely separate analytical bucket.
Mistake 2: Buying XLU as the Uranium Beneficiary
The second mistake is reasoning that uranium spike equals higher nuclear fuel costs equals higher electricity prices equals XLU rally – and therefore buying XLU as the primary expression. This logic has three broken links. First, utilities buy uranium on long-term contracts that insulate them from spot price moves for years. Second, even if fuel costs eventually rise, regulated utilities go through a rate case process that takes twelve to eighteen months to produce any earnings benefit. Third, XLU is a blended ETF containing gas utilities, electric utilities, and water utilities – most of which have zero uranium exposure. The traders who bought XLU during the 2023–2024 uranium bull market significantly underperformed those who bought URNM, because they chose the consumer of uranium over the producer of uranium.
Mistake 3: Ignoring the Fukushima Tail Risk
The third mistake is treating uranium as a normal commodity trade without building in the unique catastrophic downside risk that defines this market. No other commodity experiences the equivalent of a single nuclear facility accident instantly destroying 20% of global demand. Oil does not have a Fukushima equivalent. Gas does not have a Fukushima equivalent. Uranium does – and it happened in 2011 with consequences that took a decade to fully resolve. Any position in uranium miners without a defined exit strategy for a nuclear incident scenario is a position that has not honestly accounted for its risk. The institutional approach is to hold uranium positions with explicit stop-losses, to avoid leverage, and to size positions knowing that a 50–70% drawdown in URNM is historically possible within weeks if a major nuclear incident occurs anywhere in the world.
Bottom Line: The One-Sentence Institutional Framework
When uranium spikes, buy URNM and individual miners for the immediate leveraged commodity repricing, not XLE and not XLU – because uranium is a mining stock story and a capital markets revaluation story, not a consumer cost-push story, and the sectors that move are the producers of the fuel, not the consumers of it.
This framework works across cycles because the structural asymmetry between uranium's fuel cost share of nuclear plant economics (5–10%) and its spot market volatility means that uranium price spikes produce enormous returns for mining companies without producing meaningful cost pressure on utilities or downstream consumers. The miners capture the full upside; the economy absorbs almost none of the downside. That asymmetry is permanent and structural – it does not change between the 2007 spike, the 2024 bull market, or whatever cycle comes next.
The retail edge is resisting the temptation to use familiar ETFs for an unfamiliar commodity. Uranium is the one energy trade in this entire series where the right answer is to step outside XLE and XLU entirely and go to the specialised instruments that actually capture the thesis.
Run this scenario through the [Breakout Bulletin Ripple Engine](LINK: Ripple Engine Tool) to see the full sector transmission map and compare how differently uranium transmits through the economy versus crude oil, natural gas, and gasoline – the contrast is the clearest illustration of why commodity-specific analysis beats generic energy sector analysis every time.
FAQ: Uranium Price Spikes and Stock Market Impact
What happens when uranium prices spike?
When uranium prices spike, uranium miners and nuclear fuel-related stocks usually rise sharply, while the impact on utilities and consumers remains limited because nuclear fuel is purchased through long-term contracts.
Why doesn’t a uranium spike immediately increase electricity bills?
Nuclear utilities typically buy uranium fuel under long-term contracts lasting 5–15 years. This means spot uranium prices have little immediate impact on electricity costs for consumers.
Which stocks benefit most from rising uranium prices?
Pure uranium miners and uranium-focused ETFs such as URNM and URA typically benefit the most because their revenues are directly linked to uranium pricing.
Why is URNM different from XLE during a uranium spike?
URNM is focused on uranium miners and physical uranium exposure, while XLE mainly contains oil and gas companies with very limited uranium exposure.
How does AI demand affect uranium prices?
AI data centers require massive amounts of reliable electricity, increasing interest in nuclear power as a scalable low-carbon baseload energy source. This has strengthened long-term uranium demand expectations.
What is the difference between uranium spot price and term price?
The spot price reflects short-term uranium transactions, while the term price reflects long-term supply contracts signed between utilities and uranium producers.
Why do nuclear utility stocks sometimes rise during uranium spikes?
Existing nuclear plants become more strategically valuable when uranium prices rise because replacement nuclear capacity becomes more expensive to build and fuel.
What is the biggest risk in uranium investing?
The largest historical risk is a major nuclear accident or regulatory event, such as Fukushima in 2011, which can rapidly destroy uranium demand and trigger severe declines in uranium mining stocks.
This post is part of the BreakoutBulletin "What Happens When" series. [LINK: Energy Hub] · [LINK: Series Pillar Page]
Educational content only. Not investment advice. Past sector performance patterns do not guarantee future results.