
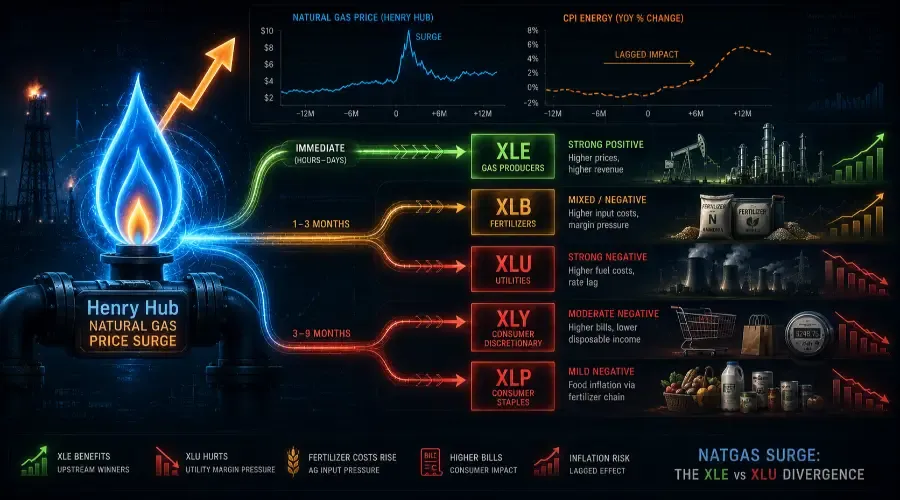
Natural gas prices surged 70% during a major winter storm forecast in early 2025, and a separate arctic freeze sent prices up 20% in days – described by one trading desk as a "violent price spike." Both moves triggered the same sector divergence, and both times most retail traders made the same mistake: they bought energy ETFs expecting a broad energy rally. What they missed is the defining paradox of a natural gas surge – the sector that gets hurt hardest is not consumer discretionary or industrials. It is utilities, the sector most investors consider a safe haven. And the winner is a specific slice of energy that most XLE holders don't realise they own. Understanding the natural gas trading strategy that exploits this XLE vs XLU split is what separates reactive chasing from intentional positioning.
Why This Matters More Than Most Traders Realize
A natural gas price surge is not a generic energy event. It is a commodity-specific shock with a transmission chain that runs differently from crude oil – different victims, different timing, different ETF expression. The traders who lump natural gas and crude oil together into a single "energy is up" narrative miss the most important divergence the commodity markets produce.
The numbers make the stakes concrete. Natural gas accounts for roughly 32% of total US electricity generation and nearly 46% of residential and commercial heating fuel. When Henry Hub prices surge – whether from a winter storm, a production disruption, or an LNG export demand spike – the cost structure of every gas-burning utility in the country changes immediately. Regulated utilities cannot pass those costs to ratepayers for months or years. The margin compression is arithmetic, predictable, and almost never fully priced into XLU in the first weeks of a gas spike. In practice, this natural gas impact on utilities is the single most counterintuitive sector signal in the commodity space.
What the analysis you find elsewhere misses entirely is the XLE versus XLU divergence: upstream natural gas producers within XLE are the beneficiaries of higher prices, while downstream gas consumers within XLU are the primary victims. These two sectors move in opposite directions from the same event. Knowing which side of that trade you are on – and owning the right ETF – is the entire game during a gas surge. [LINK: Energy Hub]
The Chain Reaction: How a Natural Gas Surge Moves Through the Economy
The first sector to move is always Energy (XLE), and specifically the upstream natural gas producers within it – but this is where the first confusion begins. XLE is a blended ETF that contains both crude oil-focused names and natural gas-focused names. A pure natural gas surge lifts the gas-weighted names (EQT, Coterra Energy, Range Resources) while leaving crude-focused names largely unmoved. The ETF-level move is positive but muted compared to the move in individual gas producers. If you are trading XLE as your natural gas expression, you are getting a diluted signal. The more precise vehicle is the United States Natural Gas Fund (UNG) or individual gas producer stocks within XLE.
The second movement begins within hours and produces the most counter-intuitive signal in commodity markets: Utilities (XLU) start falling while Energy (XLE) rises. This is the defining paradox of natural gas surges. Utilities are the largest industrial consumers of natural gas in the United States, burning it to generate electricity. When the input price surges 30, 50, or 70%, their cost of generation rises immediately. The critical structural problem is regulation: state public utility commissions control retail electricity rates, and the process for requesting a rate increase – filing, review, public comment, regulatory approval – takes six to eighteen months in most jurisdictions. In the interim, the utility burns more expensive gas, sells electricity at the old regulated rate, and absorbs the margin compression entirely. XLU can fall 3–6% in the weeks following a severe gas spike while XLE rises – one of the sharpest intra-sector divergences in the market. That’s the utility stocks during gas surge playbook in a nutshell.
The third movement reaches the Materials sector (XLB) within the first month, and here the picture is more nuanced than either the XLE or XLU signal. Within XLB, fertiliser producers – specifically nitrogen fertiliser companies like Mosaic and CF Industries – see their cost structure worsen immediately. Natural gas is the primary feedstock for nitrogen fertiliser production, representing 70–90% of the variable cost of making ammonia-based fertilisers. When gas surges, fertiliser production becomes more expensive, fertiliser prices follow upward, and the eventual downstream effect is higher agricultural input costs for farmers. This is a secondary transmission – gas to fertiliser to food production costs – that arrives in agricultural commodity markets one to two quarters later.
The fourth movement reaches Industrial companies (XLI) within one to two months. Energy-intensive manufacturers – steel producers, chemical plants, glass manufacturers, paper mills – face immediate margin pressure as natural gas is a primary process fuel. The impact is most severe for manufacturers that cannot easily switch fuels or that operate on thin margins where a 50% spike in gas costs is existential, not merely uncomfortable. Logistics companies within XLI are less affected than in a crude oil spike – diesel is the relevant fuel for trucking, not natural gas – which is another key difference between gas and crude transmission chains.
The consumer layer – Layer 3 – receives the shock in two ways over the three-to-nine-month window. Higher electricity bills (as utilities eventually receive regulatory approval to pass through costs) reduce disposable income for Consumer Discretionary spending. Higher food prices (via the fertiliser chain) put pressure on Consumer Staples margins and household food budgets. This double transmission – electricity costs plus food costs – makes a sustained natural gas surge one of the more persistent consumer headwinds in the commodity complex.
Sector-by-Sector Impact: Who Wins, Who Loses, and When
Energy (XLE) – Moderate Positive – Immediate.
The upstream natural gas producers within XLE benefit directly from higher Henry Hub prices – their revenue reprices immediately as spot and near-term futures contracts update. The nuance is dilution: XLE contains crude oil majors whose economics are largely unaffected by a gas-specific surge. Expect the gas-weighted names within XLE to outperform by 10–20% while the ETF-level move is a more modest 3–6% positive. If you want full exposure to the gas surge trade within the energy complex, individual gas producer stocks or UNG give you the undiluted signal.
Materials (XLB) – Mixed – Immediate to 1–3 Months.
XLB contains two opposing forces in a gas surge. Fertiliser producers (CF Industries, Mosaic) face rising input costs that compress margins but also typically raise fertiliser prices – passing cost through to farmers with a lag. Mining companies see modestly higher energy costs for extraction operations. Chemical producers face higher feedstock costs. The net XLB signal is mildly negative in the immediate term and approximately neutral once price pass-through takes effect. Watch the fertiliser sub-sector specifically – it is the most directly gas-linked component of XLB.
Industrials (XLI) – Moderate Negative – 1–3 Months.
Energy-intensive manufacturers within XLI face margin compression that shows up in the next quarterly earnings cycle. Steel mills, chemical plants, and glass manufacturers are the most exposed sub-sectors. The contrast with a crude oil spike is important: a gas surge hurts manufacturing more than transportation, whereas a crude spike hits transportation (airlines, trucking) hardest. XLI underperforms by 2–4% over two quarters following a sustained gas spike, with the heaviest damage concentrated in energy-intensive industrial manufacturing rather than the logistics names.
Utilities (XLU) – Strong Negative – Immediate.
This is the most important call in the entire post and the one most traders miss. XLU is the largest industrial gas consumer in the US economy, and regulated utilities have no short-term mechanism to pass higher fuel costs to ratepayers. The margin compression is immediate, arithmetic, and visible in the next quarterly earnings report. In the 2021–2022 European gas crisis, utility companies that were heavily gas-dependent saw earnings collapse within two quarters. In the US context, XLU historically falls 3–6% in the four to eight weeks following a severe gas spike. Selling XLU – or buying put options on XLU – while simultaneously being long gas producers is the core pair trade of a natural gas surge.
Real Estate (XLRE) – Mild Negative – 1–3 Months.
The mechanism runs through the inflation expectations channel. Natural gas surges feed into CPI energy components, which raise inflation expectations, which push bond yields higher, which compress real estate valuations through the discount rate. This is the same second-order channel as in a crude spike, operating with similar timing. Expect XLRE to underperform SPY by 1–2% over one to two quarters following a sustained gas spike – less severe than the XLU impact but directionally consistent.
Technology (XLK) – Mild Negative – 1–3 Months.
Data centres are significant electricity consumers, and higher gas prices feed into higher electricity costs for cloud infrastructure operators. The more important channel is again the Fed policy response: gas-driven CPI increases that persist for multiple months increase the probability of a hawkish Fed response, which compresses long-duration growth stock multiples. The XLK headwind from a gas spike is real but secondary – expect 1–2% relative underperformance over two quarters in a sustained spike scenario.
Consumer Discretionary (XLY) – Moderate Negative – 3–9 Months.
The consumer feels a gas surge through two channels that arrive at different times. The first is higher electricity bills – as utilities eventually pass through costs – which typically begins arriving in household bills six to twelve months after a sustained gas spike. The second is higher food prices via the fertiliser chain, which arrives in three to six months. The combined effect compresses disposable income available for discretionary spending. XLY underperforms by 2–4% over the two to three quarters following a major sustained gas spike, with the damage skewed toward the back half of the transmission window.
Consumer Staples (XLP) – Mild Negative – 3–9 Months.
The fertiliser-to-food-price chain is the primary mechanism. Food producers face higher agricultural commodity costs, which compress margins before retail prices can be raised. The timing lag is long – two to three quarters – because farmers lock in fertiliser purchases seasonally and food companies hold inventory buffers. XLP underperforms by 1–2% in the two to three quarters following a major gas spike, concentrated in food manufacturers and processors rather than household goods companies.
Communication Services (XLC) – Mild Negative – 3–9 Months.
The connection is indirect and works through the consumer stress and corporate advertising budget channels. As household energy bills rise and disposable income falls, consumer confidence softens, and corporate advertising budgets – which expand and contract with economic confidence – face pressure. The magnitude is modest and the lag is long. Expect 1% relative underperformance over two to three quarters – the smallest impact of any sector in this transmission chain.
Healthcare (XLV) – Mild Negative – 3–9 Months.
Hospital and healthcare facility operating costs include significant energy components – heating, cooling, sterilisation, and medical equipment power. A sustained gas surge raises operating costs for healthcare providers, compressing margins before they can renegotiate insurance reimbursement rates. Pharmaceutical supply chains with gas-intensive chemical synthesis steps also face input cost pressure. The XLV impact is mild – 1–2% underperformance – and arrives late in the transmission window.
Financials (XLF) – Mild Negative – 1–3 Months.
Financials connect all three layers through credit exposure to utilities, energy-intensive industrials, and agricultural producers. Regional banks with utility loan portfolios face increased credit risk as utility cash flows compress. Banks with agricultural loan exposure face rising fertiliser cost risk for farmer borrowers. The interest rate channel also applies – if gas-driven CPI prompts a Fed response, rate-sensitive parts of XLF face pressure. The net signal is mildly negative, concentrated in regional banks with heavy utility and agricultural lending books rather than large-cap diversified financials.
Historical Cases That Confirm the Pattern
2005 | Post-Hurricane Katrina Gas Spike – The Utility Paradox Confirmed
Hurricanes Katrina and Rita knocked out 24% of US natural gas production in the Gulf of Mexico, sending Henry Hub from approximately 8 permillion British thermal units in August 2005 to a peak of nearly 15 by December – an 87% surge in four months. The sector divergence was textbook: gas producers within XLE outperformed as their revenue repriced immediately. But regulated utilities across the US South and Midwest reported significant earnings misses in Q4 2005 and Q1 2006 as generation costs surged while retail rates remained frozen at pre-hurricane levels. XLU fell 4% relative to the S&P 500 over the four months following the spike peak. Chemical and fertiliser manufacturers within XLB reported margin compression in Q4 2005 earnings calls. Consumer electricity bills began rising six to nine months later as state regulators approved emergency rate adjustments. Lag window: XLE gas producers immediate; XLU margin compression within two quarters; consumer electricity bill impact six to twelve months.
2021–2022 | European Gas Crisis – The Extreme Case
Europe's natural gas crisis – where TTF gas prices rose over 900% from January 2021 to their August 2022 peak – represents the extreme end of the gas surge spectrum and validates the transmission chain at scale. European utilities with heavy gas exposure faced existential margin compression: several major continental utilities required government bailouts or emergency credit facilities. European industrial manufacturers – steel, chemicals, glass, paper – began announcing production curtailments within two quarters as energy costs made output uneconomical. Food prices across Europe rose as fertiliser costs – natural gas is the primary feedstock for European ammonia production – surged 150–200% and passed through to agricultural input costs within two to three seasons. US markets watched this transmission chain play out in real time across the Atlantic, and US domestic gas producers within XLE benefited as LNG export demand from Europe spiked. Lag window: XLU industrial equivalents immediate; manufacturing curtailments within two quarters; food price transmission within two to three seasons.
2025 | Arctic Freeze and Winter Storm Surge – The Seasonal Pattern
A 70% natural gas price surge during a major winter storm forecast in early 2025, followed by a separate 20% spike during an arctic freeze, demonstrated the seasonal pattern that repeats across nearly every significant winter storm. The "violent price spike" documented in trading desk commentary reflected the speed of the Henry Hub move – from stable levels to elevated peaks within days as weather forecasts updated. US utility stocks within XLU fell 2–3% relative to the broader market in the weeks following each spike, while gas-weighted producer names within XLE outperformed. The key difference from the 2005 and 2021 cases was duration: weather-driven spikes tend to be shorter in duration than supply disruption or structural demand spikes, which limits the downstream transmission to utilities and industrials without fully activating the consumer layer. Lag window: XLU relative underperformance within four weeks; XLE gas producers immediate; consumer bill impact limited due to spike duration.
The Before/During/After Playbook
Before: What to Watch for Early Warning
Monitor the National Weather Service 6–10 day and 8–14 day temperature outlook, published daily at weather.gov/cpc. Below-normal temperature forecasts covering large population centres – particularly the US Northeast and Midwest, which have the highest per-capita gas consumption – are the primary trigger for weather-driven gas spikes. When the 6–10 day outlook shows below-normal temperatures covering more than 40% of the continental US population footprint, the setup for a heating demand surge is in place. This forecast leads the actual Henry Hub move by four to seven days.
Track US natural gas storage data, published every Thursday at 10:30am EST by the EIA (eia.gov/naturalgas/storage). Storage levels relative to the five-year average are the structural backdrop for any weather event. When storage is already running 10–15% below the five-year average – meaning the system has less buffer – a cold snap produces a disproportionately large price response compared to the same temperature event hitting an oversupplied storage situation. Low storage plus cold weather forecast is the two-factor pre-spike setup that historically produces the largest Henry Hub moves.
Watch XLU relative performance versus SPY in the two weeks before a major weather event. Institutional energy traders and utility hedgers position ahead of weather forecasts, and XLU relative weakness before the spike is sometimes visible in the data. If XLU begins underperforming SPY by 1–2% during a period when weather forecasts are shifting colder, the institutional repositioning is already underway – confirming the setup is live and the spike is being priced in.
During: Positioning When the Spike Is Live
Buy UNG (United States Natural Gas Fund) or individual gas producer names within XLE for direct exposure to the Henry Hub price move. UNG gives you pure commodity exposure without the crude oil dilution of XLE. Size this position for the duration of the cold snap plus two weeks – weather-driven spikes typically resolve within four to eight weeks as temperatures normalise and storage draws stabilise. Set a profit target at the prior twelve-month high in Henry Hub as an initial take-profit level.
Initiate a relative value short on XLU versus a broad market long – either via puts on XLU or by reducing XLU allocation below benchmark while maintaining overall equity exposure. The XLU vs gas producer pair trade is the most documented and most reliable expression of the natural gas surge. You are not shorting the market; you are expressing the regulatory margin compression that XLU faces by being long the commodity producer and short the commodity consumer within the same broad energy complex.
Add CF Industries or Mosaic within XLB as the fertiliser expression of the gas surge for a one to two quarter time horizon. Gas-driven fertiliser cost increases pass through to fertiliser prices with a one to two quarter lag, and the stocks of fertiliser producers historically lead the price move rather than lag it. This is the less obvious trade – most investors think of XLB as a steel and mining story, not a natural gas story – and the institutional awareness of it creates a wider entry window than the more obvious gas producer trade.
After: The Lagged Rotation Trade
Monitor state public utility commission rate case filings (available on each state's PUC website) approximately six to twelve months after a sustained gas spike. When utilities begin filing for emergency rate adjustments or accelerated rate case schedules, it signals the regulatory pass-through process is beginning. That approval – typically arriving six to eighteen months after the spike – marks the end of the utility margin compression trade. Begin rebuilding XLU exposure when rate case approvals are announced, as the earnings headwind is removing itself from the forward model.
Watch CPI energy services component (BLS monthly release, second week of each month) for the appearance of electricity price inflation. When CPI electricity costs begin rising – reflecting the utility rate pass-through – the consumer disposable income headwind is activating. This is the signal to rotate cautiously from XLY into XLP within your consumer allocation, as the income squeeze on discretionary spending begins the two to three quarter window of relative underperformance.
Add XLI quality industrial manufacturing names on weakness two to three quarters after the gas spike peak, when management earnings calls confirm that energy cost hedges have reset to lower prices and forward energy cost assumptions in guidance reflect the post-spike level. The language to listen for in earnings calls: "We have reset our energy cost assumptions for the next fiscal year" – that phrase signals the margin compression phase has ended and the recovery phase is beginning.
The 3 Mistakes Most Retail Traders Make
Mistake 1: Buying XLU as a Safe Haven During an Energy Spike
The most dangerous mistake in a natural gas surge is reaching for XLU as a defensive position because energy prices are rising and you expect market volatility. The logic seems sound – utilities are defensives – but the economics work in the opposite direction. When gas surges, XLU is not a safe haven. It is the victim. Regulated utilities face immediate margin compression with no short-term mechanism to pass costs through. Every trader who bought XLU during the 2005 Katrina spike and the 2021 European gas crisis discovered this the hard way. The correct institutional response is to treat XLU as a short during a gas surge and as a buy after the regulatory pass-through has been approved and the earnings headwind is clearing.
Mistake 2: Using XLE as a Natural Gas Proxy
The second mistake is buying XLE as your expression of rising natural gas prices and expecting the same return as a pure gas producer investment. XLE is approximately 45–50% crude oil-focused names and 20–25% integrated majors that are only partially exposed to domestic gas prices. In a gas-specific surge with crude prices flat, XLE may move 3–4% while individual gas producers within it move 15–20%. The dilution is substantial. The institutional approach is to identify the specific gas-weighted producers within XLE – EQT Corporation, Coterra Energy, Range Resources, Antero Resources – and access them directly or through a gas-specific vehicle rather than accepting the blended XLE exposure that mutes the return.
Mistake 3: Not Distinguishing Between Seasonal and Structural Gas Spikes
The third mistake is applying the same position sizing and time horizon to every gas spike regardless of cause. A weather-driven spike – cold snap, winter storm, arctic freeze – typically resolves in four to eight weeks as temperatures normalise. The downstream transmission chain (utility margin compression, fertiliser costs, consumer bills) is limited because the spike duration is short. A structural spike – LNG export demand absorbing domestic supply, prolonged production shortfall, geopolitical disruption – can sustain Henry Hub at elevated levels for six to eighteen months and activates the full downstream chain described in this post. Before sizing any position in a gas surge trade, determine the cause. Weather: size smaller, set shorter time horizons, focus only on XLE producers and XLU short. Structural: size appropriately for a multi-quarter trade and activate the full rotation playbook across fertiliser, industrials, and consumer sectors.
Bottom Line: The One-Sentence Institutional Framework
When natural gas surges, buy upstream gas producers within XLE, sell XLU immediately on regulatory margin compression, add fertiliser names within XLB for the one-quarter lag, and watch state PUC rate case approvals as the signal that the utility headwind is ending.
This framework works across cycles because the regulatory structure of the utility sector – the mechanism that creates the XLU victim trade – does not change between 2005 and 2025. Regulated utilities will always face a lag between their input cost increases and their ability to raise rates. That structural lag is the trading opportunity. It is predictable, it is documented, and it repeats every time a significant gas spike occurs.
The retail edge here is understanding that XLE and XLU are not the same trade just because they both say "energy." They are opposite trades in a natural gas surge – one is the winner and one is the victim, and knowing which is which before the spike arrives is the entire advantage.
Run this scenario through the [Breakout Bulletin Ripple Engine](LINK: Ripple Engine Tool) to see the full sector transmission map, set intensity to match the magnitude and duration of the gas spike you are analysing, and get the complete timing sequence for all twelve sectors – including the XLE versus XLU divergence that defines this event type.
FAQ: Natural Gas Price Surges and Stock Market Impact
What happens when natural gas prices surge?
When natural gas prices surge, upstream gas producers and some energy stocks usually benefit, while utilities, industrial manufacturers, and eventually consumers face rising energy costs and margin pressure.
Why do utilities fall when natural gas prices rise?
Utilities often fall because many regulated utility companies rely heavily on natural gas for electricity generation. Their fuel costs rise immediately, but they cannot quickly pass those higher costs to consumers through regulated pricing structures.
Which sectors benefit most from rising natural gas prices?
Natural gas producers, upstream energy companies, and gas-focused stocks within XLE typically benefit the most because higher Henry Hub prices directly improve revenue and profitability.
How do natural gas prices affect fertilizer companies?
Natural gas is the primary feedstock for nitrogen fertilizer production. Rising gas prices increase fertilizer production costs, which eventually raises agricultural input prices and food inflation.
Why is XLE different from XLU during a gas surge?
XLE contains energy producers that benefit from higher gas prices, while XLU contains utility companies that consume natural gas as an input cost. This creates one of the strongest opposite-sector reactions in commodity markets.
How do natural gas spikes impact inflation?
Natural gas spikes increase electricity generation costs, industrial production costs, and eventually household utility bills and food prices, contributing to broader inflation pressure over time.
What is the difference between a seasonal and structural natural gas spike?
Seasonal spikes are usually caused by winter storms or temporary weather events and often fade within weeks. Structural spikes are driven by supply shortages, LNG demand, or geopolitical disruptions and can last for multiple quarters.
Why do consumers feel the impact of rising natural gas prices later?
Consumers usually feel the impact later because utility rate increases require regulatory approval, and higher fertilizer costs take time to move through the food supply chain.
This post is part of the BreakoutBulletin "What Happens When" series. [LINK: Energy Hub] · [LINK: Series Pillar Page]
Educational content only. Not investment advice. Past sector performance patterns do not guarantee future results.