
Every week, markets react to events that most retail traders see only in hindsight. The Fed raises rates. Oil spikes. A jobs report misses badly. Within hours, billions shift across sectors – some gaining, some bleeding, some barely moving at all.
The traders who consistently position ahead of these moves are not guessing. They are following chains. And those chains are surprisingly predictable.
This is the master guide to those chains. What follows is a complete framework for understanding how market events – from energy price shocks to central bank policy shifts to geopolitical crises – move through the economy, sector by sector, in a repeatable sequence. It’s your complete market catalyst playbook and a proven sector rotation strategy combined into one reference.
Bookmark this page. It is your reference library.
The Core Insight Most Retail Traders Miss
Open any finance news site during a major market event and you’ll find the same pattern: breathless coverage of the what with almost no analysis of the so what. Oil spikes 8%. The Fed cuts rates. CPI comes in hot. Consumer confidence collapses.
These are triggers, not destinations. The real trading opportunity lives in what comes after the trigger – the predictable chain of market reactions that plays out over hours, days, weeks, and sometimes quarters. That’s how markets move. And once you see it, you stop trading headlines and start trading the chain.
Institutional desks understand this. When a Fed decision lands, their analysts are not just watching the headline. They are tracking the second and third-order reactions: which sectors get repriced, in which order, at which lag. They are running the same mental models their predecessors ran in 1994, in 2008, in 2022 – because the chains are consistent even when the magnitudes differ. Understanding market events impact on stocks means looking past the immediate shock.
This series exists to give retail traders the same framework – a robust catalyst-based trading strategy.
The What Happens When series covers over 40 specific market events across seven categories: energy, metals, precious metals, agriculture, macroeconomic data, central bank policy, and geopolitics. Each post answers the same question with rigorous, precedent-backed analysis: when this event hits, what moves, in what direction, in what order, and what do you do about it?
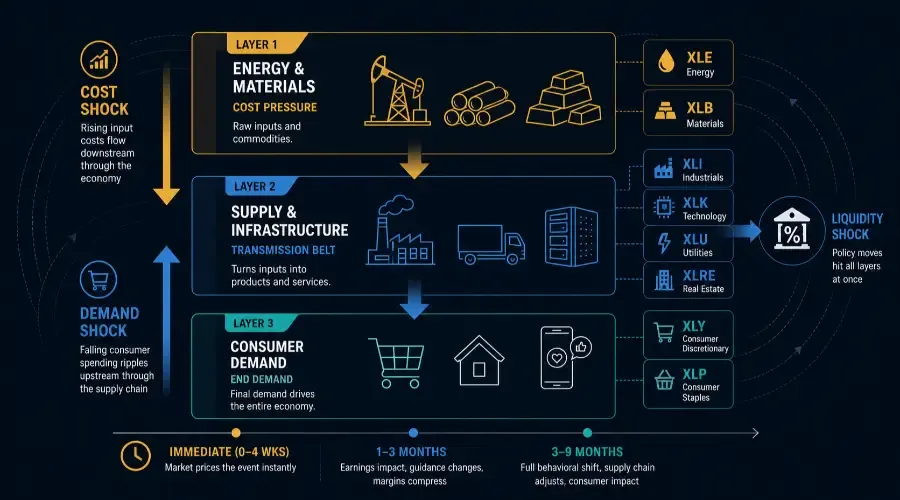
But before you read any individual event post, you need to understand the underlying architecture. There are three types of market shocks. They move markets in completely different ways. And once you understand the difference, the individual events become much easier to interpret.
The Three Types of Market Shocks
Every major market event falls into one of three categories. This is not an arbitrary classification – it reflects the actual transmission mechanism, the physical and financial pathway through which the shock moves through the economy. The three market shock types – cost, demand, and liquidity – are explained in detail below, and knowing them instantly upgrades your ability to predict sector moves.
Type 1: Cost Shocks – The Downstream Cascade
A cost shock originates in the raw input layer of the economy: energy prices, commodity prices, material costs. When these inputs become more expensive or scarce, the burden flows downward through the production chain.
The sequence is mechanically predictable:
Input costs spike → margins compress for manufacturers → prices pass through to consumers → CPI rises → the Fed reacts
This is why an oil price spike in October does not immediately show up in your discretionary spending data. It takes time – typically two to three quarters – for the energy shock to fully transmit from the wellhead to the gas station to the household budget. But it always arrives. The lag is not uncertainty; it is physics.
When you see a Cost Shock event – oil surging, copper exploding, lumber prices doubling – the sector playbook runs like this: Energy and Materials benefit first and most aggressively. Industrials face rising transport costs within weeks. Consumer sectors feel the margin compression last, but when it hits, it shows up hard in earnings.
In 2021–2022, this chain played out with textbook precision. WTI crude ran from 47 to 130. Energy stocks (XLE) gained 65% in 2022 – the best sector by a wide margin. Consumer Discretionary (XLY) fell 37% – the worst sector. The gap between those two outcomes was not luck. It was the cost shock cascade, running exactly as the model predicts, on a two-to-three quarter lag.
(If you’re newer to US sector ETFs, here’s a quick decoder: XLE tracks energy, XLB materials, XLI industrials, XLK technology, XLU utilities, XLRE real estate, XLY consumer discretionary, XLP consumer staples, XLC communication services, XLV healthcare, XLF financials. The same logic applies globally though – use the equivalent local sector funds and you’ll see identical transmission patterns.)
The trader's edge with cost shocks: You can see the input pressure building before it reaches consumer earnings. When XLE and XLB are running hard on a cost-push dynamic, the signal is: build your short list for XLY and XLP one to two earnings cycles forward.
Type 2: Demand Shocks – The Upstream Reversal
A demand shock originates with the consumer. When people stop spending – because they lose jobs, confidence collapses, credit tightens, or recession fear takes hold – the ripple travels backwards through the supply chain.
The sequence runs in reverse of a cost shock:
Consumer spending drops → discretionary revenue collapses → ad budgets get slashed → logistics volumes fall → factory orders decline → raw material demand disappears
This reversal pattern is why a jobs report miss is never just a consumer story. A weak NFP number today is a leading indicator for Industrials weakness in the next quarter and Materials demand collapse in the quarter after that. The consumer is the end of the production chain – when the end stops consuming, every supplier upstream eventually feels it. This is the demand-vs-cost shock distinction that keeps you on the right side of the rotation.
The COVID shock of 2020 compressed this sequence into six weeks instead of the usual six to eight quarters. XLY fell 40% in March 2020. Ad tech collapsed immediately. Industrials followed. But the sequence was identical to 2008 – just accelerated by the severity of the event.
The important counterpoint: demand shocks can also run in the positive direction. The 2020–2021 stimulus boom was a consumer demand surge that pulled spending upstream. XLY gained 70% from April 2020 to December 2021. Industrials followed as logistics volumes hit records. Materials and Energy joined last – commodities were the final beneficiaries of the consumer spending wave, arriving on a three-to-four quarter lag.
The trader's edge with demand shocks: Watch XLY and XLC as the leading indicators in both directions. Consumer Discretionary and Communication Services (ad revenue) move before the upstream sectors feel it. If XLY is rolling over and XLC ad revenue is flagging, you have a two-quarter warning for XLI and XLB weakness.
Type 3: Liquidity Shocks – The Simultaneous Reprice
Liquidity shocks are fundamentally different from the first two types. They do not travel through a supply chain. They reprice assets through financial channels simultaneously – but through different mechanisms for different sectors.
When the Fed raises rates, three distinct things happen at once:
The rate channel reprices rate-sensitive assets. Real estate (XLRE), Utilities (XLU), and long-duration growth stocks (within XLK) all face an immediate mathematical hit – their future cash flows are discounted at a higher rate.
The dollar channel moves if rate differentials change. A stronger dollar suppresses commodity prices in dollar terms and compresses the overseas earnings of multinationals across XLK, XLV, and XLP.
The credit channel tightens lending conditions. Banks face changed net interest margins. Small businesses and real estate developers find capital more expensive or unavailable. XLF, XLRE, and parts of XLI feel this through lending constraints, not just market repricing.
The critical skill with liquidity shocks – and the heart of understanding what happens when interest rates rise – is identifying which channel is dominant. In 2022, the rate hike cycle triggered all three channels simultaneously – which is why the destruction was so broad and so fast. In 2019, the insurance rate cuts primarily operated through the rate and dollar channels with limited credit stress – which is why the response was more orderly and selective.
The trader's edge with liquidity shocks: Identify the active channel before you build your sector trade. Rate channel? XLRE and XLU move first. Dollar channel? Commodities and multinationals. Credit stress? XLF and XLRE co-move, often preceding broader market weakness by weeks.
The Sector Reaction Hierarchy
Across all three shock types, market reactions follow a consistent layered structure. Understanding these layers is what allows you to anticipate sequencing rather than just react to it. This is the essence of sector analysis for traders – and the foundation of any catalyst-based trading strategy.
Layer 1: Cost Pressure (Energy and Materials)
These sectors sit at the top of the production chain. They are the economy's raw ingredients. Every business downstream eventually absorbs changes in energy and material costs – they cannot be avoided or substituted away quickly.
Key ETFs: XLE (Energy), XLB (Materials)
Role: Leading indicators in cost shocks. Lagging indicators in demand shocks. Direct targets in supply disruptions.
Layer 2: Supply and Infrastructure
This middle layer translates inputs into outputs. It includes the factories, logistics networks, utilities, technology platforms, and real estate that make the productive economy function.
Key ETFs: XLI (Industrials), XLK (Technology), XLU (Utilities), XLRE (Real Estate)
Role: The transmission belt. Absorbs cost shocks with a one-to-three month lag. Leads the reversal in demand recoveries. Highly sensitive to interest rate changes through duration and capital intensity.
Layer 3: Consumer Demand
The consumer layer is where production meets spending. This is the final destination of cost shocks and the origin point of demand shocks.
Key ETFs: XLY (Consumer Discretionary), XLP (Consumer Staples), XLC (Communication Services), XLV (Healthcare)
Role: Lagging indicator in cost shocks – feels the compression last. Leading indicator in demand shocks – moves first in both positive and negative directions.
The Financial Sector: The Liquidity Switch
Financials (XLF) occupy a unique position – they are not strictly in any layer. They are the system's liquidity conduit. In normal conditions, they amplify both upswings and downswings through credit expansion and contraction. In crisis conditions, they are the fault line.
The XLF tell: When XLF and XLRE fall simultaneously and sharply, you are almost certainly looking at a credit stress event, not a simple rate sensitivity response. This co-movement pattern preceded both the 2008 and 2023 banking stress events.
The Before / During / After Trading Framework
Reading a sector reaction map tells you what moves. The Before / During / After framework tells you when to act and what to do at each stage. And while timing is everything, remember that risk management is non-negotiable – proper position sizing, hard stops, and volatility awareness around these events protect your capital when even the best forecasts get surprised.
Every major market event has three tradeable phases.
Before the Event: Positioning
The pre-event phase is where the highest-probability trades are built. The goal is not to predict the event – it is to understand what the market is already pricing and where the consensus is offsides.
Before a major catalyst, ask three questions:
- What is the market pricing already?
If crude oil is already up 30% in the prior month, the "oil spike playbook" may already be partially priced into energy stocks. The incremental move on the news will be smaller than the model suggests. - Which sectors are showing pre-event divergence?
Sometimes sector behavior tips you off before the official data. Copper falling while equity markets are flat is a demand signal. Financial stocks underperforming before a Fed meeting is a credit signal. These divergences are early transmission data. - What does the consensus expect?
The highest-conviction post-event trades are almost always in the scenarios the consensus got wrong. A jobs report that misses badly when everyone expected strength produces a far larger market reaction than a miss that was already anticipated.
And while the strategic edge matters, always ground your positioning in solid risk controls – position sizes, hard stops, event volatility awareness – because even the highest-conviction thesis can get steamrolled by a surprise print.
During the Event: What to Watch
The event itself – the Fed press conference, the CPI print, the geopolitical headline – is rarely where the money is made. It is a signal to update your thesis, not to trade reactively.
During a major catalyst event, the priority is:
Watch the sectors that should NOT be moving. If oil spikes but XLI is not selling off, that is telling you something – either the market expects the spike to be short-lived, or XLI has already priced in the cost pressure from an earlier catalyst. Unexpected non-reactions are often more informative than the headline moves.
Track the sequence, not just the magnitude. The order in which sectors move tells you which shock type is dominant. If XLE leads and XLY lags, it is a cost shock playing out normally. If XLY leads down with XLC following, it is a demand shock in early transmission. If XLRE and XLU move simultaneously on a rate decision, the rate channel is dominant.
After the Event: Sector Rotation
The post-event phase is where most retail traders disengage – right when institutional money is making its most important positioning decisions. This is classic sector rotation after economic events, and missing it leaves the biggest opportunities on the table.
After a major catalyst, the question is: what has this event changed about the forward earnings picture, and which sectors have not yet priced that change?
In 2022, the Fed's aggressive hiking cycle was clear by March. But the full rotation from growth to value and energy took until June to complete – three months of positioning opportunities after the initial catalyst. Traders who stepped away after the first rate hike missed the most sustained and profitable rotation of that cycle.
Post-event checklist:
Which Layer 1 sectors moved on the event?
What does that imply for Layer 2 earnings in the next one to two quarters?
What does that imply for Layer 3 consumer behavior in two to three quarters?
Which sectors are still priced as if the event did not happen?
The last question is your trade list.
How to Read Timing: The Three Lag Windows
One of the most consistent findings across decades of market history is that sector reactions to catalysts do not all arrive simultaneously. They arrive in predictable lag windows:
Immediate (0–4 weeks)
The mathematical and mechanical impacts. Rate changes reprice duration assets instantly. Commodity price moves hit energy sector revenues directly. Currency moves translate foreign earnings at the next closing rate. These reactions are not speculative – they are arithmetic. Market participants price them within days.
1–3 Months
The earnings cycle reflection. Input cost changes appear in the next quarterly earnings report. Management commentary begins signalling margin pressure. Institutional money repositions as the forward guidance changes. This is the window where the divergence between the headline reaction and the real economic impact is largest – and where the most durable trades are built.
3–9 Months
Full behavioral and supply chain absorption. Consumer spending patterns shift. Supply chain contracts reprice. Labor costs adjust. Capital investment decisions change. This is the lag that most short-term traders miss entirely, and where the second-order trades – built on the first-order reactions – play out.
Understanding which window a given sector falls into for a specific catalyst is the core analytical skill this series develops. Mastering these lag windows is how you turn trading market catalysts from guesswork into a systematic process.
The What Happens When Series: Navigate by Category
The series is organized into seven hub categories. Each hub contains a full explanation of that category's transmission mechanism, plus all the individual event posts within it. Below is a summary of what each hub covers and why it matters for traders.
Hub 1: Energy Commodities
What Happens When Oil, Natural Gas, and Uranium Move
Energy is the economy's cost floor. Every business that uses power, transport, or heat – which is every business – is exposed to energy price moves. This hub covers crude oil spikes and crashes, natural gas surges, and uranium price moves. Energy events are among the most powerful cost shock catalysts in the market because their transmission is broad and the timing of their consumer-level impact is consistent across decades of data. If you want to understand how oil prices affect stock market sectors, this is where you start.
Posts in this hub:
What happens when crude oil prices spike · What happens when crude oil prices crash · What happens when natural gas prices surge · What happens when gasoline prices rise sharply · What happens when uranium prices spike
Hub 2: Industrial and Base Metals
What Happens When Copper, Steel, Aluminium, and Lumber Move
Copper is the market's favorite leading economic indicator for a reason – it is embedded in every piece of infrastructure, every motor, every building. When copper falls, it is pricing in slower global growth before the economic data confirms it. This hub covers the metal market events that signal turning points in the industrial cycle, from copper's recession signal to the lumber price swings that forecast housing sector health.
Posts in this hub:
What happens when copper prices fall · What happens when steel and iron ore prices drop · What happens when lumber prices surge
Hub 3: Precious Metals
What Happens When Gold, Silver, and Platinum Move
Precious metals serve a dual function in portfolio analysis – they are simultaneously inflation hedges, safe haven assets, and dollar-inverse instruments. Understanding which function is dominant in a given move is the key skill. A gold spike driven by inflation fear has different sector implications than a gold spike driven by geopolitical risk or dollar weakness. This hub decodes each scenario.
Posts in this hub:
What happens when gold prices spike · What happens when gold prices fall · What happens when silver prices spike
Hub 4: Agricultural Commodities
What Happens When Wheat, Corn, Soybeans, Coffee, Sugar, and Cotton Move
Agricultural price moves tend to be underestimated by equity traders – until they show up in Consumer Staples margins or CPI food components. This hub covers the agricultural events that feed directly into inflation data, consumer spending power, and emerging market economic stability.
Posts in this hub:
What happens when wheat and corn prices spike · What happens when soybean prices move sharply
Hub 5: Macroeconomic Events
What Happens When the Fed Acts, CPI Prints, GDP Slows, and Jobs Data Misses
This is the highest-traffic hub in the series – and for good reason. Macro data releases are the single most consistent source of market volatility. The posts in this hub cover every major US economic indicator: from the Fed rate decision (the highest-stakes single event in global markets) to the NFP jobs report, CPI inflation prints, GDP revisions, retail sales, consumer confidence, housing starts, and ISM manufacturing data. Each post explains the full chain reaction from the data release through to sector-level impact. If you’ve ever wanted to know how to trade macroeconomic news with precision, these are the blueprints.
Posts in this hub:
What happens when the Fed raises interest rates · What happens when the Fed cuts interest rates · What happens when the 10-year Treasury yield spikes · What happens when the US dollar rallies · What happens when the US dollar weakens · What happens when CPI comes in hot · What happens when the jobs report (NFP) misses badly · What happens when GDP growth slows sharply · What happens when consumer confidence collapses · What happens when retail sales disappoint · What happens when ISM Manufacturing PMI falls below 50 · What happens when housing starts collapse
Hub 6: Central Bank and Policy Events
What Happens When QE Expands, Tapering Begins, Tariffs Escalate, and Tax Policy Changes
Policy events are slower-moving than macro data releases but longer-lasting in their market impact. This hub covers the events that change the structural backdrop for investing: quantitative easing and tapering cycles, foreign central bank policy shifts (ECB, BOJ, PBOC), and domestic fiscal events like tax rate changes, capital gains adjustments, and trade tariffs. These posts require a longer time horizon than typical event analysis – their impacts often play out over multiple quarters.
Posts in this hub:
What happens when the Fed expands its balance sheet (QE) · What happens when the Fed starts tapering QE · What happens when the ECB or BOJ shifts policy · What happens when China's PBOC stimulates the economy · What happens when corporate tax rates are hiked · What happens when capital gains taxes rise · What happens when tariffs and trade wars escalate · What happens when a US government shutdown occurs
Hub 7: Geopolitical Events
What Happens When Wars Break Out, Elections Occur, OPEC Cuts, and Emerging Markets Crack
Geopolitical events are the hardest to forecast and the easiest to misread. Their market impact depends heavily on duration (short shock vs. structural change), geography (local vs. global supply chain disruption), and the asset markets directly in the line of fire. This hub covers the five major geopolitical catalyst types: military conflict, US presidential elections, China-Taiwan escalation, OPEC production decisions, and emerging market debt crises.
Posts in this hub:
What happens when war or military conflict breaks out · What happens when a US presidential election occurs · What happens when China-Taiwan tensions escalate · What happens when OPEC+ cuts oil supply sharply · What happens when Russia cuts energy supply to Europe · What happens when an emerging market debt crisis hits
How to Use This Series as a Working Framework
Reading individual event posts gives you event-specific knowledge. Using the series as an integrated framework gives you a systematic trading process. Here is the difference in practice.
Build your catalyst calendar. Every month has scheduled events – Fed meetings, CPI releases, NFP Fridays, earnings seasons. Mark the events that fall within the next four to six weeks. For each, identify which hub it belongs to and read the corresponding post before the event. Pre-event analysis is always more valuable than post-event reaction.
Maintain a sector divergence watchlist. Every week, scan the relative performance of the eleven sector ETFs (XLE, XLB, XLI, XLK, XLU, XLRE, XLY, XLP, XLC, XLV, XLF) against the S&P 500. Unusual divergences – one layer moving while another is not – are early-warning signals of a catalyst chain in progress.
Follow the lag windows, not just the headlines. When a major catalyst lands, your analysis is not done when the news cycle moves on. Set reminders at the one-to-three month mark and the three-to-nine month mark to review whether the lagged sector reactions have materialized. The most consistent money in catalyst trading is made in the lagged phases, not the immediate reaction.
Use historical precedents as probability anchors, not certainties. Every post in this series includes real historical cases – specific years, specific events, specific ETF returns. These are not predictions. They are probability anchors. Markets do not repeat identically, but the transmission mechanisms are consistent enough that historical precedents sharply improve your odds of identifying the correct directional trade.
A Note on the Framework's Limits
No framework eliminates uncertainty. Market catalysts can interact with each other in ways that compress, amplify, or reverse the standard chains. A commodity spike that would normally be a clean cost shock becomes more complex when it coincides with a recession (demand shock) – as happened in 2008. A rate hike cycle that normally pressures real estate can be partially offset by a commodity boom that supports energy sector earnings – as happened in 2022.
This series accounts for these complexities in each individual post. But the underlying framework – three shock types, three layers, three time windows – is the lens through which every event analysis starts.
The goal is not certainty. The goal is a systematic process for converting market events into sector-level analysis, faster and with more depth than the generic financial commentary you will find everywhere else.
That is what this series delivers.
Start With the Category That Moves Your Market
Every trader has a primary focus – a set of markets and sectors they track most closely. Start with the hub that corresponds to your existing watchlist, read the posts most relevant to your current holdings and positions, and build outward from there.
The complete catalyst library is below. Each hub page contains all the individual event posts in that category, organized by impact priority.
→ Hub: Energy Commodities – Oil, Gas, Uranium
→ Hub: Industrial & Base Metals – Copper, Steel, Lumber
→ Hub: Precious Metals – Gold, Silver, Platinum
→ Hub: Agricultural Commodities – Wheat, Corn, Soybeans
→ Hub: Macroeconomic Events – Fed, CPI, NFP, GDP
→ Hub: Central Bank & Policy – QE, Tapering, Tariffs, Tax
→ Hub: Geopolitical Events – Wars, Elections, OPEC, EM Crisis
Frequently Asked Questions
1. What happens when markets move after major economic events?
When markets move due to major events like interest rate changes, inflation data, or oil price shocks, the impact follows a chain reaction across sectors. Typically, energy and materials move first, followed by industrials and infrastructure, and finally consumer sectors. Understanding this sequence helps traders anticipate sector rotation rather than react late.
2. How do economic events affect the stock market?
Economic events such as Federal Reserve rate decisions, CPI inflation data, or jobs reports influence the stock market by changing expectations around growth, inflation, and liquidity. These changes affect company earnings, investor sentiment, and capital flows, leading to sector-specific movements.
3. What are market catalysts in trading?
Market catalysts are events or triggers that cause significant price movement in financial markets. Examples include:
Interest rate hikes or cuts
Inflation reports (CPI)
Oil and commodity price changes
Geopolitical events
Earnings announcements
Traders use catalysts to predict which sectors will move and in what direction.
4. What is sector rotation in the stock market?
Sector rotation is the movement of money between different sectors based on economic conditions. For example:
During economic growth, consumer and technology stocks outperform
During inflation or cost shocks, energy and materials lead
During rate hikes, real estate and utilities often underperform
Understanding sector rotation helps traders align with institutional money flow.
5. How do interest rate hikes affect stocks?
When the Federal Reserve raises interest rates:
Borrowing becomes expensive
Growth stocks decline due to higher discount rates
Real estate and utilities weaken
Financial stocks may benefit (depending on credit conditions)
This is known as a liquidity shock, where multiple sectors reprice simultaneously.
6. How do oil price changes impact the stock market?
When oil prices rise:
Energy companies benefit immediately
Transportation and industrial costs increase
Consumer spending declines over time
Inflation rises, potentially triggering rate hikes
This creates a cost shock, where effects move gradually through the economy.
7. What is the difference between cost shock and demand shock?
Cost Shock: Starts from rising input costs (like oil or raw materials) and moves downstream to consumers.
Demand Shock: Starts from falling consumer spending and moves upstream to producers and suppliers.
Understanding this difference helps traders identify which sectors will lead and which will lag.
8. How long does it take for market events to impact different sectors?
Market reactions typically occur in three timeframes:
Immediate (0–4 weeks): Instant pricing (rates, commodities)
Short-term (1–3 months): Earnings adjustments and guidance changes
Long-term (3–9 months): Full economic impact and consumer behavior shifts
Most profitable trades often occur in the lagged phases, not the initial reaction.
9. Which sectors move first during market changes?
The order of movement usually follows:
Energy & Materials (XLE, XLB) – first movers
Industrials & Infrastructure (XLI, XLK) – middle layer
Consumer Sectors (XLY, XLP) – lagging impact
Tracking this sequence helps identify early trading opportunities.
10. How can traders use market catalysts to make better decisions?
Traders can use market catalysts by:
Tracking upcoming economic events
Identifying which sectors are likely to be impacted
Watching early sector movements for confirmation
Positioning ahead of delayed reactions
The key is to focus on “what happens next”, not just the headline news.
All content on BreakoutBulletin is for educational purposes only and does not constitute financial advice or a recommendation to buy or sell any security. Past market behavior does not guarantee future results.