
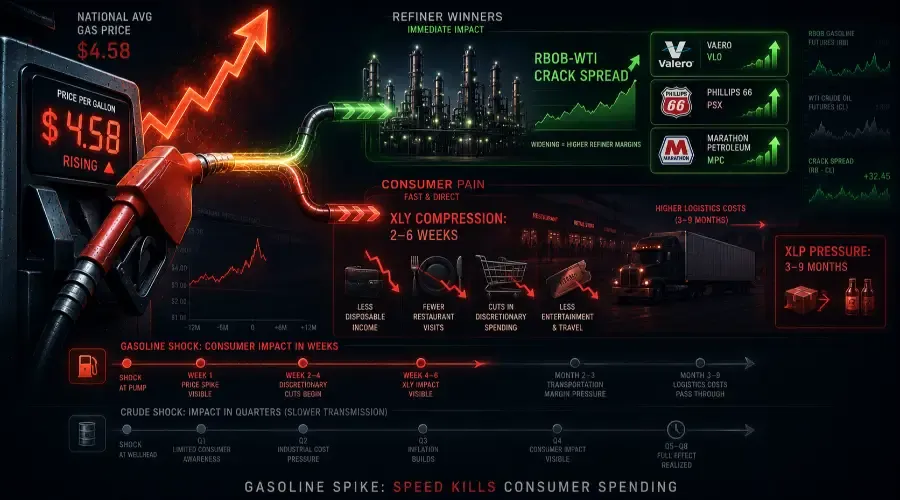
Stanford researchers studying the Iran war scenario called it directly: sharply rising gasoline prices function as a regressive tax on the American consumer, with lower-income households spending two to three times more of their income on fuel than higher earners. When the national average at the pump crosses $4, something measurable happens to consumer spending – not eventually, not after a lag, but in the same week. Gasoline is the one commodity whose price every American sees every day, reads on a sign while driving to work, and recalibrates their spending behaviour around in real time. That behavioral immediacy makes a gasoline spike categorically different from every other energy event – and it creates sector divergences that arrive faster than most traders expect. If you’re trying to understand how rising gasoline prices impact stocks, the speed of the consumer reaction is the whole story.
Why This Matters More Than Most Traders Realize
Gasoline is not crude oil with a different label. It is a refined product with its own supply chain, its own pricing dynamics, and its own sector transmission chain – and the critical difference is that gasoline price changes reach the consumer directly and immediately, without the multi-quarter lag that characterises crude oil transmission.
The average US household spent approximately 3,000 on gasoline in 2023. A 30900 to that annual bill – nearly $75 per month appearing in household budgets within days of the price change, not quarters. That immediacy is the defining feature of a gasoline shock. Consumers do not need to wait for their energy bill to arrive, their employer to adjust wages, or their landlord to revise rent. They see the number on the pump, and they adjust their other spending in the same week.
What most analysis misses is the divergence within XLE itself. A gasoline spike is not uniformly positive for the energy sector. Crude oil producers benefit if crude is driving the gasoline price higher. But independent refiners – companies like Valero, Phillips 66, and Marathon Petroleum that sit inside XLE – can see their margins expand dramatically when gasoline prices outpace crude costs, or compress sharply when they lag. The crack spread – the difference between the price of crude oil input and refined gasoline output – is the metric that determines refiner profitability, and it moves independently of crude. In practice, the crack spread trade is the precision instrument that separates the professionals from the XLE tourists. Understanding which sub-sector of XLE you own is the difference between catching the trade and missing it entirely. [LINK: Energy Hub]
The Chain Reaction: How a Gasoline Spike Moves Through the Economy
The first sector to move is always Energy (XLE), but with a critical internal split that most analysis ignores. When gasoline prices rise sharply, crude oil producers benefit only if the spike is crude-driven. If gasoline is rising because of refinery capacity constraints, seasonal blend transitions, or regional supply disruptions – with crude prices flat or rising more slowly – then independent refiners within XLE see their crack spreads widen and their margins expand dramatically. Valero Energy, for example, has historically seen its stock outperform crude oil producers by 20–30% in periods where the gasoline-crude spread widens. The key point is knowing which half of XLE is winning – producers or refiners – before you even place a trade.
The second movement reaches the consumer faster than any other commodity shock, and this speed is the defining characteristic that separates gasoline from crude oil, natural gas, and virtually every other commodity. Within the first two to four weeks of a sustained pump price increase, you can observe real-time consumer behaviour shifts in credit card spending data. Lower-income households reduce discretionary spending first – restaurant visits, entertainment, clothing – because fuel spending is non-negotiable for commuting. The Consumer Discretionary sector (XLY) begins feeling this income effect within four to six weeks, not two to three quarters as in a crude oil transmission. This compressed timeline is what makes gasoline the fastest-transmitting consumer commodity shock in the market, and rising gas prices impact consumer spending with a velocity that surprises most traders.
The third movement flows into the Transportation sub-sector of Industrials (XLI) within the first month. Unlike a crude oil spike – where diesel is the relevant fuel and the transmission hits trucking and airlines – a gasoline spike most directly affects vehicle-intensive businesses that rely on regular-grade gasoline: delivery services, ride-share platforms, service companies with large vehicle fleets. Airlines are less affected by a gasoline spike than by a crude or jet fuel spike, because commercial aviation does not use gasoline. This is a key distinction from the crude oil post – the XLI impact is real but the sub-sector composition is different.
The fourth movement is the geographic and income concentration effect that produces the most powerful macro feedback. Gasoline spending as a percentage of household income is dramatically higher for lower-income and rural households. When pump prices spike, the spending compression is concentrated in zip codes where the consumer has the least financial buffer and the fewest alternatives to driving. This geographic concentration means that certain Consumer Discretionary sub-sectors – dollar stores, discount retailers, fast-casual restaurants serving lower-income demographics – feel the income compression faster and more severely than premium retail or luxury goods. XLY contains both dollar stores and luxury brands, and the internal divergence during a gasoline spike is substantial.
The fifth movement – the one arriving in the three-to-nine-month window – is the CPI pass-through via transportation costs. When gasoline prices rise, the cost of every product that moves by truck increases as fuel surcharges rise and carriers pass costs through to shippers. Consumer Staples companies (XLP) face higher logistics costs on top of whatever crude-linked packaging costs are doing. Food producers, household goods manufacturers, and personal care companies all see their cost of goods sold increase as transportation line items rise. This logistics pass-through arrives later than the direct consumer income effect and compounds the overall inflationary pressure from the event, feeding the gasoline inflation impact that eventually shows up in macro data.
Sector-by-Sector Impact: Who Wins, Who Loses, and When
Energy (XLE) – Mixed Internally – Immediate. XLE's internal composition determines whether you are in the winning or losing half of the energy trade. Independent refiners (Valero, Phillips 66, Marathon Petroleum) benefit when gasoline outpaces crude input costs – their crack spread widens and margins expand. Crude oil producers benefit when the gasoline spike is crude-driven. Integrated majors benefit from both but less dramatically than pure plays. The key action: identify whether the gasoline-crude spread is widening (refiner trade) or stable (producer trade) before sizing an XLE position. The two sub-sectors can diverge by 15–20% during a significant crack spread event.
Materials (XLB) – Mild Negative – 1–3 Months. Petrochemical producers within XLB face modestly higher feedstock costs when gasoline-range hydrocarbons tighten. Packaging producers see higher transport costs as logistics surcharges rise. The XLB impact is indirect and mild – the sector is not a primary transmission point in a gasoline spike the way it is in a crude or natural gas surge. Expect 1–2% relative underperformance over two quarters, concentrated in the plastics and chemicals sub-sectors rather than mining or specialty materials.
Industrials (XLI) – Moderate Negative – 1–3 Months. Vehicle-fleet-intensive businesses within XLI face higher operating costs when gasoline prices rise. Delivery companies running gasoline-powered vehicles, service businesses with large field technician fleets, and passenger ground transportation operators all face margin compression. The distinction from a crude spike: airlines are less affected here because jet fuel is kerosene, not gasoline. The XLI impact is real but concentrated in specific sub-sectors rather than broad – 2–3% relative underperformance over two quarters, with the heaviest damage in ground transport and fleet-intensive service companies.
Utilities (XLU) – Mild Negative – 1–3 Months. Utilities are less directly exposed to gasoline than to natural gas, but the inflation expectations channel applies. A sustained gasoline spike raises CPI expectations, which raises the probability of a hawkish Fed response, which compresses bond-proxy sectors like XLU through the discount rate mechanism. The direct operating cost exposure is minimal – utilities run on electricity and natural gas, not gasoline. Expect 1–2% relative underperformance driven almost entirely by the interest rate expectations channel rather than direct cost exposure.
Real Estate (XLRE) – Mild Negative – 1–3 Months. The interest rate channel operates identically to the crude spike scenario: higher gasoline → higher CPI → higher rate expectations → higher discount rate → XLRE valuation compression. There is an additional geographic dimension worth noting: suburban and exurban real estate – where car dependency is highest – faces a subtle demand headwind as high gasoline costs make long commutes more expensive. This is a slow-moving effect, but in sustained multi-year gasoline price elevations, it has historically shifted housing demand toward more urban, transit-accessible locations. Expect 1–2% relative underperformance in the near term.
Technology (XLK) – Mild Negative – 1–3 Months. The Fed policy channel delivers the primary XLK headwind. Higher gasoline-driven CPI increases the probability of a restrictive Fed, which compresses growth stock multiples. The direct operating cost exposure for technology companies is limited – data centres are electricity-powered, not gasoline-powered. The risk concentration is in companies with large field service operations or physical delivery infrastructure. Expect 1–2% relative underperformance over two quarters in a sustained gasoline spike, with the magnitude scaling with the Fed's perceived response.
Consumer Discretionary (XLY) – Strong Negative – Immediate to 3 Months. This is the most important and the fastest-moving impact in a gasoline spike – faster than in a crude oil spike because the consumer sees the price change in real time at the pump. Restaurant spending, entertainment, travel, and retail all face income compression within weeks of a sustained pump price increase. The internal divergence within XLY matters enormously: discount retailers and dollar stores serving lower-income consumers see faster and sharper demand reduction than premium brands serving higher-income consumers who spend a smaller fraction of their income on fuel. Historically, XLY underperforms SPY by 4–7% over two to three quarters following a major gasoline spike, with the damage front-loaded in the first quarter rather than back-loaded as in crude-driven consumer impacts.
Consumer Staples (XLP) – Moderate Negative – 3–9 Months. Logistics costs rise as gasoline-fuelled transportation networks pass fuel surcharges through to shippers. Food producers, beverage companies, and household goods manufacturers all see their transportation line items increase within one to two quarters of a sustained gasoline spike. Unlike crude-driven XLP impacts – which work through packaging and agricultural inputs – the gasoline channel is purely logistical. The magnitude is moderate: 2–3% relative underperformance over two to three quarters, arriving after the XLY consumer income effect has already activated.
Communication Services (XLC) – Mild Negative – 3–9 Months. As lower-income consumer spending compresses under higher fuel costs, advertising budgets at consumer-facing companies soften. The connection runs through the corporate revenue-to-marketing-budget relationship: when consumer companies report revenue misses driven by gasoline-induced spending compression, the first discretionary cut is typically the advertising line. XLC underperforms by 1–2% over two to three quarters, concentrated in the advertising-dependent names within the sector.
Healthcare (XLV) – Mild Negative – 3–9 Months. Healthcare has a specific exposure to gasoline price spikes that most analysis overlooks: patient deferral of elective and non-emergency care. When gasoline prices spike, lower-income patients – who face the largest proportional income squeeze – defer optional medical appointments, follow-up visits, and elective procedures because of the combined burden of higher fuel costs and reduced disposable income. This deferred demand compresses revenue for outpatient facilities, specialty practices, and elective procedure providers within XLV. The magnitude is mild – 1–2% underperformance – but the mechanism is unique to gasoline among commodity shocks.
Financials (XLF) – Mild Negative – 1–3 Months. Financials face the consumer credit quality dimension: when gasoline spikes compress lower-income household budgets, delinquency rates on auto loans and credit cards serving that demographic tend to rise. Regional banks with high consumer lending exposure in economically stressed geographies – particularly rural and suburban areas where car dependency is highest – face higher provisioning requirements. The net XLF signal is mildly negative, connecting all three transmission layers through the consumer credit quality channel. Expect 1–2% relative underperformance, concentrated in consumer-lending-heavy regional banks rather than large-cap diversified financials.
Historical Cases That Confirm the Pattern
2007–2008 | $4 National Average – The Consumer Breaking Point
The US national average gasoline price crossed $4 per gallon for the first time in June 2008, reaching a peak of $4.11before the financial crisis collapsed demand and prices fell sharply.
The consumer spending effect was immediate and documented: retail sales data showed restaurant, entertainment, and discretionary retail spending falling in May and June 2008 as the pump price crossed the psychological threshold. XLY underperformed the S&P 500 by more than 15% in the six months following the $4 crossing. The Stanford SIEPR research tradition began analysing this event specifically because the spending compression was so concentrated among lower-income households – those in the bottom income quartile cut food-away-from-home spending by over 6%. Independent refiners within XLE initially saw crack spread compression as crude costs rose faster than pump prices, before reversing as refinery utilisation fell later in the cycle. Lag window: XLY consumer impact within four to eight weeks of the $4 crossing; XLI fleet business margin compression within one quarter; XLF consumer credit deterioration within two quarters.
2011–2012 | Geopolitical Premium and the $3.90 Sustained Plateau
The Arab Spring disruptions and Iranian sanctions fears in 2011–2012 kept US gasoline prices at a sustained $3.50–$3.90level for over eighteen months – not a single spike but a prolonged elevation that produced a slow-motion consumer spending compression. This case is instructive because the gradual nature of the price increase meant consumers adjusted spending over time rather than responding to a single shock. XLY consumer discretionary underperformed over the entire period, with the damage concentrated in fuel-sensitive sub-sectors: auto dealers (higher running costs made consumers keep existing cars longer), casual dining chains, and value-oriented retail. Independent refiners outperformed as the geopolitical risk premium elevated crack spreads during refinery constraint periods. Lag window: XLY gradual 18-month relative underperformance; XLE refiners outperformed in periods of crack spread widening; XLP logistics cost headwinds appeared in Q2 2012 earnings.
2022–2023 | Russia-Ukraine, $5 National Average, and the Fastest Consumer Response on Record
The Russian invasion of Ukraine in February 2022 sent US gasoline to a national average peak of $5.01 per gallon in June 2022 – the highest on record. The consumer response was the fastest and most measurable in the post-smartphone era: location data from retail establishments showed foot traffic to restaurants and entertainment venues declining within two weeks of the $4 crossing. Credit card spending data (published weekly by major banks) showed the shift from discretionary to essential spending in real time. XLY fell over 25% in the first half of 2022, with the gasoline income effect compounding the broader inflation and rate environment. The geographic concentration was stark: rural and suburban zip codes saw larger spending reductions than urban areas with transit alternatives. Independent refiners within XLE – particularly Valero – saw record profits as crack spreads widened sharply when refinery capacity remained constrained while crude and demand both rose. Lag window: XLY consumer response within two to four weeks; refiner outperformance within days of crack spread widening; XLP logistics costs within one to two quarters.
The Before/During/After Playbook
Before: What to Watch for Early Warning
Monitor the EIA weekly retail gasoline price report, published every Monday at 4pm EST (eia.gov/petroleum/gasdiesel). The EIA tracks the national average and regional averages for regular, mid-grade, and premium gasoline. When the national average rises by more than 15 cents per gallon over three consecutive weekly readings – particularly during the April-to-June summer blend transition, when refineries switch to more expensive summer-grade formulations – the setup for a sustained spike is forming. The summer blend transition alone adds 10–20 cents per gallon to refinery production costs and historically produces a seasonal spike that XLY traders should anticipate every spring.
Track the gasoline crack spread in real time using the RBOB-WTI spread (RBOB is the futures contract for reformulated blendstock for oxygenate blending, the benchmark gasoline futures). Available on CME Group's website and major futures platforms. When the RBOB-WTI crack spread widens above $30 per barrel – meaning refiners are earning more than $30 in margin for every barrel of crude they process into gasoline – independent refiner stocks within XLE are in their sweet spot.. This indicator directly predicts refiner profitability one to two quarters ahead of earnings confirmation.
Watch the AAA national average gasoline price tracker (gasprices.aaa.com, updated daily) alongside the University of Michigan Consumer Sentiment Survey (published monthly, second Friday of each month). AAA data is the most real-time publicly available gasoline price indicator. The University of Michigan survey includes a specific gasoline price expectations question that historically leads consumer spending changes by four to six weeks. When sentiment falls while gasoline expectations rise simultaneously, the XLY compression trade is setting up in real time. You’ll notice this combination tends to appear well before the retail sales data confirms it.
During: Positioning When the Spike Is Live
Buy independent refiner names (Valero, Phillips 66, Marathon Petroleum) within XLE rather than the blended XLE ETF when the RBOB-WTI crack spread is widening. The refiner trade is more precise than the XLE trade during a gasoline-specific spike and has historically delivered 2–3x the return of broad XLE in crack spread widening cycles. The ETF-level XLE position dilutes the refiner signal with crude producers whose economics may not be improving. Position with a two to three quarter time horizon – crack spread cycles tend to be sustained rather than transient when they are driven by refinery capacity constraints.
Underweight XLY consumer discretionary relative to benchmark, with particular focus on reducing exposure to restaurant chains, casual dining, and budget retail names serving lower-income demographics. These sub-sectors historically lead XLY's decline in a gasoline spike because their customer base has the least income buffer. You do not need to short XLY outright – reducing allocation from benchmark weight while the income effect activates gives you the relative positioning with less risk than an outright short on consumer spending.
Initiate a relative rotation from XLY into XLP within your consumer allocation, sized for the one to two quarter window of consumer income compression. The XLP staples trade during a gasoline spike is less about margin expansion – logistics costs are rising – and more about relative demand resilience: people buy groceries and household goods even when fuel is expensive, while restaurant meals and entertainment are the first cuts. The XLP/XLY relative trade has historically delivered 3–5% over two quarters during sustained gasoline spikes above $4 per gallon.
After: The Lagged Rotation Trade
Monitor the EIA weekly gasoline price for three consecutive weekly declines below a key threshold – particularly below $3.50 nationally – as the signal that the income compression trade is ending. When gasoline prices sustain a downtrend for three to four weeks, consumer behaviour begins recovering within four to six weeks as the psychological relief effect kicks in. Begin rebuilding XLY exposure when the EIA weekly data shows the third consecutive decline, sized for a two quarter recovery window.
Watch refinery utilisation rates (published weekly by EIA in the Weekly Petroleum Status Report, Wednesdays at 10:30am EST). When utilisation rates fall below 85% – indicating reduced output – crack spreads have typically already peaked and are beginning to compress. That compression signal is your exit from the independent refiner trade. Do not wait for refiner earnings to confirm – the utilisation data leads earnings by one full quarter.
Add XLY lower-income consumer sub-sectors selectively on the gasoline price recovery, targeting dollar stores and discount retailers that saw the sharpest demand compression during the spike. These names typically recover faster than premium consumer brands because pent-up demand for value-priced discretionary spending is the first spending category to rebound when fuel costs ease. The recovery trade in discount retail has historically outperformed broad XLY by 3–4% in the two quarters following a sustained gasoline price decline from elevated levels.
The 3 Mistakes Most Retail Traders Make
Mistake 1: Treating the XLE Refiner and Producer Trade as Identical
The most specific and most costly mistake in a gasoline spike is buying broad XLE and expecting it to capture the refiner trade. When gasoline outpaces crude input costs – the crack spread widening scenario – independent refiners can generate extraordinary margins while crude oil producers are seeing a more modest benefit. The ETF-level XLE blends these two very different economics into a single return that dilutes both signals. The institutional approach is to identify whether the current spike is crack-spread-driven (refinery constraints, seasonal blend transition, regional disruption) or crude-driven (supply shock, geopolitical premium), and then access the specific sub-sector that benefits. Broad XLE during a crack spread event is approximately half as effective as owning the refiners directly.
Mistake 2: Underestimating the Speed of the Consumer Impact
Traders who learned commodity-to-consumer transmission from crude oil posts expect a two to three quarter lag before XLY feels the pressure. In a gasoline spike, that lag compresses to two to six weeks. The reason is the daily visibility of the pump price – no other input cost is as psychologically immediate and behaviourally influential as the number on the gas station sign. By the time the next monthly retail sales report is published, the gasoline income effect is already visible in credit card spending data. Traders who wait for the official retail sales miss to confirm XLY underperformance are typically entering the trade one to two months after the optimal entry point.
Mistake 3: Ignoring the Lower-Income Consumer Concentration
The third mistake is treating XLY as a monolithic consumer sector when gasoline spikes create sharp internal divergence. Premium consumer brands serving higher-income households – luxury retailers, fine dining, premium travel – face minimal demand impact from a gasoline spike because their customers spend a trivial fraction of income on fuel. Budget retailers, casual dining chains, and mass-market entertainment – serving households where gasoline is 5–8% of monthly income – face immediate and significant demand compression. The trader who sells broad XLY is capturing some of this effect but is also selling premium consumer brands that are largely unaffected. The precise trade is rotating within XLY from value-consumer sub-sectors to premium-consumer sub-sectors during the spike, and reversing the rotation when gasoline prices normalise.
Bottom Line: The One-Sentence Institutional Framework
When gasoline spikes sharply, identify whether crack spreads are widening (buy refiners within XLE directly, not broad XLE), rotate from XLY value-consumer names to XLP within two to four weeks – not quarters – and watch the EIA weekly price data for three consecutive declines as the signal to reverse the consumer rotation.
This framework works across cycles because the behavioural immediacy of gasoline prices – the daily visibility at the pump, the non-negotiable commuting requirement, the disproportionate burden on lower-income households – does not change between 2008 and 2025. Consumers see gasoline prices before they see any other commodity price, and they adjust spending faster than any other commodity shock produces. That speed is the edge: most institutional playbooks built around crude oil transmission are too slow for gasoline, and the traders who apply a crude oil timeline to a gasoline event consistently exit positions too late and enter recovery trades too early.
Run this scenario through the [Breakout Bulletin Ripple Engine](LINK: Ripple Engine Tool) to see the full sector transmission map, compare the speed difference between gasoline and crude oil transmission, and get the complete timing sequence for all twelve sectors when pump prices move sharply.
FAQ: Gasoline Price Surges and Stock Market Impact
What happens when gasoline prices rise sharply?
When gasoline prices rise sharply, refiners and some energy companies may benefit, while consumers, transportation businesses, restaurants, and discretionary retail sectors often face pressure from reduced spending power.
Why do gasoline prices impact consumers so quickly?
Gasoline prices affect consumers immediately because fuel is purchased frequently and directly impacts household budgets. Consumers often reduce discretionary spending within weeks of major pump price increases.
Which sectors benefit most from rising gasoline prices?
Independent refiners such as Valero, Phillips 66, and Marathon Petroleum often benefit the most when gasoline prices rise faster than crude oil prices because refining margins, known as crack spreads, expand.
What is the crack spread?
The crack spread is the difference between the cost of crude oil and the selling price of refined gasoline and fuel products. Wider crack spreads usually improve refiner profitability.
Why does Consumer Discretionary (XLY) fall during gasoline spikes?
Higher gasoline prices reduce disposable income, especially for lower-income households. Consumers often cut spending on restaurants, entertainment, travel, and non-essential retail first.
How do gasoline price spikes affect inflation?
Higher gasoline prices increase transportation and logistics costs across the economy, which eventually raises prices for goods and services and contributes to broader inflation pressure.
Why are refiners different from crude oil producers?
Refiners profit from processing crude oil into gasoline and other fuels. Their profitability depends on crack spreads, not just crude oil prices, which means refiners and oil producers can perform differently during gasoline spikes.
What is the typical sector rotation during a gasoline spike?
The typical sequence starts with refiners within XLE benefiting first, followed by weakness in Consumer Discretionary (XLY), transportation-heavy Industrials (XLI), and later pressure on Consumer Staples (XLP) through rising logistics costs.
This post is part of the BreakoutBulletin "What Happens When" series. [LINK: Energy Hub] · [LINK: Series Pillar Page]
Educational content only. Not investment advice. Past sector performance patterns do not guarantee future results.