
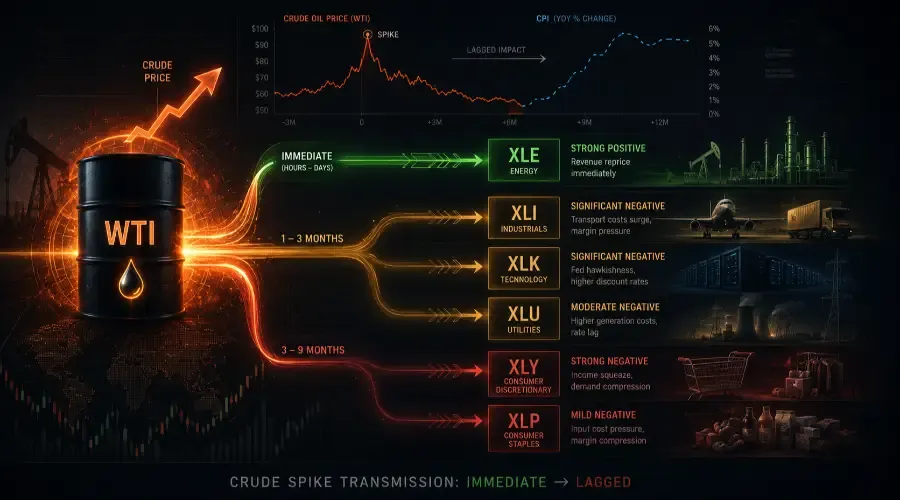
When crude oil prices spike, the playbook is as old as the oil market itself—and traders who understand the sequence can anticipate moves that most people only notice months later. This post breaks down the full oil shock investing framework: the transmission chain, the sector rotation, and the specific moments when energy stocks, airlines, consumer names, and even technology repricing show up. In June 2025, oil prices leaped 7% in a single session and the broad US market slumped more than 1% the same day. By March 2026, a fresh supply shock had traders anxious again – the same playbook, the same sequence, the same sector divergence. When crude moves this fast, most retail traders fixate on energy stocks and miss the real trade: the ripple that starts in XLE and ends, two to three quarters later, in your grocery bill, your mortgage rate, and the earnings of companies you'd never connect to a barrel of oil.
Why This Matters More Than Most Traders Realize
A crude oil spike is not an energy sector event. It is an economy-wide cost injection that reprices eleven sectors across three layers of the economy – and it does so in a predictable sequence that has repeated across every major oil shock since 1973.
The numbers make the stakes clear. Energy costs are embedded in virtually every product and service in the modern economy. Transportation, manufacturing, agriculture, chemicals, packaging, heating, electricity generation – oil and its refined products touch all of them. When Brent crude moves from 70 to 90 per barrel, it is not just XLE that notices. Airlines face an annualised fuel bill increase of hundreds of millions per carrier. Food producers see packaging and logistics costs surge. Utilities face higher generation costs. The Federal Reserve starts monitoring CPI energy components for pass-through inflation—and that’s where the real crude oil impact on economy starts showing up.
Historically, a sustained 20% crude oil spike has added 0.3–0.6 percentage points to core CPI within two to three quarters. That is enough to shift Fed policy expectations, reprice rate-sensitive sectors, and compress consumer discretionary margins – all from a single commodity move. The sector divergence that follows is not random. It is mechanical, it is sequenced, and if you understand the chain, you can position ahead of it. [LINK: Energy Hub]
The Chain Reaction: How a Crude Spike Moves Through the Economy
The first sector to move is always Energy (XLE), and it moves within hours of the price signal. This is the only part of the transmission chain that happens in real time – crude oil producers, refiners, and integrated majors see their revenue models reprice immediately as futures markets update. Exploration and production companies within XLE are the most direct beneficiaries, as every dollar added to the barrel price drops almost entirely to the revenue line before costs adjust. This is why XLE can gain 5–8% on a single session when crude jumps sharply.
The second movement happens in Materials (XLB), and it comes within days, not weeks. The reason is the commodity correlation structure: when crude spikes, petrochemical feedstocks, plastics, and industrial chemicals – which are priced relative to crude – also reprice. Mining and specialty chemical companies within XLB see their cost structures shift. This is a partial beneficiary signal, not a clean winner like XLE, because XLB companies also consume energy as an input. The net effect is positive for commodity-adjacent names but mixed for energy-intensive manufacturers within the same ETF.
The third movement – and this is where the real institutional positioning happens – is in the supply chain absorption layer. Industrials (XLI) start to feel the cost pressure within the first month. Airlines within XLI represent the most direct and most dramatic sub-sector impact: jet fuel typically accounts for 20–25% of an airline's operating costs, and there is no immediate hedge that eliminates this exposure for most carriers. Trucking and logistics companies face higher diesel costs that compress margins before they can renegotiate freight rates with customers – a process that typically takes one to two quarters. Utilities (XLU) face higher generation costs from natural gas and oil-fired peaker plants, and because utility rates are regulated, they cannot pass costs through immediately. Real Estate (XLRE) feels the pressure indirectly as rising energy costs feed into CPI expectations, which push bond yields higher, which compress real estate valuations through the discount rate mechanism.
Technology (XLK) and its connection to an oil spike is the most counter-intuitive part of the chain, and it is the section that every competing analysis skips. The link runs through two channels: data center energy costs (a rising cost for cloud infrastructure companies) and the Fed policy response channel. When oil spikes and CPI rises, the Federal Reserve becomes more hawkish. Higher rate expectations compress the discount rate used to value long-duration growth stocks. XLK, with its high-multiple, long-duration earnings profile, reprices lower on Fed hawkishness even if its direct energy exposure is limited. This channel takes one to two quarters to fully transmit.
The final movement reaches Layer 3 – the consumer – in the three-to-nine-month window. Consumer Discretionary (XLY) faces a two-sided squeeze: fuel costs rise (reducing disposable income for other spending) and the goods they sell become more expensive to manufacture, transport, and deliver. Consumer Staples (XLP) faces similar input cost pressure but with a partial buffer – consumers do not stop buying food and household goods when oil spikes, they reduce other spending first. Communication Services (XLC) and Healthcare (XLV) feel the pressure last, primarily through the macro channel of rising inflation and tightening financial conditions rather than direct energy exposure.
Sector-by-Sector Impact: Who Wins, Who Loses, and When
Energy (XLE) – Strong Positive – Immediate.
This is the direct beneficiary. Every dollar added to the per-barrel price translates to higher revenue for producers before costs adjust. XLE historically gains 5–10% in the first four weeks of a sustained crude spike. The distinction that matters: upstream producers (pure-play E&P companies) benefit more than refiners, who face margin compression as both crude costs and gasoline prices move. The cleanest trade within XLE is in the producers, not the integrated majors.
Materials (XLB) – Moderate Positive – Immediate.
Commodity-correlated materials benefit from the broader commodity complex lifting. Fertiliser companies (Mosaic, Nutrien) see their petrochemical input costs rise but also benefit from farmers seeking to maximise yields during high-energy price periods. Specialty chemicals and plastics producers have more mixed outcomes. The net XLB signal is positive but less clean than XLE – expect 2–4% relative outperformance in the first month.
Industrials (XLI) – Significant Negative – 1–3 Months.
This is the most important losing sector and the one most retail traders underweight in their analysis. Airlines are the first to report margin pressure, typically in the next quarterly earnings call after the spike. Trucking and freight companies face higher diesel costs with a one-to-two-quarter lag before they can reprice freight contracts. Defence and aerospace names within XLI are more insulated – their energy exposure is indirect. Expect XLI to underperform by 3–6% relative to SPY within one to two quarters of a sustained spike.
Utilities (XLU) – Moderate Negative – 1–3 Months.
Utilities face a dual headwind: higher generation costs (oil and gas inputs) and rising bond yields as inflation expectations climb. Regulated utilities cannot immediately pass higher energy costs to ratepayers – that process requires regulatory approval and takes six to twelve months in most states. The result is margin compression that shows up in the next one to two earnings cycles. XLU tends to underperform by 2–4% relative to SPY over the six months following a significant crude spike.
Real Estate (XLRE) – Mild Negative – 1–3 Months.
The connection runs through the interest rate channel rather than direct energy costs. When crude spikes, bond markets price in higher inflation and a more hawkish Fed. The 10-year Treasury yield typically rises in sympathy, and XLRE – which is valued as a yield-competing asset class – reprices lower as discount rates rise. This is not a first-order energy impact; it is a second-order financial conditions impact. Expect XLRE to lag SPY by 2–3% within two to three months of a sustained spike.
Technology (XLK) – Significant Negative – 1–3 Months.
The mechanism is almost entirely the Fed policy channel. Higher crude → higher CPI → hawkish Fed expectations → higher discount rate → compression of high-multiple growth stocks. XLK's direct energy cost exposure (data centres) is real but modest compared to the multiple compression effect. In the 2022 cycle – where the crude spike was both large and sustained – XLK fell 33% as the Fed response dwarfed the direct energy cost impact. Mild spikes produce 1–2% relative underperformance; sustained spikes with a Fed response produce 5–10% underperformance.
Consumer Discretionary (XLY) – Strong Negative – 3–9 Months.
The consumer feels the crude spike in two ways: higher fuel costs (gasoline, heating) that directly reduce disposable income, and higher prices for goods that have oil-linked manufacturing and transport costs. The timing lag is longer than most expect – three to six months for the full income effect to compress spending. Airlines and cruise lines within XLY are the fastest to feel it; auto dealerships and home improvement retailers take longer. Historically, XLY underperforms by 5–8% in the two to three quarters following a major crude spike.
Consumer Staples (XLP) – Mild Negative – 3–9 Months.
Staples is the relative defensive play – consumers continue buying food and household goods even as energy costs rise, but they shift to value brands and private labels, compressing margins for branded staples producers. Packaging costs (plastic, cardboard) and logistics costs both rise with crude, compressing the COGS line before companies can raise retail prices. The XLP underperformance is milder than XLY – typically 2–3% over two to three quarters – because the demand side is inelastic even as the cost side rises.
Communication Services (XLC) – Mild Negative – 3–9 Months.
The link is indirect and works through the advertising budget channel. As consumers feel squeezed by higher energy costs and companies face rising input costs, marketing and advertising budgets are typically among the first discretionary expenses cut. This reduces revenue for the advertising-dependent names that dominate XLC. The lag is long – three to six months – and the magnitude is mild relative to the direct energy and industrial sectors. Expect XLC to lag SPY by 1–2% over the following two quarters.
Healthcare (XLV) – Mild Negative – 3–9 Months.
Healthcare's connection to crude is through device manufacturing costs, pharmaceutical supply chain logistics, and – for hospitals and healthcare facilities – energy operating costs. These are all real but modest compared to direct energy sectors. The bigger impact on XLV comes from the macro channel: rising inflation and tighter financial conditions reduce the multiple investors are willing to pay for defensive growth stocks. XLV tends to be a modest relative safe haven in mild spikes but underperforms in sustained, large spikes that trigger a full Fed tightening cycle.
Financials (XLF) – Mild Negative – 1–3 Months.
Financials connect all three layers and face a mixed signal from a crude spike. On the positive side, rising inflation expectations can lift the long end of the yield curve, improving net interest margins for banks. On the negative side, rising energy costs increase credit risk in the energy loan portfolios of regional banks, and a slowing consumer economy increases default probabilities on consumer credit. The net effect is typically mild negative – financials underperform by 1–2% relative to SPY – but the direction can flip in mild spikes where the yield curve steepening effect dominates.
Historical Cases That Confirm the Pattern
2007–2008 | Demand-Driven Bull to Economic Collapse
WTI crude rose from approximately 60 perbarrel in mid−2007 to a peak of 147 per barrel in July 2008 – a 145% move driven by China's industrial demand and speculative positioning. XLE was the top-performing sector for the first eighteen months of this move, gaining over 40% while the broader market stalled. Airlines within XLI began reporting catastrophic losses by Q1 2008 – several major carriers filed for bankruptcy or entered emergency hedging programs. Consumer discretionary spending began declining three to four quarters after the initial spike, as the income effect compounded with the broader housing crisis. The Fed, already managing a financial crisis, could not respond to oil-driven inflation in its usual way – a lesson in how crude spikes interact with the existing macro regime. Lag window: XLE immediate; XLI airline losses within two quarters; XLY consumer impact within three to four quarters.
2014–2016 | The Collapse Reversal – Reading the Unwind
This case is the mirror image – and understanding the unwind is as important as understanding the spike. OPEC's November 2014 decision to maintain production despite falling prices sent WTI from 100 to a low of 26 per barrel by early 2016. XLE lost over 40% of its value. But the sectors that had suffered during the 2011–2014 high-oil period – airlines, consumer staples, consumer discretionary – saw their margins expand dramatically. Airlines reported record profits in 2015 and 2016 as jet fuel costs collapsed. XLP food companies saw packaging and logistics cost relief. The lesson: every sector impact of a spike reverses with a predictable lag when the spike unwinds. Lag window: XLE immediate on both directions; XLI airline margin benefit within two quarters; XLY income effect benefit within two to three quarters.
2025–2026 | The Geopolitical Premium Returns
In June 2025, crude oil jumped 7% in a single session on supply disruption concerns, and the broad US market fell more than 1% that day – a direct confirmation of the negative correlation between sharp oil spikes and equity sentiment. By March 2026, a fresh wave of oil market anxiety had returned, with analysts flagging growing crosswinds between elevated crude and vulnerable consumer spending. The pattern that played out was consistent with historical precedent: XLE outperformed immediately, transport-heavy XLI names began flagging cost pressure in earnings guidance, and economists revised CPI forecasts upward within six weeks of the spike. The modern case confirms that the transmission chain – despite algorithmic markets and faster price discovery – still operates on the same fundamental timing that historical data established. Lag window: XLE within days; XLI guidance revisions within one quarter; consumer impact tracking for two to three quarters.
The Before/During/After Playbook
Before: What to Watch for Early Warning
Watch WTI and Brent futures in overnight markets (CME and ICE). A crude spike that starts in the overnight session – when US equity markets are closed – gives you a positioning window before the open. Set alerts at $5 increments above current price on CME's WTI front-month contract. A move that holds through the overnight and into the morning session is the confirmation signal that institutional money is repositioning, not just a knee-jerk reaction to a headline.
Monitor the Baker Hughes US rig count, published every Friday at 1pm EST. A falling rig count over three to four consecutive weeks – even before a price spike – signals that supply is beginning to tighten. When the rig count falls and geopolitical risk rises simultaneously, the setup for a sustained spike (rather than a one-day event) is in place. Falling rigs plus rising geopolitical risk is the two-factor pre-spike signal worth acting on early.
Track the CBOE Crude Oil Volatility Index (OVX) as a real-time sentiment gauge. When OVX rises above 40 – indicating the options market is pricing significant uncertainty in crude – institutional hedging demand is rising. This typically precedes or coincides with the actual price spike rather than lagging it. A rising OVX with crude prices already elevated is the warning that the spike may accelerate, not stabilise.
During: Positioning When the Spike Is Live
Long XLE via the SPDR Energy Select Sector ETF, sized to your risk tolerance, with a trailing stop below the 20-day moving average. The energy sector trade during an active spike is mechanical – revenue reprices immediately, and institutional money flows into XLE within the first 24 to 48 hours of a confirmed sustained move. Avoid individual E&P names unless you have specific knowledge of their hedging programs – integrated majors and pure upstream producers behave differently in the early weeks of a spike.
Underweight XLI via reduced allocation or protective puts on airline-heavy names within the industrials complex. You do not need to short XLI outright – simply reducing your existing allocation relative to benchmark is sufficient positioning during the one to two quarter window where transport margin compression is transmitting. The options market on airline names tends to underprice this risk in the first four to eight weeks, making put options relatively cheap relative to the expected earnings impact.
Rotate from XLY to XLP within your consumer allocation. This is the relative value trade, not a direction call on the consumer. During a crude spike, Consumer Staples outperforms Consumer Discretionary on a relative basis because staples demand is inelastic while discretionary demand is the first victim of disposable income compression. The XLP/XLY pair trade has historically delivered 4–6% relative performance over two to three quarters following a 15%+ crude spike.
After: The Lagged Rotation Trade
Add XLI quality names on weakness two to three quarters post-spike, once management earnings calls confirm that freight rate renegotiations have been completed and fuel surcharges have been passed through to customers. The language to listen for: "We have repriced our freight contracts" or "fuel surcharges are now in place." That commentary signals the margin compression phase is ending and the recovery phase begins. XLI transport names historically recover to new highs within two to three quarters of cost absorption completion.
Monitor the CPI energy component monthly (BLS release, second week of each month). When the year-over-year comparison on CPI energy begins declining – the base effect from the prior year's spike – expect XLY to begin recovering as the real income headwind eases. The rotation back into discretionary from staples mirrors the initial XLY-to-XLP move, with a six to nine month delay. This is the mean-reversion trade most retail traders miss.
Watch for the Fed pivot signal. If the crude spike was large enough and sustained enough to produce a CPI reaction that changed Fed policy, the rate-sensitive sectors (XLRE, XLU, XLK) are the recovery trade once the Fed pivots back. The sequencing of the recovery mirrors the sequencing of the damage: XLRE and XLU first (rate sensitive), then XLK (growth), then XLY (consumer confidence). The trigger is the first Fed statement that explicitly acknowledges energy price normalisation in its inflation outlook.
The 3 Mistakes Most Retail Traders Make
Mistake 1: Buying XLE After the Spike Is Already 10% In
The most common crude-oil-spike mistake is chasing XLE after it has already moved. By the time the news is on every financial site and your trading app is showing XLE up 6%, the institutional money has already repositioned. The correct institutional approach is to own XLE before the spike – through the early-warning indicators – or to wait for the first pullback after the initial move and enter on the retest of the breakout level. Buying XLE on day three of a 10% move is not the energy trade; it is a momentum trade with a compressed risk/reward ratio. The professionals were buying before the news cycle that you are reading.
Mistake 2: Treating the Spike as a One-Sector Event
The second mistake is watching XLE go up and concluding the analysis is complete. A crude oil spike is a twelve-sector event that plays out over three to nine months, and the largest relative performance opportunities are often in the sectors that move second and third – not the first. The airlines within XLI that begin underperforming one to two quarters after the spike, the XLY consumer names that get squeezed by the income effect in quarter three, the XLP staples companies that face margin compression in their next earnings cycle – these are the opportunities that most retail traders never see because they stopped watching after XLE moved. The institutional edge is not knowing that oil moved. It is knowing what oil moving means for companies that most investors never connect to a barrel of crude.
Mistake 3: Ignoring the Magnitude and Duration Test
Not all crude spikes are equal, and the mistake is treating every spike identically. A 5% move on a single geopolitical headline that reverses within a week produces almost none of the transmission chain impacts described in this post. A 20% move that holds for six weeks produces all of them. Before sizing any position in response to a crude spike, ask two questions: Is this move greater than 15%? Has it held for more than two weeks? If the answer to both is yes, the full transmission chain is likely to activate and you should position accordingly across multiple sectors. If the answer to either is no, the trade is likely contained to XLE itself, and the broader sector rotation calls are premature.
Bottom Line: The One-Sentence Institutional Framework
When crude oil spikes more than 15% and holds, buy XLE immediately, underweight XLI transport names within one quarter, rotate from XLY to XLP within two quarters, and watch for the Fed policy response as the signal for when the trade is over.
This framework works across cycles because the underlying mechanism – energy costs embedded in every sector's cost structure, transmitting upward through the economy with predictable lags – does not change between 2008 and 2026. The companies, the headlines, and the geopolitical triggers all change. The chain does not.
The retail edge here is not faster information. It is a longer time horizon than the news cycle. By the time crude makes the front page, the XLE trade is already in progress. The real alpha is in the second and third-order effects – the XLI margin compression two quarters from now, the XLY income squeeze three quarters from now – that most market participants are not yet thinking about when the headline prints.
Run this scenario through the [Breakout Bulletin Ripple Engine](LINK: Ripple Engine Tool) to see the full sector transmission map, adjust intensity to match your view on the magnitude of the spike, and get the complete Before/During/After timing sequence for all twelve sectors in a single interactive view.
FAQ: Crude Oil Price Spikes and Stock Market Impact
What happens when crude oil prices spike?
When crude oil prices spike, energy stocks usually rise first, while transportation, airlines, consumer discretionary, and technology sectors often face pressure later due to rising costs and inflation concerns.
Which sectors benefit most from rising oil prices?
Energy companies and oil producers within XLE usually benefit the most because higher crude prices directly increase revenue and profit margins for producers.
Which sectors perform poorly during an oil price spike?
Industrials, airlines, transportation companies, consumer discretionary stocks, and some technology stocks often underperform because higher fuel costs and inflation reduce margins and consumer spending.
How do oil prices affect inflation?
Higher oil prices increase transportation, manufacturing, logistics, and energy costs across the economy, which eventually pushes consumer inflation higher over the following quarters.
Why do technology stocks fall when oil prices rise?
Technology stocks often decline because rising oil prices can increase inflation expectations, leading to higher interest rates and lower valuations for growth stocks.
How does the Federal Reserve react to oil price spikes?
If higher oil prices push inflation higher for an extended period, the Federal Reserve may adopt a more hawkish stance by delaying rate cuts or tightening monetary policy.
Why do airline stocks suffer during oil price spikes?
Airlines are heavily exposed to fuel costs, which typically account for a large portion of operating expenses. Rising jet fuel prices can quickly compress airline profit margins.
What is the typical sector rotation during an oil shock?
The usual sequence starts with Energy (XLE) outperforming first, followed by pressure on Industrials (XLI), Technology (XLK), Consumer Discretionary (XLY), and eventually broader consumer sectors as inflation spreads through the economy.
This post is part of the BreakoutBulletin "What Happens When" series. [LINK: Energy Hub] · [LINK: Series Pillar Page]
Educational content only. Not investment advice. Past sector performance patterns do not guarantee future results.