
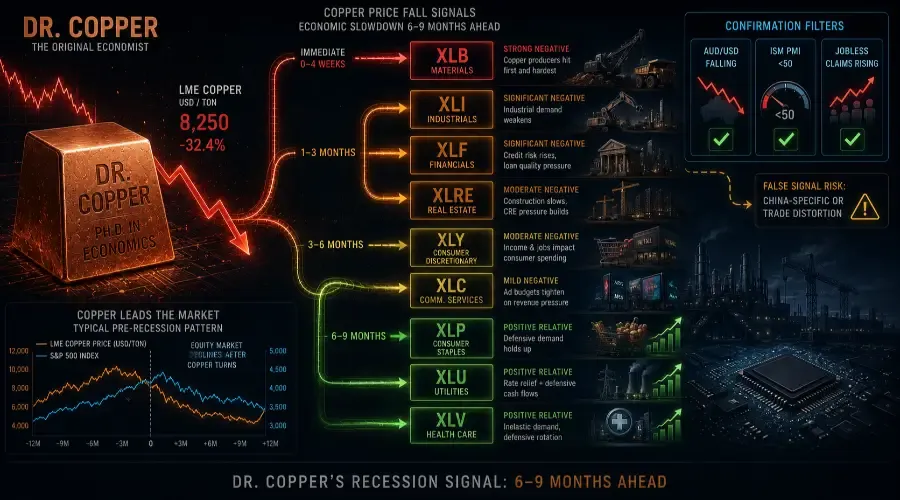
When copper prices fall sharply, the market listens. They call it "Dr. Copper" for a reason – it's the commodity with the best track record of sniffing out a recession months before economists catch up. In June 2022, copper prices fell more than 30% from their March peak in a matter of weeks – and financial analysts began openly asking whether the metal nicknamed "Dr. Copper" was issuing a recession warning that equity markets had not yet priced in. The S&P 500 was already down significantly, but the equity market was reacting to inflation and rate hikes. Copper was saying something different: global industrial demand was breaking. By the time the Federal Reserve confirmed a slowdown was underway in late 2022 and early 2023, copper had been flashing that signal for seven months. The traders who read it correctly had already rotated.
Why This Matters More Than Most Traders Realize
Copper is not just a commodity. It is the only raw material with broad enough economic touchpoints – construction, manufacturing, power infrastructure, consumer electronics, transportation – that its price functions as a real-time vote on global economic health. This is why the nickname "Dr. Copper has a PhD in economics" entered institutional trading vocabulary decades ago and has never left. In practice, the copper recession indicator works because copper demand sits at the very front of the industrial order book.
The historical lead time is the number that matters most: copper prices have historically peaked and begun declining six to nine months before the S&P 500 peaks in pre-recession environments. That is not a coincidence or a narrative – it is a structural feature of how physical commodity demand works. Manufacturers and construction companies that use copper are ordering based on their forward project pipelines. When those pipelines start emptying, copper orders fall before the revenue impact appears in any financial statement, before any unemployment data moves, and before any central bank acknowledges the slowdown.
What most analysis misses is the distinction between the signal and the story. Competing posts explain why copper is a leading indicator. They do not explain what sectors it leads, by how many months, or how to distinguish a genuine global recession signal from a China-specific demand story that does not transmit to US equity sectors in the same way. That distinction – how falling copper prices impact stocks differently depending on geography and confirmation – is the entire edge.
What This Is Really Saying: The Forward-Looking Reframe
When copper falls sharply, most market commentary frames it as a reaction to existing data – Chinese PMI numbers missed, global manufacturing surveys weakened, inventory builds appeared in warehouse reports. This backward-looking framing misses the point entirely. Copper does not react to the recession. It predicts it.
The mechanism is order-book driven. The companies that purchase copper in volume – electrical equipment manufacturers, construction contractors, automotive manufacturers, industrial machinery producers – place orders based on their contracted project pipelines, not based on current revenue. When a construction contractor receives fewer new project bids, their copper orders fall in the current quarter while their reported revenue is still reflecting projects from the prior two to three quarters. The copper market sees the demand evaporation before the income statement does.
This means a copper price fall is not a signal that the economy is in recession. It is a signal that the economy's forward order book is contracting. That contraction shows up in the copper market first, in corporate earnings guidance two quarters later, in official economic data three to four quarters later, and in Fed acknowledgment of slowdown five to six quarters later. When you see copper falling sharply and sustained – not a one-week move, but a three-week-plus sustained decline – you are reading a signal that is approximately two to three reporting cycles ahead of what analysts covering equities will say next quarter.
The practical implication: copper gives you a decision-making window. Not an infinite one, but a real one. Six to nine months is enough time to rotate sector exposure, reduce cyclical risk, and build positions in the sectors that outperform during slowdowns – before those sectors show up on the consensus recommendation lists of any major broker. In fast-moving shocks, that window can compress – the 2022 episode showed a shorter lag – but the historical base rate holds and the sequence remains reliable.
The Lead/Lag Map: What Copper Predicts and When
Understanding what copper's fall predicts requires mapping each affected sector to its specific lead time. This is the section that transforms a general warning signal into an actionable rotation calendar, effectively a copper sector rotation playbook.
0–4 weeks after a sustained copper decline begins: XLB Materials falls immediately and broadly, because copper producers within XLB are direct revenue victims of lower prices. You'll notice the XLB copper decline often starts before anyone mentions recession. AUD/USD weakens – the Australian dollar falls because Australia is the world's second largest copper exporter and the AUD functions as a real-time copper price proxy in foreign exchange markets. XLI industrial stocks begin diverging, with capital goods names starting to underperform as forward order concerns emerge.
1–3 months: XLI industrials broadly underperform as manufacturing PMI data starts confirming what copper orders already showed. Durable goods orders – a monthly economic release – begin missing consensus estimates. XLK technology hardware and semiconductor names face rising concerns about the enterprise and consumer electronics spending cycle, both of which are copper-intensive. XLF financials face rising credit risk concerns as the forward economic signal becomes clearer.
3–6 months: Equity market volatility typically increases as the official economic data begins catching up to what copper ordered months earlier. XLY consumer discretionary faces headwinds as the income and employment effects of the slowdown begin appearing in spending data. XLC communication services faces advertising budget pressure.
6–9 months: If the copper signal was a genuine recession precursor, this is the window where equity markets broadly confirm the slowdown that copper called. XLP, XLV, and XLU – the defensive sectors – outperform on a relative basis as capital rotates from cyclicals to defensives. The copper-driven defensive rotation that was signalled nine months earlier is now consensus.
The key insight: you are not acting on old information when you trade the copper signal. You are acting on the only forward-looking information in the entire economic data stack.
Sector Rotation Sequence: Who Moves and In What Order
Materials (XLB) – Strong Negative – Immediate. Copper producers within XLB face direct revenue compression as prices fall. Mining companies, copper refiners, and the diversified miners that anchor XLB all see earnings estimates cut in real time. XLB falls immediately and typically leads the equity market's broader recognition of the slowdown by several weeks. The magnitude is strong – historically 5–10% relative underperformance within four weeks of a confirmed copper breakdown.
Industrials (XLI) – Significant Negative – 1–3 Months. Capital goods manufacturers, industrial machinery producers, and construction equipment companies within XLI face the clearest forward demand signal from a copper decline. Their customers are the same companies that cut copper orders – which means the next quarter's orders for industrial equipment are also in question. XLI underperforms by 4–7% relative to SPY over two quarters following a sustained copper decline, with the heaviest damage in the capital goods and construction equipment sub-sectors.
Energy (XLE) – Moderate Negative – 1–3 Months. Copper's recession signal, when validated by subsequent data, implies lower global industrial activity – which reduces energy demand. XLE faces a demand destruction headwind that builds over one to two quarters as the slowdown thesis confirms. The initial XLE reaction to a copper fall is often muted; the damage compounds as the economic signal validates. Expect 3–5% relative underperformance over two quarters in a confirmed recession signal scenario.
Technology (XLK) – Moderate Negative – 1–3 Months. The connection runs through enterprise IT spending and consumer electronics demand – both copper-intensive in their hardware components. When copper signals a manufacturing and construction slowdown, enterprise capital expenditure plans tighten within one to two quarters, reducing demand for servers, networking equipment, and industrial technology. Consumer electronics demand softens as consumer confidence follows the economic data. XLK underperforms by 3–5% over two quarters.
Financials (XLF) – Significant Negative – 1–3 Months. Financials connect all three economic layers through the credit channel. A copper-signalled recession means rising corporate loan default risk, weakening commercial real estate demand, and deteriorating consumer credit quality – all of which hit XLF earnings two to three quarters after copper peaks. The pattern of XLF leading the equity market decline in pre-recession periods – as credit concerns emerge before official economic data – is well-documented historically. Expect 4–6% relative underperformance over two quarters.
Real Estate (XLRE) – Moderate Negative – 1–3 Months. Construction activity is among the most copper-intensive economic activities, consuming approximately 40% of global copper demand. When copper falls on construction demand collapse – as opposed to a pure manufacturing signal – XLRE faces a dual headwind: declining construction activity reduces new supply economics, and rising recession risk puts downward pressure on property values and REIT revenue. Expect 3–5% relative underperformance over two quarters.
Consumer Discretionary (XLY) – Moderate Negative – 3–9 Months. The consumer impact arrives later than the industrial impact, consistent with the lead/lag map above. As the slowdown signalled by copper materialises in employment and income data three to six months later, XLY faces revenue pressure from reduced consumer spending capacity. The internal XLY divergence matters: value-oriented and discretionary durable goods (auto dealers, home furnishings) face the sharpest impact, while premium brands serving higher-income consumers with more spending buffer underperform less. Expect 4–7% relative underperformance over two to three quarters in a confirmed recession scenario.
Consumer Staples (XLP) – Mild Positive Relative – 3–9 Months. XLP is the classic defensive rotation destination when copper signals recession. People continue buying groceries, household goods, and personal care products regardless of economic conditions – making XLP revenues relatively resilient. The positive signal for XLP is relative, not absolute: the sector outperforms by 3–5% relative to SPY over the six to nine months following a confirmed copper recession signal, even if absolute XLP returns are flat or mildly negative. Note: this is a relative outperformance call, not a guarantee of absolute gains. In severe copper-signaled recessions, even defensive sectors can suffer drawdowns, but they typically lose far less than cyclicals.
Utilities (XLU) – Moderate Positive Relative – 3–9 Months. As the recession thesis validates and the Fed pivots from hiking to holding or cutting, bond yields fall – which re-rates bond-proxy sectors like XLU upward. The double benefit of defensive revenue resilience and rate relief makes XLU historically the strongest performing sector in the six to nine months following a copper recession signal that validates. Expect 4–6% relative outperformance over two to three quarters.
Healthcare (XLV) – Mild Positive Relative – 3–9 Months. Healthcare demand is inelastic – patients require medication and medical care regardless of economic cycles. XLV outperforms on a relative basis as capital rotates from cyclicals to defensives. The magnitude is more modest than XLU because XLV's defensive premium is partially offset by political and regulatory risks that are cycle-independent. Expect 2–4% relative outperformance over two to three quarters.
Communication Services (XLC) – Mild Negative – 3–9 Months. Advertising budgets contract with economic confidence, reducing revenue for the advertising-dependent names that dominate XLC. The lag is long – corporate advertising decisions typically respond to two consecutive quarters of revenue misses before cuts are made. Expect 2–3% relative underperformance over two to three quarters in a confirmed recession scenario.
Historical Cases That Confirm the Pattern – Focus on the Early Signal
2007–2008 | Copper Peaks Nine Months Before the S&P 500
This is the definitive historical case for copper's leading indicator status. Copper peaked in May 2007 at approximately $3.77 per pound and began declining steadily. The S&P 500 did not peak until October 2007 – five months after copper had already turned. By the time Lehman Brothers collapsed in September 2008, copper had been falling for fifteen months. The traders who used copper's May 2007 turn as a rotation signal – selling XLB and XLI immediately, adding XLP and XLU over the following months – had nine months to position before the equity market confirmed what copper had already said. The magnitude of the subsequent decline makes this the highest-value copper signal in modern market history. Lag window: XLB and XLI peaked within two weeks of copper; XLY underperformed within three months; full equity market confirmation nine months after copper peak.
2011 | Copper Falls Seven Months Before European Crisis Confirms
Copper peaked at $4.60 per pound in February 2011 and began a sustained decline that accelerated through the summer. The European sovereign debt crisis – which became the defining macro event of 2011 – did not reach its acute phase until July and August 2011, when Italian and Spanish bond yields spiked and equity markets fell sharply. Copper had been signalling the deteriorating European industrial demand picture for seven months before that acute phase. The AUD/USD currency pair confirmed the copper signal: the Australian dollar peaked in May 2011 and fell 15% over the following six months as copper demand from China – Australia's largest export customer – weakened. Traders who used the February copper turn alongside AUD/USD as confirmation had a clear signal to rotate from XLB and XLI into XLU and XLP well before the August equity market dislocation. Lag window: copper and AUD/USD immediate; XLI underperformance within two to three months; broad equity correction seven months after copper peak.
2022 | The Fastest Copper Signal in Recent Memory
Copper fell from its March 2022 peak of approximately $4.90 per pound to below $3.20 by July – a 35% decline in four months. Financial analysts publicly flagged the recession signal in June 2022. This case is instructive because it occurred in an unusual context: equity markets were already falling significantly on inflation and rate hike concerns. The copper signal was therefore partially overlapping with an existing bear market rather than leading it cleanly. However, the forward signal copper was providing – about the depth of the demand slowdown – proved accurate: US GDP contracted in both Q1 and Q2 2022, manufacturing activity slowed through H2 2022, and the XLB materials sector underperformed the market materially through the second half of the year. The case demonstrates that copper's signal is additive to other bearish signals, not redundant. Lag window: XLB immediate from March 2022 peak; XLI followed within four to six weeks; equity market broadly confirmed over H2 2022.
The False Signal Trap: When to Ignore the Copper Decline
This section is unique to the copper post and absent from every competing analysis – which is precisely why so many traders lose money acting on false copper recession signals.
Copper has issued two significant false recession signals in the last decade, and understanding why they were false is as important as understanding when they are real.
2015–2016: The China-Specific Signal. Copper fell nearly 30% from its 2014 highs through early 2016. Every narrative in the financial press pointed to a copper-signalled global recession. The US economy did not enter recession. The S&P 500 fell approximately 15% in early 2016 and then recovered to new highs. What copper was signalling was real – but it was signalling a Chinese construction and infrastructure slowdown, not a global industrial recession. The key differentiator: US ISM Manufacturing PMI remained near 50 (dipping briefly below 50 in late 2015 but not signaling a deep US contraction), indicating the copper decline was geographically contained. US jobless claims stayed low. Traders who used US ISM data as a confirmation filter avoided the false signal entirely.
2019: The Trade War Distortion. Copper fell significantly in 2019 as US-China trade war tariffs created genuine demand uncertainty in global manufacturing supply chains. But the underlying demand did not collapse – it was disrupted and then rerouted. Again, no US recession followed. US consumer spending remained resilient throughout 2019.
The False Signal Filter – Three Questions to Ask:
First, is US ISM Manufacturing PMI also falling – specifically breaking below 50? If copper is falling but ISM is above 50, the signal is likely China-specific or trade-flow-specific, not a broad global recession precursor. Second, is AUD/USD falling in tandem with copper? AUD/USD confirmation strengthens the signal; AUD/USD holding steady while copper falls weakens it. Third, is US weekly jobless claims data stable? Rising jobless claims alongside copper decline create the most reliable recession signal combination. All three confirming together: act decisively. Copper falling alone: watch but wait.
The Trading Playbook
Before: What to Watch for Early Warning
Monitor the London Metal Exchange copper three-month futures price weekly (available at lme.com). A sustained break below the 52-week low – held for more than two consecutive weeks – has historically been the confirmation threshold that distinguishes a genuine trend change from a temporary pullback. Single-session moves and two-week corrections in copper are noise. A sustained break below the prior year's low, held for fifteen or more trading days, is signal.
Track the AUD/USD exchange rate daily (available on any major forex platform or at rba.gov.au). AUD/USD is copper's real-time market proxy – the Australian dollar moves with copper because Australia's largest export is copper ore to China. When copper falls and AUD/USD confirms within one to two weeks, the signal is global, not local. When copper falls and AUD/USD holds, the signal is likely demand-specific to a particular sector or geography.
Watch China's National Bureau of Statistics monthly fixed asset investment data (released monthly, approximately 15th of each month, available at stats.gov.cn in English). China represents approximately 55% of global copper demand, and construction represents the single largest use category within that demand. Falling fixed asset investment – specifically the real estate development sub-component – is the most reliable China-side confirmation that a copper fall is demand-driven rather than speculative.
During: Positioning When Copper Is Breaking Down
Sell or underweight XLB immediately when the LME three-month copper price breaks to a new 52-week low and holds for two weeks. XLB is the most direct expression of the copper decline within standard sector ETFs, and its underperformance relative to SPY is historically both reliable and fast-moving. Size the underweight relative to the confirmation strength – all three filters confirming warrants a larger underweight than copper alone confirming.
Rotate from XLI into XLU within your industrial and utilities allocation, sized for a six to nine month horizon rather than a quarter trade. This is the core cyclical-to-defensive rotation the copper signal historically precedes. XLI overweight versus benchmark becomes an XLU overweight as the recession thesis builds. Use XLI relative strength as your exit signal – when XLI stops making new relative lows, the rotation is maturing.
Add XLP on any broad market weakness in the first month after the copper breakdown confirmation. XLP defensive demand resilience is the most consistent relative outperformer in genuine copper-signalled recessions, and the entry is best made into weakness rather than on a recovery bounce. Historically, XLP's outperformance relative to SPY begins within two to three months of a confirmed copper breakdown – buying on broad market down days gives you better entry than chasing on days when defensive rotation is visible to everyone.
After: Reading the Recovery Signal
Watch copper for three consecutive weekly gains above the prior breakdown level as the recovery confirmation signal. Copper recovering above its breakdown level – particularly when accompanied by AUD/USD strengthening and China PMI rebound – signals the recession thesis is resolving and cyclical re-entry is appropriate. Begin rebuilding XLB and XLI exposure on that signal, sized smaller than the original defensive rotation and with a two-quarter time horizon.
Monitor XLB relative performance as the lead recovery indicator – it historically begins outperforming two to three months before broad equity recovery is visible, mirroring its role as a leading indicator on the downside. First XLB recovery, then XLI, then XLY – the recovery rotation sequence mirrors the decline sequence in reverse order.
Exit XLU and XLP relative overweights when the 10-year Treasury yield begins rising consistently – the sign that recession fears are easing and the bond market is reflecting a growth recovery. Rising yields compress XLU bond-proxy valuation and reduce XLP's defensive premium. The exit trigger is a sustained two-week rise in the 10-year yield above a meaningful prior high, not a single-day move.
The 3 Mistakes Most Retail Traders Make
Mistake 1: Acting on Copper Alone Without Confirmation
The most common mistake is treating every copper decline as a recession signal requiring immediate defensive rotation. Copper falls for multiple reasons – China-specific demand shifts, speculative positioning unwinds, currency moves – most of which do not predict a US or global recession. The trader who sells XLI and buys XLU every time copper drops 10% will have three false signals for every genuine one. The institutional approach is to require confirmation from at least two of the three filters: ISM Manufacturing PMI below 50, AUD/USD weakness, and rising US jobless claims. Acting on copper alone without confirmation is guessing; acting with two or three confirmations is edge.
Mistake 2: Confusing the Signal Timing With the Trade Timing
The second mistake is knowing that copper leads by six to nine months and then waiting six to nine months to act. The lead time is how far ahead of official confirmation copper signals – it is not a holding period instruction. The correct trade is to act on the copper signal immediately when confirmed, position for the two to three quarter underperformance in cyclicals, and use the subsequent official economic data releases as confirmation that the signal was real – not as the trigger to enter. By the time the official recession call is made, the defensive rotation trade is largely complete.
Mistake 3: Ignoring the China Demand Disaggregation
The third mistake is treating Chinese copper demand as monolithic. China uses copper for construction (approximately 40% of its copper demand), infrastructure (25%), industrial machinery (20%), and consumer electronics (15%). A copper fall driven by Chinese real estate construction collapse has different US sector implications than a copper fall driven by Chinese industrial machinery slowdown. The real estate-driven collapse eventually transmits to global commodity markets broadly – steel, iron ore, lumber all confirm. The industrial machinery slowdown is more contained. Checking whether iron ore and steel prices are also falling alongside copper tells you whether the signal is broad construction demand or narrower industrial – and that distinction determines whether you rotate defensively across all cyclical sectors or focus the underweight specifically on XLB and XLI capital goods.
Bottom Line: The One-Sentence Institutional Framework
When copper breaks its 52-week low and holds for two weeks, confirmed by AUD/USD weakness and ISM Manufacturing PMI below 50, sell XLB immediately, rotate from XLI to XLU over one quarter, add XLP into weakness, and use copper's recovery above the breakdown level as your signal to reverse the entire rotation.
This framework works across cycles because copper's leading indicator status is structural, not coincidental. The companies that order copper are ordering based on their forward project pipelines – which makes the copper market a real-time window into the economic order book that no official data release can replicate. That window opens six to nine months before the consensus catches up. Every time the window opens and the confirmation filters align, the same rotation sequence plays out – because the same underlying economic mechanics are operating.
The retail edge is not faster access to copper price data. It is the discipline to wait for confirmation before acting, the patience to hold defensive rotations for the full six to nine month transmission window, and the framework to distinguish a genuine global recession signal from a China-specific demand story that the confirmation filters reliably separate.
Run this scenario through the [Breakout Bulletin Ripple Engine](LINK: Ripple Engine Tool) to see the full sector transmission map, compare the lead/lag timing across all twelve sectors, and visualise how the copper recession signal differs from a standard demand shock in its sequencing and magnitude.
FAQ: Copper Prices Fall and Recession Signals
Why is copper called Dr. Copper?
Copper is called “Dr. Copper” because its price movements often predict economic slowdowns and recoveries before official economic data confirms them.
What happens when copper prices fall sharply?
When copper prices fall sharply, it often signals weakening industrial demand, slowing manufacturing activity, and rising recession risk across the global economy.
Why are copper prices considered a leading indicator?
Copper is used in construction, manufacturing, infrastructure, electronics, and transportation. Falling demand for copper often appears before weakness shows up in earnings reports, employment data, or GDP numbers.
Which sectors are hurt most when copper prices fall?
Materials (XLB), Industrials (XLI), Energy (XLE), Financials (XLF), and cyclical sectors usually underperform first because copper weakness signals slowing economic activity.
Which sectors typically outperform during a copper recession signal?
Defensive sectors like Consumer Staples (XLP), Utilities (XLU), and Healthcare (XLV) often outperform when copper signals a recession or industrial slowdown.
How does AUD/USD confirm copper signals?
Australia is one of the world’s largest commodity exporters. When copper prices fall and AUD/USD weakens simultaneously, it strengthens the recession or global demand slowdown signal.
Can copper give false recession signals?
Yes. Copper can fall because of China-specific construction slowdowns, trade wars, or temporary industrial disruptions without triggering a global recession. Confirmation from ISM PMI, AUD/USD, and jobless claims is important.
What is the typical sector rotation during a copper breakdown?
The usual sequence starts with weakness in Materials (XLB) and Industrials (XLI), followed by Financials (XLF) and Consumer Discretionary (XLY), while defensive sectors like XLU and XLP outperform later.
This post is part of the BreakoutBulletin "What Happens When" series. [LINK: Metals Hub] · [LINK: Series Pillar Page]
Educational content only. Not investment advice. Past sector performance patterns do not guarantee future results.