
Most traders exit too early in Wave 3 and hold too long in Wave 5, relying on price alone while ignoring the only signals that consistently reveal whether a trend is strengthening or exhausting.
Elliott Wave structure tells you where you are in the sequence, but momentum and volume tell you whether that structure is still valid or already failing. The combination of these elements is what separates high-probability setups from trades that only look correct in hindsight.
Why Divergence Matters in Elliott Wave Analysis
Divergence occurs when price makes a new extreme while a momentum indicator fails to confirm that move. In isolation, divergence is a warning signal; within Elliott Wave structure, it becomes a timing tool, particularly at known exhaustion points in the sequence.
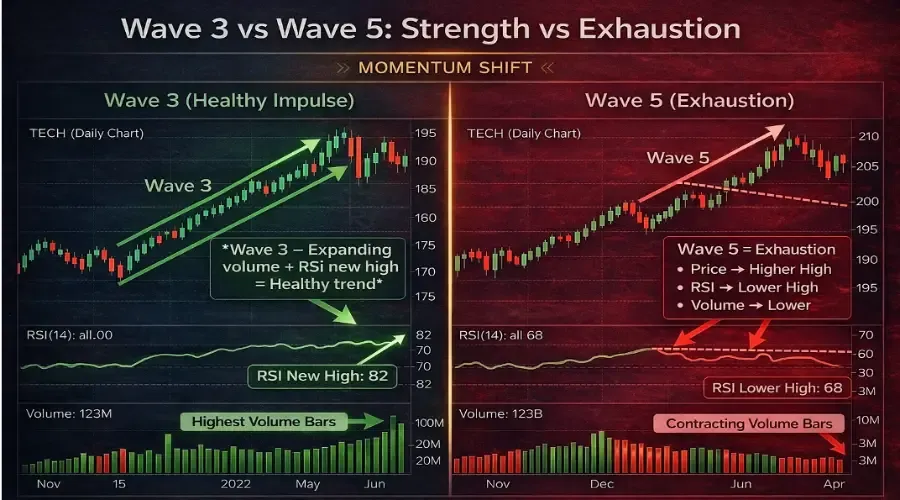
The most reliable signal appears at Wave 5, where price typically makes a marginal new high above Wave 3, but RSI or MACD fails to match the momentum peak established earlier. This mismatch reflects a loss of participation and marks the transition from trend continuation to trend exhaustion.
A completed five-wave structure combined with momentum divergence is not a suggestion — it is a statistically meaningful reversal signal.
To understand the structure behind these signals: Elliott Wave Motive Wave Strategy (Wave 3 Guide)
The Wave 5 Exhaustion Signal
At the end of a mature trend, three elements tend to align: price extends, momentum weakens, and participation declines. This creates what can be described as a triple divergence condition, where each layer of confirmation points toward exhaustion.
Wave 5 Terminal Signature
- Price makes a higher high relative to Wave 3
- RSI forms a lower high compared to the Wave 3 peak
- MACD histogram shows declining peaks across multiple bars
- Volume contracts relative to Wave 3
When these conditions align, the market is no longer advancing on strength, but on diminishing participation.
To validate whether this structure is correct: Elliott Wave Rules vs Guidelines
Wave-by-Wave Momentum Signature
Each wave in an impulse sequence carries a distinct momentum profile, and recognizing these patterns allows you to confirm structure in real time rather than relying on hindsight labeling.
Wave 1
Momentum emerges from oversold conditions, often with RSI recovering from below 40. MACD begins to shift direction, and volume expands modestly as early participants enter while the broader market remains skeptical.
Wave 2
Momentum declines as price corrects, but RSI typically holds above prior oversold levels, indicating that the move is corrective rather than a full reversal. Volume contracts, reflecting reduced participation in the pullback.
Wave 3
This is the strongest phase of the trend. RSI pushes above 70, MACD histogram expands aggressively, and volume reaches its highest level in the sequence.
If these characteristics are absent, the wave count should be questioned.
Critical warning: If divergence appears while labeling a Wave 3, the count is likely incorrect — the structure is more consistent with a Wave 5 of a higher degree.
To understand how Wave 3 setups are traded: Wave 3 Entry Strategy (Entry, Stop, Target)
Wave 4
Momentum cools but remains constructive. RSI typically pulls back toward 50–60 without entering oversold territory. This distinguishes Wave 4 from a reversal and reflects controlled profit-taking rather than aggressive selling.
To understand how corrections form before continuation: Corrective Waves: Zigzag vs Flat Explained
Wave 5
Price extends to a new high, but momentum fails to confirm. RSI forms a lower high, MACD histogram weakens, and volume contracts.
This alignment signals that the trend is advancing on weakening internal strength.
If corrections become complex and misleading: X-Wave Trap: Double Three (WXY) Strategy
RSI Settings for Wave Analysis
Standard RSI(14) remains effective across most timeframes, but adjustments can improve sensitivity depending on the degree being analyzed.
Recommended Settings
- Lower timeframe (4-hour) → RSI(5) for faster signals
- Daily timeframe → RSI(14) for balanced analysis
- Weekly timeframe → RSI(14) or RSI(21) for smoother trends
Key levels remain consistent:
- 30 → Oversold (Wave 2 extremes)
- 50 → Support during Wave 4
- 70 → Wave 3 momentum confirmation
If RSI fails to reach 70 during a supposed Wave 3, the structure should be re-evaluated.
MACD as a Confirmation Tool
MACD provides a second layer of confirmation by measuring momentum expansion and contraction over time.
- Histogram expansion typically aligns with Wave 3
- Lower histogram peaks during rising price indicate weakening momentum
- Multiple declining histogram bars during Wave 5 increase reliability of divergence
Practical rule: For a valid Wave 5 exit signal, require at least three consecutive histogram bars showing lower highs while price continues to rise.
Volume Patterns by Wave Position
Volume behavior provides an independent confirmation of wave structure and often reveals weakness before price reacts.
Volume Profile
- Wave 1 → Moderate expansion from lows
- Wave 2 → Contraction, indicating limited selling pressure
- Wave 3 → Peak volume across the sequence
- Wave 4 → Controlled contraction
- Wave 5 → Noticeable decline in volume despite higher prices
A rising price with declining volume is not strength - it is a warning signal that participation is fading.
To project where these waves are likely to end: Fibonacci Targets for Wave 3, 4 & 5
Hidden Divergence: The Wave 4 Continuation Signal
While regular divergence signals exhaustion, hidden divergence signals continuation.
Hidden bullish divergence occurs when price forms a higher low while RSI forms a lower low. This typically appears at the end of Wave 4 and signals that the correction is complete and the trend is likely to resume into Wave 5.
Regular divergence = exit signal. Hidden divergence = continuation signal.
Practical Example: Wave 3 vs Wave 5 Behavior
CHART: Two-panel comparison showing Wave 3 with peak RSI and volume, and Wave 5 with higher price but lower RSI and declining volume
The contrast between these phases highlights the shift from expansion to exhaustion. In Wave 3, participation is broad and momentum confirms price. In Wave 5, price continues higher, but underlying strength deteriorates.
Divergence Confirmation Checklist
Wave 5 Terminal Checklist
- Price breaks above Wave 3 high
- RSI forms a lower high
- MACD histogram shows declining peaks
- Volume lower than Wave 3
- Five-wave structure is complete
Wave 3 Confirmation Checklist
- RSI above 70
- MACD histogram at highest reading
- Volume highest in sequence
- No divergence present
Wave 2 Validation
- RSI does not reach oversold below Wave 1 start
- Volume contracts during pullback
- Structure forms three waves
Wave 4 Continuation (Hidden Divergence)
- Price forms higher low
- RSI forms lower low
- Signals continuation into Wave 5
Key Takeaways
- Divergence is most powerful when aligned with Elliott Wave structure
- Wave 3 must show expanding momentum and volume
- Wave 5 typically shows divergence across RSI, MACD, and volume
- Hidden divergence confirms continuation during Wave 4
- Combining structure with confirmation tools improves decision quality
Next Step in the Framework
Now that you understand how to identify trend exhaustion and continuation using divergence, the next step is learning how to validate your wave structure before acting on these signals.