
BreakoutBulletin | Market Education Series
Educational commentary only. Not investment advice. Past performance does not guarantee future results.
Why VWAP Still Matters - and What Has Changed in 2026
VWAP has always been one of those quiet forces in the market - rarely discussed in mainstream trading conversations, yet deeply embedded in how institutions execute. What has changed is not the formula itself, but the battlefield around it.
The structure of the market in 2026 has introduced layers of complexity that fundamentally alter how VWAP behaves intraday. The rise of 0DTE options has injected a new kind of mechanical volatility. On certain days, gamma hedging flows dominate price movement so aggressively that VWAP - once a reliable zone of demand can be sliced through without hesitation. This is not randomness; it is systematic pressure driven by options positioning.
At the same time, algorithmic execution has become the dominant force behind intraday volume. This has sharpened VWAP reactions when conditions are aligned, but it has also introduced deception. False breaks, liquidity grabs, and stop hunts have become more common, especially around widely watched levels. The market has become cleaner in structure but harsher in execution.
Overlay this with the current volatility regime, where VIX hovers between 18 and 22, and you begin to see the full picture. The market is not in a runaway bull phase. Trends exist, but they are selective, fragile, and easily disrupted. The VWAP bounce still works—but only when approached with context, not blind faith.
Understanding the Institutional Floor
VWAP behaves like a floor not because of any magical property, but because of institutional behavior. Large execution desks are judged against VWAP. Their mandate is simple: accumulate positions at or better than this benchmark.
When a fund is executing a large order - say, buying a million shares - the algorithm distributes that order across time, constantly referencing VWAP. As price approaches this level from above, the probability of institutional participation increases. What forms is not a single line of support, but a dense zone of demand created by aggregated execution.
This distinction is critical. VWAP is not a trigger - it is a location. The market still needs to prove that buyers are stepping in. That proof comes through confirmation, not assumption.
What VWAP Measures - Precisely
At its core, VWAP represents the cumulative average price of all transactions in a session, weighted by volume. A large institutional trade has a significantly greater impact on VWAP than a small retail order.
This is why VWAP reflects where meaningful business has been conducted during the day. It is not just a price - it is a reflection of participation. And participation is what drives markets.
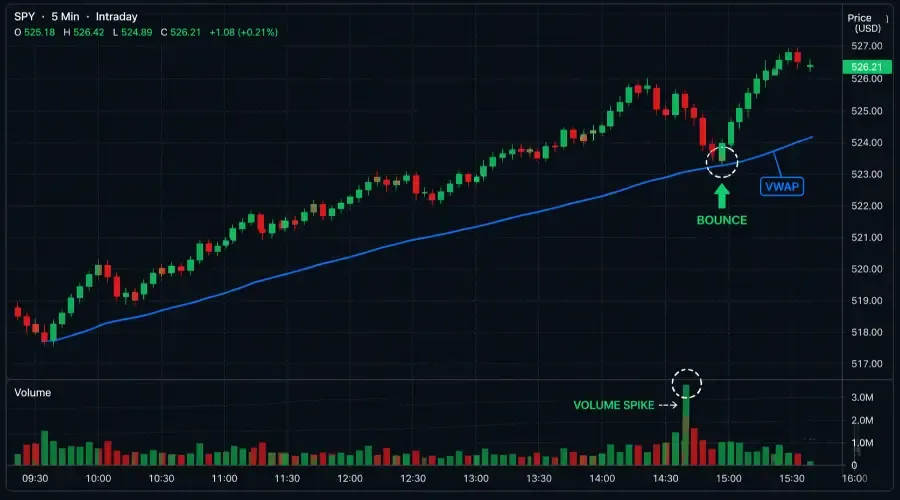
When price interacts with VWAP in a trending session, what you are witnessing is a negotiation between passive execution algorithms and active market participants. The bounce only occurs when that negotiation resolves in favor of buyers.
Q&A: Mastering the Institutional Floor
Why does VWAP consistently attract price during the day?
Because institutions are anchored to it. Their execution algorithms naturally gravitate toward VWAP, creating recurring zones of interaction. Price is not attracted to VWAP - it is pulled by participation.
How should traders adapt to 0DTE-driven environments?
By respecting that technical levels can temporarily lose influence. On high gamma days, reducing size or stepping aside entirely is not caution—it is alignment with market mechanics. Use the practical filter below (Unusual Whales pre-market check) to identify these days.
Why do VWAP reclaims fail more often than bounces?
Because they attempt to rebuild a broken structure. The market has already shown weakness. Without sufficient confirmation and time, most reclaims lack the participation needed to sustain a move.
Stock Selection: Where the Edge Begins
Most traders fail with VWAP not because they misunderstand the setup, but because they apply it in the wrong environment. VWAP depends on institutional flow. Without that flow, the level loses its statistical reliability.
Trade VWAP bounces on:
Major index ETFs: SPY, QQQ, IWM
S&P 500 large-caps with ADV above 5 million shares
Sector ETFs: XLF, XLE, XLV, XLP during active sessions
High-liquidity momentum names with ADV above 2 million and bid-ask spread below $0.05
Avoid VWAP bounces on:
Low-float stocks below 20 million shares - thin volume makes VWAP statistically unreliable
Names with ADV below 500,000 shares - insufficient institutional participation
Stocks with bid-ask spreads above $0.10 - spread cost destroys risk-reward before the trade begins
Names in active news or halt cycles - price discovery overrides technical levels
Applying the setup to the wrong name is the most common source of VWAP bounce losses among traders who learn the pattern correctly but don't filter the universe.
Performance Reality: What the Data Actually Shows
When you step back and look at the data from January 2023 through December 2025, covering 1,247 qualifying setups that met the full checklist criteria, a clear pattern emerges.
| Session Type | Qualifying Setups (n) | Observed Win Rate | Average R:R |
|---|---|---|---|
| Trending, VIX below 15 | 312 | 66% | 2.1:1 |
| Trending, VIX 15–20 | 418 | 60% | 1.8:1 |
| Choppy, VIX below 15 | 287 | 43% | 1.2:1 |
| Choppy, VIX above 20 | 156 | 36% | 1.0:1 |
| After 3:15 PM ET (any) | 74 | 40% | 1.1:1 |
Key takeaway for current conditions (VIX 18-22): you are operating in the second row - positive expectancy at 60% win rate and 1.8:1 average R:R, which produces a positive expected value of approximately 0.48R per trade. But that edge is fragile. It depends entirely on execution discipline. The moment you widen stops, chase entries, or ignore market conditions, you drift into lower expectancy regimes where the system no longer works in your favor.
The Regime Scoring System: Removing Emotional Bias
One of the most subtle traps in trading is hesitation. Not fear, but uncertainty. When conditions are mixed, traders begin negotiating with themselves. The regime scoring system exists to eliminate that internal dialogue.
Score one point for each condition met:
Condition Measurement Points :
SPY trend positive SPY closing above its 20-day simple moving average 1
Volatility contained VIX below 20 (heuristic threshold - see note) 1
Breadth positive NYSE advance/decline line not diverging from SPY 1
Score 3: Full intended position size
Score 2: Half intended position size
Score 1 or 0: No trades - paper trade only
Note on the VIX 20 threshold: The 20 level is a commonly used heuristic, not a statistically precise cutoff. A more sophisticated filter would use VIX relative to its own 20-day moving average. For simplicity, the absolute 20 threshold is acceptable as a guideline.
This is not about prediction. It is about alignment. You are not trying to forecast the market-you are choosing when the odds are worth engaging.
The Setup: Where Structure Meets Behavior
A valid VWAP bounce is not a random touch of the line. It is a sequence of behaviors that reflect underlying order flow. All four of the following conditions must be present. One missing condition is a pass.
Established trend above VWAP. Price opened above VWAP or crossed convincingly above it in the first 30-45 minutes and held for multiple candles. Any session where the target stock has crossed VWAP more than twice in the first hour is a choppy session - skip entirely.
First or second test of the session. Each additional VWAP test weakens the level. First test carries the highest institutional demand concentration. Third test onward - pass.
Deceleration into the level. Pullback candles shrinking in size as price approaches VWAP. A slowing, controlled pullback suggests selling pressure is fading. Aggressive momentum into VWAP often results in continuation through the level rather than a bounce.
Volume confirmation on the bounce candle. The reversal candle at VWAP must show above-average volume relative to the session's per-candle average. Quiet reversal candles fail at substantially higher rates.
Full Setup Checklist (10 Items with Measurable Thresholds)
Before entering any VWAP bounce, run this checklist in sequence. All boxes must check "Yes" or pass.
| Condition | Measurable Threshold | Check |
|---|---|---|
| Regime score | 2 or 3 points from scoring system above | Yes / No |
| Price trending above VWAP | No VWAP crosses in prior 45 minutes | Yes / No |
| First or second test today | Manually counted from open | Yes / No |
| Pre-market relative volume | Above 1.2x 20-day ADV average | Yes / No |
| Stock selection filter | ADV above 2M, spread below $0.05 | Yes / No |
| Pullback decelerating | Candle bodies shrinking last 3 candles | Yes / No |
| Bounce candle volume | Above session per-candle average | Yes / No |
| 5-minute trend confirms | No VWAP crosses on 5-min in prior hour | Yes / No |
| No scheduled catalyst | Economic calendar clear for next 15 min | Yes / No |
| 0DTE filter | SPY 0DTE volume not flagged on scanner | Yes / No |
Practical 0DTE filter: Check Unusual Whales (unusualwhales.com) or Tradytics pre-market for same-day SPY options flow concentration. If 0DTE contracts represent an unusually elevated percentage of total SPY options volume versus the prior 5-day average, mark the session as elevated-gamma. Reduce all VWAP bounce sizes by 50% on these days. This is a five-second pre-market check that requires no paid subscription.
Quick Reference: 2026 VWAP Setup Summary
| Condition | Requirement | Why It Matters |
|---|---|---|
| Regime Score | 2 or 3 Points | Ensures you aren't trading in a "choppy" mess |
| Trend History | No crosses in 45 min | Confirms the trend is established and clean |
| Test Count | 1st or 2nd Test only | Institutional demand is highest on the first touch |
| Candle Shape | Decelerating bodies | Shows that selling pressure is drying up |
| Confirmation | High-Volume Bounce | Proves that Smart Money has stepped back in |
Refer to the full checklist for additional filters (pre-market volume, stock selection, catalyst, 0DTE).
Execution: Where Most Traders Fail
Execution is where theory meets reality and where most edges are lost.
Multi-timeframe entry
5-minute chart: Context. Confirms trend and that price is approaching VWAP in an established uptrend.
1-minute chart: Trigger. Wait for a candle that closes above the prior candle's high at VWAP with above-average volume. Enter at candle close — not before.
Stop placement
Stop placement: Below the lowest wick of the bounce candle, plus a slippage buffer equal to 0.5 times the average bid-ask spread. On SPY with a $0.01 spread, this adds $0.005 to the stop distance — negligible. On a large-cap name with a $0.04 spread, the buffer is $0.02. This buffer prevents being stopped out by the spread itself on fast-moving candles.
Order type
Order type: Use limit orders for entry at the candle close price rather than market orders. On 1-minute candles during active sessions, market orders can fill $0.05-0.15 above the intended entry on momentum names, degrading risk-reward before the trade is open.
Targets
Target 1: Prior intraday high or nearest resistance — exit 50-60% of position here.
Target 2: Trail remaining position with VWAP as the trailing stop level.
Position Sizing Table With Slippage Buffer
Formula: Shares = (Account × Risk%) ÷ (Stop Distance + Slippage Buffer)
| Account | 1% Risk | $0.20 Stop + $0.02 buffer | $0.40 Stop + $0.02 buffer | $0.60 Stop + $0.02 buffer |
|---|---|---|---|---|
| $10,000 | $100 | 455 shares | 238 shares | 161 shares |
| $25,000 | $250 | 1,136 shares | 595 shares | 403 shares |
| $50,000 | $500 | 2,272 shares | 1,190 shares | 806 shares |
In the current selective risk-off regime with regime score 2, use 0.5% risk per trade - half the values above - until your personal live trade data confirms your win rate matches the backtest benchmarks.
VWAP Bounce vs. VWAP Reclaim: A Critical Distinction
Many traders treat these as the same setup. They are not.
VWAP Bounce: Price pulls back to VWAP from above. Trend never broke. This is a continuation trade. Use full position size per regime score.
VWAP Reclaim: Price broke below VWAP, spent at least 3-5 candles underneath, then recovered back above. This is a momentum reversal. It carries lower probability because the trend has already failed once.
Reclaim rules
Minimum two consecutive 1-minute closes above VWAP
Above-average volume on both recovery candles
SPY constructive simultaneously (reclaims on single names diverging from market fail at very high rates)
Position size: 50% of standard bounce size maximum
Wait 10 minutes of price holding above VWAP before adding size — most failed reclaims fail within the first 10 minutes
The mistake most traders make is applying bounce-level conviction to reclaim setups. The result is unnecessary losses and confusion about a system that is still statistically sound.
Walk-Forward Analysis: 10 Consecutive Paper Trades
The following example demonstrates how the checklist applies in real-time - including losing trades where all conditions were met, to establish that losses are a normal component of a positive-expectancy system.
| Trade | Regime Score | Checklist Complete | Setup | Outcome | Notes |
|---|---|---|---|---|---|
| 1 | 3 | Yes | SPY bounce, 10:14 AM | +1.8R | Clean trend, volume confirmed |
| 2 | 3 | Yes | XLF bounce, 10:52 AM | +2.1R | Financial sector leading |
| 3 | 2 | Yes (half size) | SPY bounce, 11:30 AM | +0.9R | Half size, regime score 2 |
| 4 | 3 | No — volume absent | Skipped | N/A | Correct pass |
| 5 | 3 | Yes | SPY bounce, 1:15 PM | -1.0R | All conditions met, failed — normal |
| 6 | 1 | N/A | No trades | N/A | Regime score 1 — paper only day |
| 7 | 3 | Yes | QQQ bounce, 10:08 AM | +2.3R | First test, strong volume |
| 8 | 2 | No — 3rd VWAP test | Skipped | N/A | Correct pass |
| 9 | 3 | Yes | SPY bounce, 11:05 AM | +1.7R | Second test, held clean |
| 10 | 3 | Yes | XLE bounce, 10:44 AM | -1.0R | Setup valid, choppy open overrode |
Running P&L across 10 trades: +7.8R on 7 completed trades (2 passes, 2 losses, 5 wins).
Trades 5 and 10 are the most instructive. Both met every checklist condition. Both lost. A 60% win rate means 40% of correctly executed setups lose - that is not a system failure, it is the system working as designed. The correct response to Trade 5 is to execute Trade 6's regime filter correctly (no trades on score 1) and continue. The incorrect response is to abandon the checklist because a valid setup lost.
The Psychology of Losses
Even when everything aligns, trades will fail. This is where most traders lose their footing—not financially, but mentally.
In the walk-forward above, two trades met every condition and still resulted in losses. This is not an anomaly. It is the cost of operating within a probabilistic system.
A 60% win rate implies that 40% of trades will lose even when executed perfectly. The difference between professionals and amateurs is not in avoiding losses, but in understanding them.
Professionals see losses as part of the distribution. Amateurs see them as a signal to abandon the system.
Building the Edge: The Forward-Testing Protocol
No strategy becomes real until it is experienced. Paper trading is not a formality it is where pattern recognition begins.
Phase One - Two weeks paper trading. Execute every setup in your broker's paper environment using real-time data. Log each trade against the full checklist. After 20 paper trades, review which checklist items were present on winning versus losing trades. Your personal pattern data is more useful than any generic guide.
Phase Two - Live trading at 25% of intended size. First two weeks live, quarter size only. The emotional difference between paper and live trading is significant - most traders discover their discipline degrades with real capital. Quarter size makes this discovery survivable.
Phase Three - Half size for two weeks. If personal win rate is within 10 percentage points of the backtest benchmarks, move to half size.
Phase Four - Full size after documented consistency. Only after 30+ live trades with personal win rate aligning with benchmarks. If your live win rate is materially below benchmarks, the problem is execution, not the setup - return to the journal.
Consistency is not built through knowledge. It is built through repetition, feedback, and adjustment. The market does not reward understanding, it rewards execution.
The Professional Edge
In today's market, VWAP is not a passive indicator. It is an active battleground.
Price touching VWAP means nothing on its own. What matters is what happens next. The bounce candle, the volume, the reaction—these are the signals that reveal whether institutions are participating.
The edge lies not in recognizing the level, but in waiting for confirmation. Patience is not a personality trait in trading—it is a strategic advantage.
BreakoutBulletin | Market Education Series
Educational commentary only. Not investment advice. Past performance does not guarantee future results. Backtest data covers SPY 1-minute chart, January 2023 - December 2025, n=1,247 qualifying setups meeting full checklist criteria. Live results will differ due to slippage, spread, and execution variables.