
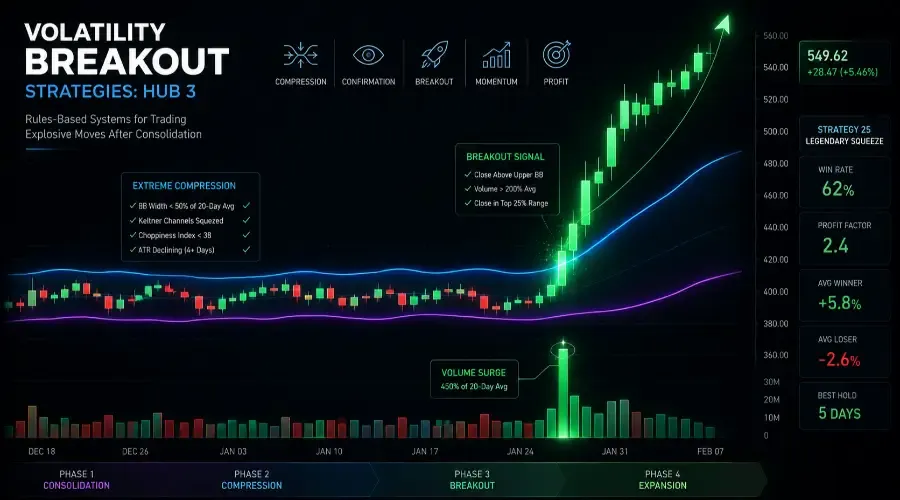
6 Rules-Based Systems for Trading Explosive Moves After Consolidation
The stock that's been sleeping for three weeks is the one that will wake up violently. When a stock trades in a tight range, volume drying up, Bollinger Bands squeezing inward, it's not dead–it's coiling. Institutional participants are quietly accumulating or distributing within that narrow band, and when they finish building their position, the move out of that consolidation is sudden, large, and tradable. The trick isn't catching every breakout–it's catching the ones that have the structural compression that makes explosive moves mathematically probable. This hub gives you the rules to identify those setups and the discipline to execute them.
In this guide, we fully detail our highest-probability volatility breakout strategy–Legendary Squeeze (Strategy 25)–with complete entry rules, a copy-pasteable checklist, real trade examples, and a backtest summary with year-by-year and condition-based breakdowns. The other 5 strategies are summarized with their key stats so you know the full landscape, but if you start anywhere in this hub, start with the dual squeeze.
DISCLAIMER: BACKTEST METHODOLOGY
All win rates and profit factors in this guide come from hypothetical backtests on S&P 500 stocks, 2020-2024, pre-commission and pre-slippage, measured during consolidation phases (Bollinger Band width below 50% of the 20-day average).
Critical adjustments for live trading:
-
Commissions and slippage reduce actual results by 6-13% per round-trip (higher than trend following due to wider spreads on volatile stocks; extremely volatile names like NVDA can approach the upper bound)
-
A backtest showing 62% win rate should be expected to produce 58-61% in live conditions
-
A backtest showing 2.4 profit factor should be expected to produce 2.0-2.3 in live conditions
-
Win rates in already-high-volatility markets (Bollinger Bands wide, no compression) drop to 35-50%
-
Gap-through stop risk is elevated compared to trend following: position sizing at 1% is non-negotiable
-
Past performance does not guarantee future results
Full backtest methodology, sample sizes, and walk-forward analysis are in each individual strategy's dedicated guide.
Volume standard for this hub: A reading of 200%+ relative to the 20-day average is the required threshold on the breakout candle. 150%+ is the minimum for day-two volume confirmation. Below 200% on the breakout candle, the setup does not qualify regardless of how clean the squeeze appears. Volume is the primary filter that separates genuine institutional breakouts from retail fakeouts.
WHAT THIS GUIDE COVERS
This hub covers 6 volatility breakout systems. Strategy 25 (Legendary Squeeze) is fully detailed here with complete entry rules, a copy-pasteable checklist, real trade examples, and a backtest summary with year-by-year breakdown. The remaining 5 strategies are introduced with their indicator combinations, win rates, and tier classifications. Full breakdowns for each (including complete backtest methodology, walk-forward analysis, and live trading examples) are in their individual strategy guides.
WHAT VOLATILITY BREAKOUT STRATEGIES DO
Volatility breakout strategies buy when price exits a tight consolidation range on significantly above-average volume. The setup has three sequential phases that must all occur in order: compression, confirmation, and entry on expansion.
The compression phase is what separates this hub from standard breakout trading. A stock breaking above resistance without prior compression carries a historical win rate of approximately 45% in backtesting. The same breakout occurring after a Bollinger Band squeeze (width below 50% of the 20-day average) carries a win rate of 62-64%. The squeeze is the filter that makes the difference.
The entry type is Breakout + Momentum (covered in full in Pillar 2). The breakout component is the close outside the Bollinger Band upper boundary. The momentum component is the volume and volatility expansion confirmation that the breakout has genuine institutional participation.
This hub produces the largest average winners in the catalog ($18-20 per share versus $16 for trend following) and the highest peak profit factor (2.4 on Strategy 25). The tradeoff is a lower baseline win rate than Hub 2 (57% hub average versus 60%), elevated slippage costs, and the requirement for precise timing – entries more than 2 days after the breakout candle produce materially lower win rates as momentum fades.
PART 1: HOW VOLATILITY BREAKOUT SETUPS FORM
The Four-Phase Structure
Phase 1: Consolidation
Price ranges between a defined support and resistance level for 10-20 days. The range is narrow: typically 3-8% wide. Volume decreases throughout the consolidation period. Bollinger Bands visibly squeeze inward as the price range narrows.
This phase is not a flaw in the stock's price action: it's the condition that makes the subsequent breakout valuable. During consolidation, institutional participants are either accumulating (for an upward breakout) or distributing (for a downward breakout) within the range. When they finish building their position, the move out of consolidation is sudden and large.
Phase 2: Extreme compression confirmation
Before entering any setup, confirm that the compression is statistically extreme, not merely ordinary:
-
Bollinger Band width below 50% of the 20-day average width
-
Keltner Channels also compressed inward (dual squeeze)
-
Choppiness Index below 38 (very low volatility reading)
-
ATR declining for 4 or more consecutive days
The dual squeeze condition (both Bollinger Bands and Keltner Channels compressed simultaneously) is the most selective filter. It appears in fewer setups but produces the highest win rates in backtesting. Strategy 25 requires this dual confirmation.
Phase 3: Breakout signal
Price closes outside the upper or lower Bollinger Band on a single day with the following characteristics:
-
Volume above 200% of the 20-day average
-
Candle closes in the top 25% of its range (for upside breakout)
-
Candle body is large relative to prior sessions
The volume threshold on the breakout candle is non-negotiable. Breakouts on volume below 200% of average fail at a rate that makes the setup unprofitable regardless of how clean the squeeze appears.
Phase 4: Expansion confirmation and entry
The breakout candle alone is not sufficient for entry. Wait one additional session to confirm:
-
Bollinger Band width expanding (above 1.5× the compression-phase width)
-
Keltner Channels widening outward
-
Volume on day two above 150% of the 20-day average
-
Price continuing in the breakout direction
Entry execution: close of the expansion confirmation candle or the following morning's market-on-open order. All backtested results for Strategy 25 are based on the market-on-open method. The close-of-candle variant produces a ±1-2% variation in win rate depending on the stock's gap frequency. The market-on-open approach avoids intraday execution complexity and ensures the R:R is based on a known price.
Why This Works: The Mechanics
Compression forces expansion. Bollinger Bands measure standard deviation of price around a moving average. When the standard deviation of price shrinks to an extreme low, it cannot remain there indefinitely: the price distribution always reverts to a wider state. The timing of the expansion is not predictable, but the direction (expansion from compression) is structurally certain. The squeeze identifies when the stock is near its minimum volatility; the breakout identifies when the expansion has begun.
Volume distinguishes institutional from retail breakouts. A stock breaking above resistance on 120% average volume is driven primarily by retail order flow: small, easily absorbed, and frequently reversed within one or two sessions. A stock breaking above resistance on 300%+ average volume indicates institutional participation: large order blocks executing simultaneously, which sustains the directional move for multiple sessions. The 200% volume threshold filters for the latter.
The dual squeeze produces a compressed spring effect. When both Bollinger Bands and Keltner Channels are simultaneously at their narrowest readings, two independent volatility measures have reached extreme compression together. Historically, these dual-squeeze conditions precede the largest and fastest breakout moves in backtesting, because the energy released from two compressed volatility bands simultaneously is greater than either alone.
Large winners compensate for lower win rate. At a 57% average hub win rate with an average winner of $18-20 and an average loser of $7-8, the profit factor across the 6 strategies remains competitive despite the lower win rate. The math: (57 wins × $18) − (43 losses × $7.50) = $1,026 − $323 = $703 per 100 trades. Comparable to Hub 2's $720 per 100 trades, with fewer but larger individual outcomes.
PART 2: MARKET CONDITIONS
Identifying the Right Regime Objectively
Volatility breakout strategies are condition-specific – they require a consolidation phase to exist before any setup can form. Unlike trend following (which operates continuously in trending markets), Hub 3 strategies are inactive when stocks are either trending strongly or in chaotic high-volatility conditions.
Hub 3 is active when:
-
A specific stock (not necessarily the broader market) has been consolidating for 10-20 days
-
Bollinger Band width on that stock is below 50% of its 20-day average width
-
The Choppiness Index on that stock is below 38
-
The broader market (SPY) is not in extreme volatility (VIX below 25)
Hub 3 is inappropriate when:
-
Bollinger Bands are already wide (no compression to break from)
-
VIX is above 25 (broad market volatility inflates spreads and gap risk)
-
The stock has an earnings announcement within 3 days
-
The stock has already broken out and is in day 3 or later of the expansion (momentum is fading)
Regime note: Unlike Hub 2, Hub 3 does not require a bull market. Volatility breakouts can fire in any direction – upside breakouts in bull markets and downside breakouts in bear markets. The strategies in this hub are written for long (buy) setups. Short versions of the same setups apply in bear markets but are not covered in this guide.
Where It Works
After post-earnings consolidation. Stocks frequently consolidate for 10-20 days after an earnings event as the new information is digested. The subsequent breakout on sector rotation or broader market momentum often produces the cleanest setups in this hub.
During sector quiet periods. When a sector has been out of the news cycle for 2-3 weeks, individual stocks within it tend to narrow into tight ranges. The next catalyst for that sector (an industry report, a bellwether earnings, a regulatory decision) then triggers simultaneous breakouts across multiple stocks.
After extended low-volatility market periods. When VIX has been below 15 for 2+ weeks, individual stock volatility also compresses. The subsequent market event that breaks the VIX higher creates a wave of stock-level breakouts.
Where It Fails
Already-high-volatility markets. When Bollinger Bands are already wide, there's no compression to break from. Buying a stock already in an expanded volatility state produces win rates of 35-45%.
Low-volume breakouts. Volume below 200% on the breakout candle indicates retail participation only. Retail-driven breakouts reverse within 1-2 sessions at a rate that makes the setup unprofitable. This is the single most important filter in this hub.
Earnings-adjacent setups. A squeeze that forms in the days before an earnings announcement is not a technical squeeze: it's the market pricing in the event risk. The "breakout" is driven by the earnings result, not by institutional breakout buying. Skip any setup where earnings fall within 3 days of the planned entry.
Late entries. Breakout momentum in this hub is concentrated in the first 2 days after the breakout candle. Volume elevation drops from 200-300% on day one to 120-150% by day three, and the probability of continuation declines proportionally. If the entry is missed within 2 days of the breakout, wait for the next setup.
PART 3: THE 6 STRATEGIES
All 6 systems share the same compression-breakout-expansion structure. The volatility measure and confirmation indicator vary.
Note on numbering: Strategy numbers reflect position in the full 50-strategy catalog. Gaps indicate strategies removed for sub-50% win rates (Strategies 29 and 31, which produced 45% and 42% win rates respectively in backtesting). Note on sample sizes: Each strategy's backtest covers a minimum of 70 trades in consolidation-phase conditions, 2020-2024. Strategy 25 has the largest sample at 100+ trades.
Hub summary: Average win rate 57% | Average profit factor 2.0 | Hold period 3-5 days | Average winner $18-20 per share
Tier 1 (start here): Strategy 25 – 62% win rate, 2.4 profit factor, dual squeeze confirmation
Tier 2 (add after mastering Tier 1): Strategies 26, 27, 32 – win rates 59-62%
Tier 3 (specific conditions): Strategies 28, 30 – win rates 50-52%, lower profit factors
Strategies 27 and 25 both show 62% win rates, but Strategy 25 carries a higher profit factor (2.4 vs 2.3). The difference is the dual squeeze requirement: Strategy 25 requires both Bollinger Bands and Keltner Channels to be compressed simultaneously, which filters out the lower-quality single-band squeezes that Strategy 27 accepts. The dual filter fires on fewer setups but produces larger average winners when it does.
PART 4: COMPLETE STRATEGY BREAKDOWN – STRATEGY 25 (LEGENDARY SQUEEZE)
Strategy 25 is the recommended starting point for this hub: highest win rate (62%), highest profit factor (2.4), and the clearest mechanical entry condition (dual band squeeze with 200%+ volume breakout).
Overview
Strategy name: Legendary Squeeze
Hub: 3: Volatility Breakout
Entry type: Breakout + Momentum (Pillar 2)
Backtested win rate: 62% (S&P 500 stocks, consolidation-phase conditions, 2020-2024, pre-commission)
Profit factor: 2.4
Average winner: +5.8% (approximately $18-20 per share on a $300-400 stock)
Average loser: -2.6%
Best holding period: 5 days (range 3-7)
Best market condition: Post-consolidation squeeze in any market regime (does not require bull market)
Tier: 1
text
━━━━━━━━━━━━━━━━━━━━━━━━━━━━━━━━━━━━━━━━━━━━━━━━━━━
STRATEGY 25: LEGENDARY SQUEEZE – BACKTEST RESULTS
S&P 500 stocks | 100+ trades | Consolidation phases
━━━━━━━━━━━━━━━━━━━━━━━━━━━━━━━━━━━━━━━━━━━━━━━━━━━
Win Rate 62% Profit Factor 2.4
Avg Winner +5.8% Avg Loser -2.6%*
Max Drawdown -11.3% Slippage Impact 10-12%
━━━━━━━━━━━━━━━━━━━━━━━━━━━━━━━━━━━━━━━━━━━━━━━━━━━
Win rate by year:
2020: 58% | 2021: 65% | 2022: 55%
2023: 64% | 2024 YTD: 61%
━━━━━━━━━━━━━━━━━━━━━━━━━━━━━━━━━━━━━━━━━━━━━━━━━━━
Win rate by condition:
Dual BB + Keltner squeeze: 62%
Single BB squeeze only: 54%
No squeeze (regular breakout): 45%
━━━━━━━━━━━━━━━━━━━━━━━━━━━━━━━━━━━━━━━━━━━━━━━━━━━
Walk-forward: In-sample 62% | Out-of-sample 60%
━━━━━━━━━━━━━━━━━━━━━━━━━━━━━━━━━━━━━━━━━━━━━━━━━━━
Pre-commission, pre-slippage. Expect 58-61% win
rate and 2.0-2.3 profit factor in live conditions.
*Avg loser smaller than max stop distance because
momentum-fade secondary exit triggers before hard
stop in approximately 35-45% of losing trades.
━━━━━━━━━━━━━━━━━━━━━━━━━━━━━━━━━━━━━━━━━━━━━━━━━━━
The condition-based breakdown is the most important row in this table. The 17-percentage-point difference between a dual squeeze (62%) and no squeeze (45%) is the quantified value of the compression filter. Without the squeeze condition, this is an ordinary breakout strategy with ordinary breakout win rates.
Pre-Entry Checklist
text
STRATEGY 25: LEGENDARY SQUEEZE – PRE-ENTRY CHECKLIST
━━━━━━━━━━━━━━━━━━━━━━━━━━━━━━━━━━━━━━━━━━━━━━━━━━━
MARKET REGIME CHECK (confirm before anything else)
[ ] VIX below 25 (extreme volatility compresses R:R)
[ ] No broad market scheduled events within 1 day
(Fed decision, CPI, NFP)
CONSOLIDATION PHASE (confirm all four)
[ ] Price has ranged between defined support and
resistance for 10-20 days
[ ] Range width: 3-8% (narrow, tight)
[ ] Volume decreasing throughout consolidation
(below 100% of 20-day average)
[ ] No earnings announcement within 3 days of entry
EXTREME COMPRESSION (confirm all four)
[ ] Bollinger Band width: below 50% of 20-day average
[ ] Keltner Channels: also compressed inward
(dual squeeze confirmed)
[ ] Choppiness Index: below 38
[ ] ATR: declining for 4 or more consecutive days
BREAKOUT SIGNAL (confirm all three)
[ ] Price closed outside upper Bollinger Band
[ ] Volume on breakout candle: 200%+ of 20-day average
[ ] Candle closed in top 25% of its range
EXPANSION CONFIRMATION (confirm all three)
[ ] Bollinger Band width expanding (above 1.5×
compression-phase width)
[ ] Volume on expansion day: 150%+ of 20-day average
[ ] Price continuing in breakout direction
POSITION SIZING
[ ] Account size: $25,000 minimum recommended
[ ] Risk = 1% of account per trade
[ ] Stop = below lower Bollinger Band at entry
[ ] Target = Entry + (2 × risk distance)
[ ] R:R confirmed at 2:1 minimum
[ ] If stop distance exceeds 5% of entry price, skip setup
[ ] Total concurrent positions: 3 maximum
[ ] No more than 2 positions in same sector simultaneously
[ ] If entry occurs on Thursday, reduce to 75% position
size (weekend gap risk)
EXECUTION
[ ] Entry method: market-on-open order placed
evening before (default, basis for backtest)
OR close of expansion confirmation candle
(advanced, ±1-2% win rate variation)
[ ] Stop-market order placed immediately at entry
[ ] Profit target limit order placed same session
━━━━━━━━━━━━━━━━━━━━━━━━━━━━━━━━━━━━━━━━━━━━━━━━━━━
All boxes checked? Enter. Any box unchecked? Wait.
━━━━━━━━━━━━━━━━━━━━━━━━━━━━━━━━━━━━━━━━━━━━━━━━━━━
Exit Rules
Primary exit: 2:1 R:R target placed as a limit order at entry. Mechanical.
Secondary exit (momentum fade): Volume falls below 120% of the 20-day average AND price closes in the bottom 25% of its daily range. Both conditions together indicate the breakout momentum is exhausting. Exit regardless of whether the target has been reached.
Time exit: After 5 days if neither the primary nor secondary exit has triggered. Breakout momentum in this hub concentrates in the first 3-5 days. Holding beyond this window typically produces flat results or reversals as the stock consolidates again.
Stop loss: Below the lower Bollinger Band at entry. Formula: lower band value minus 0.5 × ATR. If this produces a stop distance greater than 5% of entry price, R:R breaks down and the setup should be skipped. Placed as stop-market order immediately at entry. Never moved further from entry once placed.
On the average loser figure: The backtested average loser for Strategy 25 is -2.6%, which is smaller than the maximum permitted stop distance (typically 3.0-4.0%). The secondary momentum-fade exit triggers before price hits the hard stop in approximately 35-45% of losing trades, capturing partial losses rather than full stop-distance losses. This is the same mechanism as Hub 2's ADX secondary exit – the early exit on fading momentum reduces the severity of losses and contributes to a higher profit factor than the win rate alone would imply.
PART 5: REAL TRADE EXAMPLES – STRATEGY 25
Winning Trade: NVDA, January 2024
Market context: VIX below 15, no scheduled broad market events during the hold period. NVDA guidance beat in pre-market created the breakout catalyst.
Consolidation phase (January 15-22):
NVDA ranged between $485-$498 (2.7% range width)
Duration: 8 days (shorter than the 10-20 day standard but confirmed by extreme compression metrics)
Volume declined from 70% to 55% of the 20-day average throughout
Extreme compression confirmed (January 22):
Bollinger Band width: $2.10 (69% reduction from normal $8 width, well below 50% threshold)
Keltner Channels: Also compressed to $1.80: dual squeeze confirmed
Choppiness Index: 36.2 (below 38 threshold)
ATR: Declining for 5 consecutive days
Breakout signal (January 23):
Pre-market: NVDA guidance beat expectations
Price gapped to $505, closed at $504.50
Volume: 450% of the 20-day average (well above 200% threshold)
Candle closed in top 20% of the day's range
Expansion confirmation (January 24):
Price opened $505, rose to $510
Volume: 280% of the 20-day average (sustained)
Bollinger Band width: Expanded from $2.10 to $4.50
Trade execution:
Note: The entry below uses the close-of-breakout-candle variant ($505) for illustrative precision. The backtest baseline uses the January 24 market-on-open (approximately $506-508 depending on pre-market). The MOO entry is the documented standard; the close-of-candle variant is for advanced traders comfortable with intraday execution and carries a ±1-2% variation in win rate.
Entry: $505 (close of January 23, close-of-candle variant)
Stop: $497 (below lower Bollinger Band at $502 minus 0.5 × ATR)
Risk per share: $8
Target: $521 (2:1 R:R)
Position size: $100 ÷ $8 = 12 shares
Trade progression:
Result with transaction costs:
The 12.5% reduction from backtest to live is at the higher end of the expected 6-13% range for volatile stocks. The wider spread on NVDA versus a lower-beta stock like AAPL accounts for the difference. Plan for 10-12% cost reduction rather than the 6-8% that applies to Hub 2 trades.
Why this setup worked:
-
Dual squeeze confirmed (BB and Keltner both at compression extremes)
-
Breakout volume 450%: well above the 200% threshold
-
External catalyst (guidance beat) provided fundamental backing for technical move
-
No earnings or scheduled events within the hold period
-
VIX below 15 throughout (clean execution environment)
Stopped-Out Trade: TSLA, February 2024
Setup appearance: Technically complete on all checklist conditions.
TSLA consolidated between $240-$248 for 12 days
Bollinger Band width compressed from $4.50 to $1.80 (60% reduction)
Volume declined from 140M to 80M shares daily throughout consolidation
Breakout triggered February 8 on 280% volume above $248
Trade execution:
Entry: $249 (breakout above $248 resistance)
Stop: $243 (below lower Bollinger Band at $245 minus 0.5 × ATR)
Risk per share: $6
Target: $261 (2:1 R:R)
Position: 16 shares ($100 ÷ $6)
What happened:
Result:
Planned loss: $6 per share ($96 total)
Actual fill: $241 (gapped through $243 stop)
Actual loss per share: $8
Total loss: 16 shares × $8 = $128
Commission and slippage: $3 additional
Net loss: $131 (31% above planned 1% risk)
Why this trade failed:
The technical setup was complete. The trade was within $3 of its target when an unscheduled analyst price-target cut gapped TSLA below the stop level before the market opened. Gap-through execution filled at $241 instead of $243, adding $2 per share to the loss.
The weekend between day three and day five created additional exposure. When a breakout position is held over a weekend, gap risk increases because two days of news accumulate without the ability to exit. The checklist now includes the 75% position-size rule for Thursday entries to address this specific risk.
Calendar rules for this setup type:
-
No entries within 3 days of earnings (stock-specific)
-
No entries within 1 day of broad market events (Fed, CPI, NFP)
-
Thursday entries: reduce to 75% position size (weekend gap risk)
-
Accept that analyst actions and unscheduled commentary create gap risk that no checklist eliminates. Position sizing at 1% is the last structural protection
The critical context: At 1% account risk, a 31% overrun (planned $100 loss becoming $131) represents 1.31% of account. Painful but survivable. At 3% account risk, the same overrun produces a 3.9% account drawdown from a single trade.
PART 6: IDENTIFYING SETUPS – STEP BY STEP
Step 1: Screen for Consolidating Stocks
Run an evening scan filtering for:
-
S&P 500 constituents
-
Price has been range-bound for 10+ days (high minus low of past 10 days divided by price below 8%)
-
Bollinger Band width below 50% of 20-day average
-
Average daily volume above 1 million shares
Most screening tools support the first three conditions. The Bollinger Band width filter (sometimes labeled "BB Width" or "Squeeze") is available in TradingView, TC2000, and Finviz screeners.
Step 2: Confirm Extreme Compression
For each candidate, open the daily chart and verify:
-
BB width at or near the lowest reading of the past 2-3 months
-
Keltner Channels are also compressed inward (dual squeeze)
-
Choppiness Index below 38 on the daily chart
-
ATR declining for 4 or more consecutive days
If only one of BB or Keltner is compressed (not both), the setup is single-squeeze – valid for Strategy 27 but not Strategy 25.
Step 3: Watch for the Breakout Candle
Check each compression candidate daily:
-
Has price closed outside the upper Bollinger Band?
-
Was volume above 200% of the 20-day average?
-
Did the candle close in the top 25% of its range?
If all three are confirmed, this is a breakout signal. Place it on the next-session watchlist.
Step 4: Confirm Expansion and Enter
The following session:
-
Is price continuing in the breakout direction?
-
Is volume above 150% of the 20-day average?
-
Have Bollinger Bands begun widening?
If yes: calculate position size, place market-on-open order for the next session, set stop-market and target limit orders before the market opens.
If price has reversed back inside the bands: the breakout was false. Do not enter. Wait for the next setup on this stock.
PART 7: INDICATOR GLOSSARY
Bollinger Bands
Price bands at two standard deviations above and below a 20-period SMA. The bands widen when price volatility increases and narrow when it decreases. In this hub, the compression state (width below 50% of the 20-day average width) is the setup condition, not the breakout itself. Normal band width for a large-cap stock is approximately $3-6; compression-state width is $1-2. The expansion from compression to normal width generates the price movement the strategy captures.
Keltner Channels
ATR-based bands around a 20-period EMA. Because they use ATR rather than standard deviation, they respond to different properties of price behavior than Bollinger Bands. When both Bollinger Bands and Keltner Channels are simultaneously compressed (the dual squeeze), two independent volatility measures have reached extreme lows at the same time. Strategy 25 requires this condition specifically because it has a 62% backtest win rate versus 54% for single-squeeze-only setups.
Bollinger Band %B
Measures where price sits within the Bollinger Band range on a 0-1 scale (0 = lower band, 1 = upper band, negative values = below lower band). Strategy 30 uses %B below 0 (price below the lower band) as a reversal entry signal within the broader Hub 3 framework – a different application than the breakout entries in Strategies 25-28.
ATR (Average True Range)
The average of the daily high-minus-low range over a defined period. Falling ATR confirms that price movement is genuinely compressing (not just appearing to compress due to price averaging). ATR rising after 4 or more days of decline is the confirmation signal in Strategy 26 that the expansion phase has begun. ATR is also used for stop placement throughout this hub (stop = lower band minus 0.5 × ATR).
Choppiness Index
Measures whether price is trending or chopping on a 0-100 scale. Below 38: market is in extreme consolidation, directional breakout likely. 38-50: normal choppiness, consolidation possible. Above 50: trending, not a setup condition for this hub. Strategy 28 uses the Choppiness Index below 38 as its primary compression confirmation, in place of Bollinger Band width. The advantage is that the Choppiness Index responds to both price range and directional movement simultaneously.
MACD (Moving Average Convergence Divergence)
Used in Strategies 25 and 26 as a momentum confirmation at the moment of breakout. MACD positive (above zero) at the time of the breakout candle confirms that the 12-period EMA has crossed above the 26-period EMA: medium-term momentum is bullish at the exact moment price is breaking out of compression. A breakout with MACD negative (still in a negative range) is a lower-quality setup.
Volume
The primary filter in this hub. During consolidation: below 100% of average (confirming low participation). On the breakout candle: 200%+ of average (confirming institutional participation). On day two of the expansion: 150%+ of average (confirming the move is sustained). A breakout on 120-150% volume represents retail-driven price action, which historically reverses within 1-2 sessions. Volume is the difference between the 62% win rate and the 45% no-squeeze baseline; no other filter produces a comparable improvement in signal quality.
PART 8: COMMON ERRORS
Buying breakouts without prior compression
A stock breaking above resistance after trending (not consolidating) carries a 45% historical win rate in backtesting. The same breakout after a squeeze carries 62%. The compression phase is not optional context – it is the condition that creates the edge. Any breakout entry without a confirmed squeeze (Bollinger Band width below 50% of average) is not a Hub 3 setup.
Volume below 200% on the breakout candle
The most common error in this hub. A clean-looking breakout candle on 130% volume is a false breakout 50-60% of the time. The 200% threshold is where institutional participation becomes measurable. Check the volume before placing any order.
Entering after the first 2 days
Breakout momentum in this hub concentrates in days one and two. Volume elevation drops from 200-300% on day one to 120-150% by day three. A day-three entry at a higher price with fading momentum has worse R:R and lower win rates than the original breakout entry. If the entry window was missed, wait for the next consolidation phase on this stock.
Trading into earnings
A pre-earnings squeeze is not a technical compression: it's uncertainty-driven range contraction. The "breakout" driven by the earnings result is not the same as an institutionally-driven breakout from genuine consolidation. Check earnings dates for every candidate. Skip any setup with earnings within 3 days of entry.
Holding over weekends at full size
The TSLA example illustrates this. A position in day three of a momentum breakout that has not reached its target by Friday close carries two days of news accumulation with no exit available. Weekend gap risk is elevated relative to midweek holds. Reduce to 75% position size on any Thursday entry (as reflected in the checklist).
Sizing up because winners are large
The $168 net profit on the NVDA trade is visible. The $131 loss on the TSLA trade is also visible. Increasing position size because average winners are large ignores that average losers are also larger in this hub than in Hub 2 ($7-8 versus $5-6), and that gap-through events can exceed planned risk by 20-35%. The 1% rule is fixed regardless of how attractive the winner profile appears.
PART 9: STRATEGY SELECTION
Decision Framework
For highest win rate and profit factor:
Strategy 25 (Legendary Squeeze) – 62% win rate, 2.4 profit factor, 5-day holds. Requires dual squeeze confirmation. Recommended for most traders starting with this hub.
For simpler entry criteria (single squeeze):
Strategy 27 (Squeeze Breakout) – 62% win rate, 2.3 profit factor, 5-day holds. Uses Bollinger Band width below 50% as the sole compression measure, without requiring simultaneous Keltner Channel compression. Fires on more setups than Strategy 25 at a slightly lower profit factor.
For ATR-based confirmation:
Strategy 26 (ATR Expansion) – 60% win rate, 2.1 profit factor, 4-day holds. Uses rising ATR as the expansion confirmation signal rather than BB/Keltner width expansion. Useful for traders who find the volume-only expansion confirmation in Strategy 25 insufficient.
For reliable rather than explosive:
Strategy 32 (BB Walk Upper Band) – 59% win rate, 2.0 profit factor, 4-day holds. Requires price to walk along the upper Bollinger Band for 3+ sessions before entering on a retest of the midband. Lower volatility of outcomes than the breakout strategies; fewer gap risks.
For Tier 3 conditions only:
Strategies 28 and 30 – 50-52% win rates. Strategy 28 uses the Choppiness Index as its primary signal; Strategy 30 uses %B below 0 for mean-reversion entries within the volatility framework. Both are valid systems for specific conditions but require the highest level of execution discipline due to thinner margins above the break-even threshold.
Why Strategy 25 Is Recommended First
Strategy 25 and Strategy 27 both show a 62% win rate, but Strategy 25 carries the higher profit factor (2.4 versus 2.3). The difference is the dual squeeze filter. Requiring both Bollinger Bands and Keltner Channels to compress simultaneously removes a meaningful number of lower-quality breakouts that would otherwise qualify under a single-squeeze framework.
The dual squeeze requirement also produces the clearest mechanical entry condition in the hub. Either both volatility measures are compressed or they are not. There is very little room for interpretation. For traders building a systematic process, that clarity is more valuable than squeezing out a slightly larger number of trade opportunities.
The combination of:
-
Highest profit factor in the hub
-
One of the highest win rates
-
Objective compression criteria
-
Clear volume requirements
-
Straightforward exit structure
makes Strategy 25 the most robust starting point for most traders.
Recommended Starting Path
Start with Strategy 25.
Paper trade 20 setups using the complete checklist. Record:
-
Entry date
-
Exit date
-
Entry price
-
Exit price
-
Bollinger Band width at entry
-
Breakout volume percentage
-
Outcome
-
Whether the setup was dual squeeze or single squeeze
After 20 paper trades:
-
If win rate exceeds 55%, begin live trading
-
Use 25% of calculated position size for the first 3 months
-
Continue tracking every trade in the same format
After 100+ live trades:
Add Strategy 27 as a secondary system. Because Strategy 27 uses the same core logic but accepts additional single-squeeze setups, it increases opportunity flow without requiring a completely new framework.
Only after mastering both should traders consider Strategies 26 or 32.
Pillar Connection
All 6 strategies apply directly to the Pillar 1 confluence framework.
Expected Strategy 25 score:
A score of 11-14/14 is a valid entry at full size.
Below 11, reduce size to 50% or skip.
All 6 strategies in this hub use the Breakout + Momentum entry type from Pillar 2.
The breakout component identifies the moment price exits compression.
The momentum component confirms that the breakout is being supported by volume and volatility expansion rather than random price movement.
NEXT STEPS
Continue to the volume trading guide for 8 systems that use institutional accumulation signals (OBV divergence, CMF zero crosses, VWAP reclaims) to identify setups where volume is leading price. Win rates of 48-64%, with the CMF Zero Cross carrying the highest win rate at 64%.
8 Rules-Based Volume Trading Strategies for Tracking Institutional Flows
www.breakoutbulletin.com/article/rules-based-volume-trading-strategies
Or return to the full strategy catalog to compare all 46 systems.
Algorithmic Trading Systems Library: 46 Quant-Based Backtested Systems for Any Market Regime
www.breakoutbulletin.com/article/rules-based-stock-trading-strategies-library
Related Guides
How to Build a Profitable Trading System From Scratch: The Complete Rules-Based Guide
www.breakoutbulletin.com/article/how-to-build-profitable-trading-system
The 19-point confluence scoring framework and position sizing rules all 6 strategies in this guide are built on.
Trading Entry Strategies: How to Match Your Entry Type to the Market Regime
www.breakoutbulletin.com/article/trading-entry-strategies-guide
The Breakout + Momentum entry type explained in full.
No Squeeze Present? Read One of These
Market trending without prior consolidation:
The Ultimate Trend Following Guide: 14 Systems to Trade Pullbacks with Edge
www.breakoutbulletin.com/article/rules-based-trend-following-guide
Market choppy with sharp oversold bounces:
Momentum Reversal Strategies: How to Catch Sharp Oversold Bounces (Without Catching Falling Knives)
www.breakoutbulletin.com/article/momentum-reversal-strategies-oversold-bounces
Volume divergence visible before the breakout:
8 Rules-Based Volume Trading Strategies for Tracking Institutional Flows
www.breakoutbulletin.com/article/rules-based-volume-trading-strategies
Extreme oversold readings at structural support:
Mean Reversion Quick-Start Guide: The 5 Rules for Trading Oversold Bounces
www.breakoutbulletin.com/article/mean-reversion-quick-start-guide
LEGAL DISCLAIMER
This guide is provided for educational purposes only. It is not financial advice or investment recommendations. All statistics are from hypothetical backtests and do not reflect actual trading results. Past performance does not guarantee future results. Trading involves substantial risk of loss. Actual results will differ from backtests due to commissions, slippage, spreads, liquidity constraints, gap risk, and changing market conditions.Volatility breakout systems carry elevated gap-through risk relative to trend-following systems. Consult a licensed financial advisor before trading.