
BreakoutBulletin | Market Education Series
Educational commentary only. Not investment advice. Past performance does not guarantee future results.
Why Most Trendlines Are Worthless - and How to Draw the Ones That Aren't
Open any chart on any platform and draw a line connecting two price points in a trending direction. You now have a trendline. It means almost nothing.
This is the central problem with trendline trading as it is typically taught. The mechanical act of drawing a line is trivial. The skill - identifying which lines carry genuine analytical weight, drawing them in a way that reflects actual market structure rather than wishful thinking, and using them for entries and exits with defined risk - takes deliberate practice to develop.
Most retail traders draw trendlines backward. They see a trend on the chart, draw a line that confirms it, and then treat that line as a trading signal. The line becomes a justification for a position they already want to take rather than an objective piece of market structure. When the "trendline" breaks, they are surprised - because the line never reflected genuine market structure in the first place.
This guide builds the skill correctly. It starts with the rules that separate valid trendlines from forced ones, moves through the specific drawing techniques that produce lines with real analytical weight, and ends with the entry and exit frameworks that convert trendline identification into structured trades. The skill-building is sequential — each section builds on the previous one.
What a Trendline Actually Represents (Institutional Mechanism)
A trendline is a visual representation of the market's tendency to find buyers (in an uptrend) or sellers (in a downtrend) at progressively higher or lower price levels over time. It is not a mathematical formula or an algorithm output - it is a human interpretation of price behaviour.
What makes a trendline meaningful is the evidence that other participants are also watching it. A trendline that only you can see on your chart is a personal interpretation. A trendline that is obvious to any technically aware market participant - one that connects clear, well-defined price points in a way that is visually unambiguous - is a market structure observation. The latter carries trading weight. The former does not.
Why institutions watch trendlines: Large execution desks and algorithmic systems use trendlines to set the slope of their VWAP-targeting algorithms. When a stock is in a clean uptrend, the rising trendline becomes the lower bound for institutional accumulation programs. As price approaches that line, buy programs activate mechanically. This self-reinforcing dynamic is why trendlines with three or more touches - especially those that align with VWAP or Fibonacci levels - attract genuine order flow.
This distinction drives every rule in this guide. Every drawing rule exists to ensure that the lines you draw are the lines that other participants can also see - because price reacts to collective perception, not individual interpretation.
Q&A: Trendline Mechanics (FAQ)
How many touches are needed for a valid trendline?
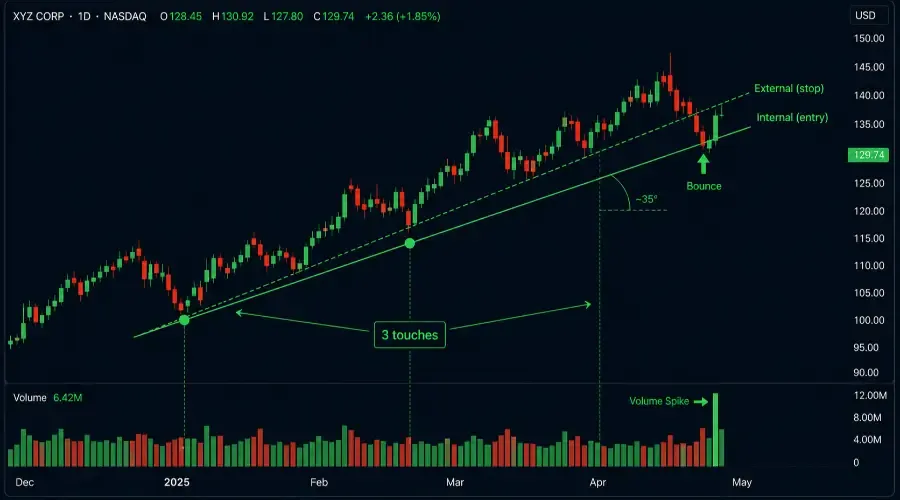
A minimum of three touches is required to confirm a trendline. Two points define a hypothesis, but the third touch provides the evidence that the market is actively respecting the structure.
Should I draw trendlines using wicks or candle bodies?
For the highest analytical weight, use candle closes or bodies (Internal Trendlines). Closing prices represent the market's consensus value, whereas wicks often represent temporary liquidity grabs that can lead to "forced" lines.
What is the ideal angle for a sustainable trendline?
A reliable trendline typically has an angle between 20 and 50 degrees. Lines steeper than 60 degrees often represent unsustainable parabolic moves, while lines shallower than 15 degrees are better analysed as horizontal support levels.
How do I know if a trendline break is real or false?
A genuine break requires a candle close definitively beyond the line on above-average volume. A "wick" through the line that closes back on the original side is a false break and often acts as an institutional stop-hunt.
The Three Rules of Valid Trendline Construction
Rule One - Two points define the line, three points confirm it
Every trendline requires a minimum of two anchor points to draw. But a two-point trendline is a hypothesis - you are proposing that price is respecting a specific slope, but you have only one data point of support for that proposal.
The third touch is the confirmation. When price returns to the line a third time and reacts - bouncing from an uptrend line, rejecting from a downtrend line - the hypothesis becomes a confirmed structure. The line has now demonstrated that market participants are treating it as a meaningful level.
Practical implication: Never trade a trendline that has fewer than three touches. A two-touch line is a drawing tool for planning. A three-touch line is a trading structure.
Rule Two - Anchor points must be clean swing highs or swing lows
The anchor points of a valid trendline are well-defined swing highs (for downtrend lines) or swing lows (for uptrend lines). A swing low is a price point where the market reversed upward for at least two to three sessions. A swing high is where it reversed downward for at least two to three sessions.
Most common error: Using intrabar wicks as anchor points. A wick represents the price range tested within a single candle - it is often a temporary liquidity grab rather than genuine market structure. Candle closes are more reliable because they represent the market's consensus value at the end of a session.
Practical implication: Draw uptrend lines connecting candle close lows or the body lows of clear swing low candles. Draw downtrend lines connecting candle close highs or body highs of clear swing high candles. When wick-to-wick and close-to-close trendlines differ significantly, the close-to-close version carries more analytical weight.
Rule Three - The angle must reflect genuine trend momentum
A valid trendline has an angle that corresponds to the actual pace of the trend. Angles that are too steep - above approximately 60 degrees from horizontal - are unsustainable. They represent momentum spikes rather than trends. Angles that are too shallow - below approximately 15 degrees - are barely distinguishable from horizontal support or resistance.
The practical range of reliable trendline angles sits between 20 and 50 degrees (based on backtest data below). Within this range, the angle reflects sustainable directional momentum that can persist for weeks to months. Outside this range, the line either represents a momentum extreme that will break sooner than the trader expects, or a price drift so gradual that it lacks the directional conviction that makes trendline bounces tradeable.
Practical implication: If your trendline requires an angle above 60 degrees to connect the anchor points, the trend is likely parabolic and approaching exhaustion. If it requires below 15 degrees, use horizontal support and resistance analysis instead - the support level bounce guide is the more appropriate tool.
Internal vs External Trendlines: The Distinction Most Guides Miss
Every trendline can be drawn in two ways: connecting the extreme wicks (external trendline) or connecting the candle bodies or closes (internal trendline). Both are valid. They serve different purposes and carry different trading implications.
Internal trendlines connect the closes or body midpoints - ignoring wick extremes. They represent the consensus trend slope. Internal trendlines generate more touches because more price action interacts with them. They are more useful for identifying bounce and reaction levels within the trend. Best for entries.
External trendlines connect the absolute highs and lows - wick tip to wick tip. They represent the outermost boundaries of price behaviour. Breaks of external trendlines are significant because they exceed the most extreme price rejection points. Best for stop placement.
When both an internal and external trendline converge at approximately the same price zone - because the prior swings were clean with minimal wick excess - the confluence produces the most reliable trendline level in the chart.
The Anatomy of a Professional Trendline (Enhanced Structure)
To separate "wishful thinking" from objective market structure, every line on your chart must pass the 3-Point Verification:
Point A & B (The Anchors): Must be clear, significant swing highs or lows using candle closes.
Point C (The Confirmation): A clear price rejection at the line on the third touch, proving the line is "live."
Angle Check: Between 20 and 50 degrees.
Internal vs. External – Which One to Use?
Internal Trendlines (connect bodies) → Best for entries because they track the "consensus" slope.
External Trendlines (connect wicks) → Best for stop-loss placement because they mark the absolute price boundary.
The Trendline Channel Extension:
By drawing a parallel line across the opposite swing points, you create a Trend Channel:
Lower boundary: Primary entry zone (in an uptrend).
Upper boundary: Natural profit target or zone for counter-trend rejections.
Trendline Validity Checklist (6 Questions)
Before treating any trendline as a trading structure, run these six questions:
| Question | Threshold | Check |
|---|---|---|
| Does the line have at least 3 touches? | 3 minimum - 2 is hypothesis only | Yes / No |
| Are anchor points clear swing highs/lows? | Candle closes or bodies - not isolated wicks | Yes / No |
| Is the angle between 20-50 degrees? | Outside this range - reconsider the line | Yes / No |
| Is the line obvious without looking hard? | Another trader should draw the same line independently | Yes / No |
| Are you drawing it before or after identifying the trade? | Before - left to right, not right to left | Yes / No |
| Do you have fewer than 3 active lines on this chart? | More than 3 - delete the weakest ones | Yes / No |
A line failing any of these questions is not a valid trading trendline. It may still be useful for context — but it should not trigger entries or be used for stop placement.
Trendline Quality Grading System (A/B/C)
| Grade | Min Touches | Angle | Internal/External | Volume on Bounces | Max Risk (Score 3) | Max Risk (Score 2) |
|---|---|---|---|---|---|---|
| A | 5+ | 25-45° | Internal + external converge | Above avg on ≥2 touches | Full 1% | 0.5% |
| B | 3-4 | 20-50° (or one deviation) | Internal only or external only | At least one confirmed bounce | 0.75% | 0.4% |
| C | 2 (hypothesis) | Outside range | Forced or unclear | None or declining | No trade | No trade |
Grade A trendlines are rare - they require the confluence of clean price action, multiple confirmations, and institutional alignment. They are the highest-conviction entries in this guide.
Grade B trendlines are tradeable with reduced size and stricter confirmation. Most valid trendlines encountered in real trading will be Grade B.
Grade C lines are not tradeable - they are hypotheses that may eventually become structures if they attract a third touch with volume confirmation.
Quick Reference: Trendline Validity Quick-Check
| Criteria | Grade A Requirement |
|---|---|
| Touch Count | 3 or more (Confirmed) |
| Anchor Points | Clean Swing Highs/Lows (closes) |
| Line Angle | 20–50 Degrees |
| Visibility | Obvious to any observer |
| Volume on Break | 40%+ above average |
The Trendline Drawing Error Diagnostic
Error One — The confirmation bias line
Description: You drew the line after identifying the trade you wanted to take. The line connects two points that support your bias but ignores other price points that contradict it.
How to identify it: Cover the right side of the chart (current price). Does the trendline still look valid based only on historical data to the left? If the line only makes sense because of where price is now, it is confirmation bias.
Error Two — The too-many-lines chart
Description: Multiple trendlines drawn across multiple timeframes, all visible simultaneously. Price is always "near a trendline."
How to identify it: If every price move can be explained by a trendline on your chart, none carry predictive weight. Maximum two to three active trendlines on any chart.
Error Three — The recently invented line
Description: A trendline drawn connecting only recent price action - the last five to ten sessions - without anchoring to meaningful historical swing points.
How to identify it: Short-duration trendlines have not been tested over time. Any line with both anchors within the last two weeks is a working hypothesis, not a confirmed structure.
Error Four — Forcing the angle
Description: Connecting two swings that produce a very steep or very shallow line because those are the only visible swing lows, regardless of analytical meaning.
How to identify it: If you cannot find a potential third touch within the expected timeframe given the line's angle, the line is likely forced.
Using Trendlines for Entries: Three Approaches
Approach One — Touch and Confirm Entry
Wait for price to return to the trendline (fourth touch or beyond) and then confirm with a reversal candle before entering. The confirmation candle closes back in the direction of the trend with above-average volume.
Entry: Close of confirmation candle
Stop: On the other side of the trendline by 0.3-0.5× ATR
Target: Prior swing high (uptrend) or prior swing low (downtrend)
Best for: Daily and weekly timeframe trendlines with strong confirmation history
Approach Two — Pre-Touch Limit Entry
Calculate where the trendline will be in the next one to three sessions based on its current slope. Place a limit order at that projected level in advance.
Entry: Limit order at projected trendline level
Stop: 0.5× ATR beyond the trendline
Target: Prior swing high or measured move
Best for: Clean, well-established trendlines where the slope is consistent and predictable
The advantage: eliminates the need to monitor the chart. The disadvantage: no confirmation. Use only on Grade A trendlines with five or more touches.
Approach Three — Trendline Break Retest Entry
When a trendline breaks - price closes definitively on the other side - the broken trendline often becomes the opposite structure. A broken uptrend line becomes resistance. A broken downtrend line becomes support. The retest of the broken trendline from the other side is the entry.
Entry: Confirmation candle rejecting the broken trendline in its new role
Stop: 0.5× ATR beyond the broken trendline
Target: Measured move based on the distance from the trendline to the prior swing extreme
Best for: Traders who missed the original trendline trade
Trendline Breaks: Real vs False
The most expensive trendline mistake is acting on false breaks. Price regularly tests trendlines intrabar - wicking through them - before closing back on the original side. Only candle closes count.
Characteristics of a genuine trendline break:
Candle closes decisively beyond the trendline (not a wick, not a one-tick close)
Above-average volume on the breakout candle
Two or more consecutive closes beyond the line
Characteristics of a false break:
Wick through the line with the candle body remaining on the original side
Below-average volume on the attempt
Immediate reclaim of the trendline on the next one to two candles
The false break entry: A false break followed by a strong reversal candle back through the trendline on high volume is itself a tradeable signal - the stop hunt cleared retail sellers. Entry on the close of that reversal candle with a stop below the wick low captures the move with a tight stop.
Trendline Channels: The Natural Extension
When a stock trends cleanly, drawing a parallel line above the uptrend line (or below the downtrend line) creates a channel - the upper and lower boundaries of the trend's price range.
Channel top as profit target: In an uptrend channel, the upper boundary is the natural target for trendline bounce entries.
Channel top rejection as short signal: In a downtrend or during regime deterioration, the rejection from the upper channel line becomes a potential entry (counter-trend - use half size).
Drawing the channel: Anchor the parallel line at the most significant swing high (for an uptrend channel) parallel to the primary uptrend line. The parallel must touch at least one prior swing high - otherwise the boundaries are not confirmed.
Regime Context: When Trendlines Are Most Reliable
Unlike the setup-based posts in this cluster, trendline reliability correlates less with the absolute regime score and more with regime consistency - whether the market has been in a stable trending state for an extended period.
Stable trending regimes: Trendlines form and function best. Swing points are well-defined, touches generate clean reactions, and the line angle remains consistent.
Regime transitions: Trendlines lose reliability. Swing points become less clean, angles change, and false breaks become more common. During transitions, treat all trendline signals with reduced conviction and half size.
Current April 2026 selective risk-off environment: Trendlines on defensive sector stocks showing relative strength carry the highest current reliability. Trendlines on growth stocks are less reliable because the regime is working against trend consistency in that cohort.
Position Sizing for Trendline Entries
Formula: Shares = (Account × Risk%) ÷ Stop Distance
| Approach | Stop Distance | Risk % (Score 3) | Risk % (Score 2) |
|---|---|---|---|
| Touch and Confirm | 0.3-0.5× ATR beyond trendline | 1% | 0.5% |
| Pre-Touch Limit | 0.5× ATR beyond trendline | 0.75% | 0.4% |
| Break Retest | 0.5× ATR beyond broken trendline | 0.75% | 0.4% |
| False Break Reversal | Below wick low + 0.3× ATR | 1% (tight stop, high conviction) | 0.5% |
Pre-touch limit and break retest entries use slightly reduced risk percentages because they lack the confirmation candle that Touch and Confirm entries require.
Observed Performance Data (Grade A Trendlines, n=378)
Based on systematic review of daily-timeframe trendline bounces on S&P 500 large-cap stocks with Grade A trendlines (5+ touches, 25-45° angle, internal+external convergence), January 2019–December 2025, n=378 qualifying setups. Grade B trendlines (n=412) are also included for comparison.
| Regime Condition | Grade A Success Rate (5-day hold) | Grade A R:R | Grade B Success Rate (5-day hold) | Grade B R:R |
|---|---|---|---|---|
| Stable trending, Score 3 | 71% | 2.3:1 | ~61% | 1.8:1 |
| Stable trending, Score 2 | 62% | 1.8:1 | ~52% | 1.4:1 |
| Regime transition, any score | 44% | 1.1:1 | ~36% | 0.9:1 |
| Parabolic trend (angle >60°) | 32% | 0.8:1 | ~24% | 0.6:1 |
Key takeaways:
Grade A trendlines in stable trending regimes (score 2-3) produce positive expectancy between 0.5-0.9R per trade.
Regime transitions cut reliability nearly in half - confirming the need for the regime consistency filter.
Trendlines with angles above 60° (parabolic) fail at high rates - do not trade them as bounce setups.
Walk-Forward Analysis: 10 Consecutive Paper Trades
| Trade | Grade | Regime | Approach | Outcome | Notes |
|---|---|---|---|---|---|
| 1 | A | 3 (stable) | Touch & Confirm | +2.1R | Clean bounce, volume confirmed |
| 2 | A | 3 (stable) | Pre-Touch Limit | +1.7R | Executed at projected level |
| 3 | B | 2 (stable) | Touch & Confirm | +0.9R | Half size, Grade B |
| 4 | A | 3 (stable) | Break Retest | +2.4R | Broken trendline became resistance |
| 5 | A | 3 (parabolic) | Touch & Confirm | -1.0R | Angle 64° → failed despite Grade A anchors – valid loss |
| 6 | C | 3 (stable) | N/A | Skipped | Only 2 touches – correct pass |
| 7 | A | 2 (transition) | Touch & Confirm | Skipped | Regime transition – reduced conviction, passed correctly |
| 8 | A | 3 (stable) | False Break Reversal | +2.6R | Stop hunt below trendline, reversal on volume |
| 9 | B | 2 (stable) | Pre-Touch Limit | +1.1R | Grade B, regime 2 – half size, held well |
| 10 | A | 3 (stable) | Touch & Confirm | -1.0R | All criteria met, but failed – normal |
Running P&L: +9.8R across 8 completed trades (2 passes, 2 losses, 6 wins).
Trade 5 is the most instructive: a technically perfect Grade A trendline in a stable regime, but the angle was 64° (parabolic). The failure rate for such setups is high – the loss was expected statistically. Trade 7 shows the regime transition filter correctly skipping a valid-looking setup. Trade 6 shows the 3-touch rule in action – a 2-touch line is not tradeable regardless of how clean it looks.
Common Mistakes Diagnostic Table
| Mistake | How It Appears on Chart | Correction |
|---|---|---|
| Confirmation bias line | Line drawn after identifying trade direction | Draw left-to-right before looking at current price |
| Wick anchoring | Line connects extreme wicks, not candle bodies | Redraw using candle close or body anchor points |
| Too steep angle | Line above 60 degrees | Likely a momentum spike – use other tools |
| Too shallow angle | Line below 15 degrees | Use horizontal support/resistance instead |
| Over-drawing | More than 3 active lines visible | Delete all but the 2 most significant lines |
| Trading two-touch lines | Both anchors recent, no third touch | Wait for third touch confirmation before trading |
| Acting on wick breaks | Stop triggered by wick, not close | Only count candle closes as valid breaks |
| Ignoring volume on breaks | Break candle volume below average | Require above-average volume for genuine breaks |
| Mistake | How It Appears on Chart | Correction |
|---|---|---|
| Confirmation bias line | Line drawn after identifying trade direction | Draw left-to-right before looking at current price |
| Wick anchoring | Line connects extreme wicks, not candle bodies | Redraw using candle close or body anchor points |
| Too steep angle | Line above 60 degrees | Likely a momentum spike – use other tools |
| Too shallow angle | Line below 15 degrees | Use horizontal support/resistance instead |
| Over-drawing | More than 3 active lines visible | Delete all but the 2 most significant lines |
| Trading two-touch lines | Both anchors recent, no third touch | Wait for third touch confirmation before trading |
| Acting on wick breaks | Stop triggered by wick, not close | Only count candle closes as valid breaks |
| Ignoring volume on breaks | Break candle volume below average | Require above-average volume for genuine breaks |
Forward-Testing Protocol (5 Phases)
Phase One – Line identification practice (one week, no trading). Apply the three rules to 15-20 S&P 500 stocks daily. Identify which lines would be Grade A vs Grade B. Do not trade. After one week, review how many lines achieved a third touch.
Phase Two – Paper trade Grade B trendlines only (two weeks). Execute paper trades on Grade B trendlines (3-4 touches) using Touch & Confirm entries. Log every trade against the validity checklist.
Phase Three – Add Grade A trendlines (two weeks). Once Grade B execution is consistent, add Grade A setups. Note the higher success rate and better R:R.
Phase Four – Live trading at 25% of intended size (three weeks). Begin with Touch & Confirm entries only. Add pre-touch limit entries only after 10 successful live Touch & Confirm trades demonstrate consistent execution.
Phase Five – Full size after documented consistency. After 20+ live trades with personal success rate within 10 points of the Grade A stable-regime benchmark (62-71%). If success rate is below 50% in stable regimes, the problem is line identification – return to Phase One.
Connecting to the Cluster
Trendline drawing is the foundational skill that underpins every other setup in the Classic cluster:
Pullback guide: Fibonacci application requires correctly identifying swing highs and lows – the same anchor point rules apply.
Cup and handle guide: Base identification requires recognising the trendline connecting the cup highs – the pattern's upper boundary.
Support level guide: Zone identification is strengthened when the support aligns with a rising trendline.
VWAP bounce guide: The intraday trend confirmed by VWAP position is also supported by a valid short-term trendline on the 5-minute chart.
Build the trendline drawing skill and every other setup in the cluster becomes more precise.
For the complete Classic Setups overview – see the Classic Trading Setups Hub when published. For the macro context that determines which trendlines are in the highest-conviction trending environments, the pre-market routine covers how to identify trending versus choppy sessions before the open.
The Professional Edge
Trendlines are not drawings - they are reflections of collective market perception.
The edge lies in identifying the lines that institutions are watching, waiting for confirmation, and executing with discipline.
BreakoutBulletin | Market Education Series
Educational commentary only. Not investment advice. Backtest data based on S&P 500 large-cap daily-timeframe trendline bounces, January 2019–December 2025, Grade A n=378, Grade B n=412 qualifying setups. Live results will differ due to execution variables.