
Today's Market Narrative · Monday, August 3, 2026
By Manish T. · BreakoutBulletin
For all the attention on earnings, the variable actually steering the U.S. market right now sits in the bond market.
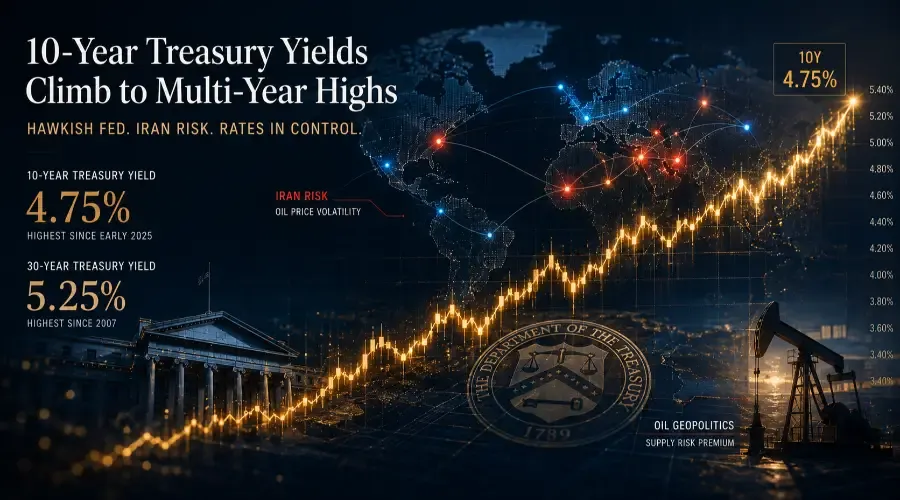
The 10-year Treasury yield ended last week at 4.75%, its highest since early 2025, and the 30-year reached a level not seen since around 2007 – touching 5.24–5.28% . Two forces are pushing in the same direction: a Federal Reserve that has turned unmistakably hawkish, and a geopolitical backdrop – the on-again, off-again U.S.–Iran conflict – that keeps threatening the oil price and, through it, inflation.
When the long end of the yield curve moves to multi-year highs, it does more than reprice bonds; it lifts the discount rate applied to every future cash flow in the equity market, tightens financial conditions, and reorders which sectors lead.
That is why rates – not any single earnings headline – are the organizing story of the current session, and why the yield complex is the key to reading everything else.
The Primary Catalyst: A Hawkish Hold
The anchor is the Federal Reserve's latest decision.
The Fed held its target range at 3.50%–3.75% , but the character of the hold was hawkish: three officials – Beth Hammack, Neel Kashkari, and Lorie Logan – dissented in favour of an immediate quarter-point hike, marking the largest number of dissents in a decade.
Chair Warsh used the press conference to decline forward guidance and to reaffirm a firm line on the 2% inflation goal.
The statement tied still-elevated inflation partly to supply shocks, energy included.
Markets absorbed the message quickly – futures moved to price roughly 56-60% odds of a rate hike in September, down from about 80% before last week's meeting but still an unusual stance in a cycle where much of the consensus had been positioned for cuts.
The mechanism from there is direct: when the market believes policy will stay restrictive or tighten further, the long end of the curve reprices higher, and higher long-term yields are, mechanically, a tightening of financial conditions – pressure that lands hardest on long-duration growth names and the classic bond proxies in utilities and real estate.
Reinforcing Signal: The Geopolitical Leg
The second force in the cluster reinforces the first.
The U.S.–Iran conflict has oscillated for months between escalation and pause, and each flip travels the same chain into markets.
In late July a brief weekend ceasefire pushed oil sharply lower and pulled the 10-year yield back toward 4.60%; within days the tension re-escalated and the move reversed – the setup markets are watching as the new week opens.
Over the weekend, President Trump delayed a fresh strike on Iran, sending oil sharply lower and shifting the geopolitical calculus once again.
The transmission runs cleanly: renewed Iran tension → higher oil prices → higher expected inflation → higher yields and firmer rate-hike odds → pressure on rate-sensitive equities and support for the dollar.
That is why a single geopolitical headline can move the entire rate complex in one session, and why the bond market has been described as “flashing red” about the conflict: with the long end already stretched, an oil-driven inflation impulse is exactly the kind of shock it is least prepared to absorb.
Rates and geopolitics are not two stories here – they are one feedback loop.
Cross-Asset Confirmation
The cross-asset tape confirms the read rather than contradicting it.
As long-end yields held near their highs, the dollar held near 100 (DXY at roughly 99.4–99.8) – broadly consistent with a higher real-rate path.
Gold edged higher, rising roughly 0.7% to around $4,067 per ounce**, as safe-haven demand from geopolitical uncertainty offset the drag from higher real yields.
Oil, meanwhile, remained the volatile swing factor: WTI crude plunged roughly 4.7% to around **$80.66 per barrel on hopes for renewed U.S.–Iran peace talks, carrying the inflation signal with it.
Equity volatility, meanwhile, stayed subdued, with the VIX closing last week near 16 – a picture of complacency rather than stress.
And beneath the calm surface, breadth was narrow: the index gains leaned on a handful of mega-cap names rather than broad participation.
Together, these moves are internally consistent with a growth-with-higher-for-longer configuration – not a clean risk-on melt-up, and not a risk-off flight to safety, but something in between, with rates in the driver's seat.
The Divergent Signal: Why Equities Rose Anyway
There is a genuine counter-current worth naming: equities have been rising even as rates stay hawkish.
The S&P 500 closed last week at 7,489.72, up 0.7%, and futures pointed higher to start the new week.
That is not noise – it reflects the AI-earnings leadership that has repeatedly overridden macro fear this year, most recently as hyperscaler cloud results reignited the growth trade.
It matters because it shows the market is willing to pay for a capacity-constrained AI build-out even against a rising discount rate.
But it does not dominate the cluster, for two reasons: the leadership is narrow, concentrated in a few platform giants rather than broad, and it does not reverse the rate signal – yields did not fall when equities rose.
In other words, growth is climbing the wall of higher rates, not dismantling it.
Structural Implications
The key distinction is between repricing and positioning.
The move in long-end yields looks like a durable repricing of the rate path – driven by policy and inflation risk – rather than a short-term positioning wobble that quickly mean-reverts.
That points to a higher-for-longer liquidity regime in which financial conditions stay tighter for longer, and in which the market's tolerance for rich valuations depends on earnings continuing to deliver.
The tilt is best described as risk-on in appearance but defensive underneath: indices climb, but on narrowing breadth and with rate-sensitive groups lagging.
Concentration, rather than broadening participation, is the defining feature.
None of this is a forecast – it is a description of the regime the current data implies, and of the tension the market is carrying: higher rates on one side, resilient mega-cap earnings on the other.
Portfolio Context
Different investors may read this configuration differently, and none of the following is guidance.
Growth-oriented investors may focus on whether earnings strength can keep outrunning a rising discount rate – the condition that has sustained mega-cap leadership.
More defensively minded investors may pay closer attention to the rate-sensitive groups that a higher-for-longer path tends to pressure, and to the breadth question.
Balanced portfolios often treat a regime like this as a reminder to understand their own sensitivity to rates and to concentration, rather than to react to any single headline.
The educational point is the same for all three: in a rates-led tape, knowing how each holding responds to the discount rate typically matters more than the daily direction.
The Bigger Picture
Does this reinforce the current macro regime or introduce new tension?
Mostly the former.
A hawkish Fed, long-end yields at multi-year highs, and a live geopolitical inflation risk all point in the same direction – higher-for-longer – and this week's data (ISM and Friday's jobs report) will test, not overturn, that framing.
The newer tension is subtler: equities are climbing over a bond market that is signalling caution, and that gap between a hawkish rate complex and a resilient tape can persist longer than it seems it should – until a data point forces the two to reconcile.
For now, rates remain in control, and the market is waiting to hear what the numbers say.
Related Reading
How to Identify Macro Regimes with AI : https://www.breakoutbulletin.com/article/how-to-identify-macro-regimes-ai
Interpret Fed Statements & Macro News with AI : https://www.breakoutbulletin.com/article/ai-fed-statement-macro-analysis
Yield Curve Moves & Sector Impact with AI : https://www.breakoutbulletin.com/article/analyze-yield-curve-sector-impact-ai
Volume & Market Breadth with AI : https://www.breakoutbulletin.com/article/analyze-volume-market-breadth-ai
Disclaimer
BreakoutBulletin publishes educational and analytical content only. Nothing here is investment, financial, legal, or tax advice, or a recommendation or solicitation to buy, sell, or hold any security. Market data reflects information available as of the publication date and is drawn from public sources; figures may be revised. Past performance does not indicate future results. Readers should conduct their own research and consult a qualified, registered financial adviser before making any decision.