
BreakoutBulletin | Trading Education
Educational commentary only. Not investment advice. Past performance does not guarantee future results.
Master the Market: The 5-Cluster Framework for Trading Setups
TL;DR - May 2026 Snapshot
Regime Score 2 (VIX 16.99, SPY above 20-day SMA, A/D line borderline). Trade half-size.
Best setups right now: VWAP bounces, EMA support bounces, Grade-A cup & handle with volume confirmation.
Momentum setups require 75%+ above-average volume before entry.
Options premium selling is selectively viable – start with Theta Decay in elevated-IV-rank names.
Full learning path below if you want to master the framework behind these calls.
The Market Context That Shapes Every Setup in This Guide
As of May 2026, the US equity market is operating in a selective risk-off environment characterised by moderate volatility and directional uncertainty. The VIX spot rate is 16.99, while 15-day May futures are pricing at 14.87 – an upward-sloping term structure that signals the market is pricing a mild increase in near-term uncertainty rather than an immediate resolution of current concerns. This configuration places the current environment at regime score 2: above the full risk-on threshold of VIX below 15 but below the risk-off danger zone of VIX above 20.
The practical implication for every setup in this guide: the current environment favours high-conviction, pattern-specific setups with scaled-in position sizing rather than aggressive full-portfolio momentum. Regime score 2 is not a reason to sit on the sidelines – it is a reason to be selective. Classic setups (VWAP bounces, support levels, cup and handle) are the preferred vehicle. Momentum setups (gap and go, pocket pivot) require additional confirmation before entry. Options premium selling is selectively viable at current IV levels.
This calibration – framework applied to current conditions – is what separates this guide from every competitor in the trading education space. The setups are not presented as timeless patterns that work in all conditions. They are presented as tools that work under specific market conditions, sized appropriately, entered with measurable criteria, and exited with rules rather than emotion.
What This Guide Covers and How to Use It
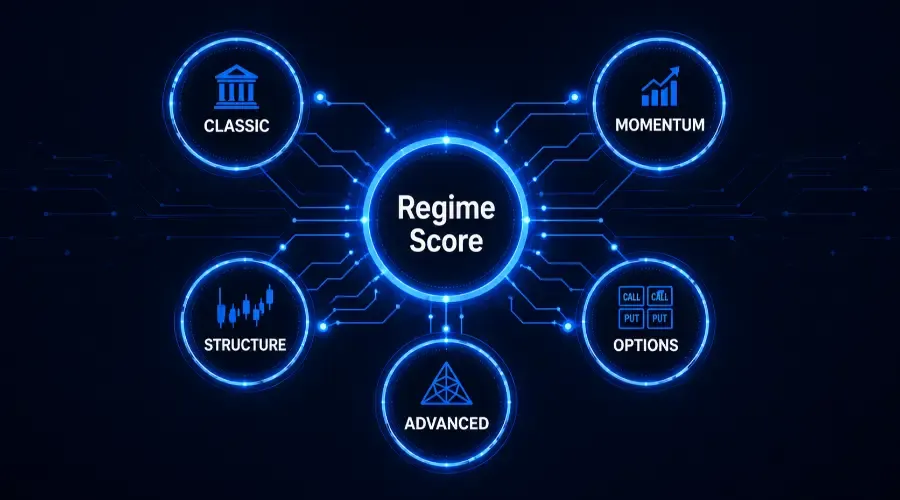
This is the master reference for BreakoutBulletin’s complete Trading Setups and Patterns architecture – five clusters, nineteen individual setup guides, and the cross-cluster frameworks that connect them. It is designed to be used in two ways.
Think of it as both a curriculum and a quick-reference tool. As a learning path, you read the clusters in sequence – Classic first, Momentum second, Options third, Structure fourth, Advanced fifth. Each cluster builds the analytical vocabulary the next one needs. The Classic cluster installs the entry mechanics, regime filtering, and position sizing fundamentals. Every subsequent cluster assumes that foundation.
If you already know what you’re looking for, use the setup index below to jump straight to the setup that matches your current market observation.
New to trading? → Start with our 3-Day Bootcamp Path (step-by-step reading order, no jargon).
Already trading? → Jump straight to the Current Regime Playbook to see exactly which setups are actionable today.
The frameworks embedded across this architecture – the Regime Classification Model, the Participation Heatmap, the Conviction Scoring System, the Volume Progression Model, the IV Rank Filter – are BreakoutBulletin’s proprietary analytical layers. They do not replace individual setup mechanics. They are the systematic conditions that tell you when a setup’s edge is most reliably present.
The Four-Layer Framework: How Every Setup Is Analysed
Every setup in this architecture runs through the same four analytical layers. Understanding these before you read any individual guide accelerates everything.
Layer One – Macro and Regime Context
Three measurements determine the regime score:
SPY above 20-day SMA → 1 point
VIX below 20 → 1 point
NYSE Advance-Decline line positive → 1 point
Score 3: Full size – all setups viable (1% risk per trade)
Score 2: Half size – Classic setups preferred, Momentum requires extra confirmation (0.5% risk per trade)
Score 1: Paper trade only – no real capital deployed in directional setups (0.25% risk per trade)
Score 0: No new positions – capital preservation priority (0% risk)
Current May 2026 score: 2. With SPY trading comfortably above its 20-day SMA (around 720 vs. a SMA near 672), the broader uptrend is intact. VIX at 16.99, however, keeps us in a half-size, selective posture.
Layer Two – Sector Context
The Participation Heatmap identifies which sectors are receiving institutional capital flows. A Grade A setup in a sector under distribution is a Grade B trade at best.
Layer Three – Setup Quality
Grade A: All criteria met without exception. Maximum size at current regime score.
Grade B: Most criteria met – one element marginal. Half of Grade A size.
Grade C: Recognisable but multiple borderline. Paper trade or skip.
Layer Four – Volume Confirmation
Volume is the institutional participation signal. Every setup requires volume confirmation appropriate to the stock’s market capitalisation tier:
Large-cap (>$10B): 40%+ above 50-day average on breakout day
Mid-cap (2B–10B): 50%+ above 50-day average
Small-cap (<$2B): 75%+ above 50-day average
Volume below these thresholds does not confirm the setup regardless of how technically precise the pattern appears. Retail participation without institutional volume is the most common fakeout condition in this architecture.
The Complete Setup Index
Classic Trading Setups Cluster
Primary condition: Regime score 2–3. Best environment: low‑to‑moderate volatility, sector leadership confirmed.
VWAP Bounce Strategy
The intraday mean-reversion framework for stocks pulling back to the session's Volume Weighted Average Price with institutional volume support. Primary vehicle in regime score 2 environments. Backtest data: n=1,247 SPY setups January 2023-December 2025. Grade A win rate at regime score 3: 68%. At regime score 2 (current): 59%.
→ Complete VWAP Bounce Guide
Support and Resistance Bounce
The foundation of technical trading - identifying Grade A support levels where institutional buyers have historically stepped in, and entering on the first test with volume confirmation. Level Quality Grading system ranks each support level from A (three or more prior tests, round number, high volume on establishment) to C (single test, unclear level). Current market relevance: support bounces at major moving averages are the primary trade in the current score 2 environment where breakouts are less reliable.
→ Complete Support and Resistance Guide
Pullback Trading Strategy
The trend-continuation framework using Fibonacci retracement levels (38.2%, 50%, 61.8%) to identify high-probability re-entry points in established uptrends. Requires the primary trend to be intact - defined as price above all three major EMAs (20, 50, 200-day). At regime score 2, pullback entries on the 50% retracement are the highest-probability configuration because deeper pullbacks (61.8%) suggest trend weakness rather than healthy consolidation.
→ Complete Pullback Trading Guide
Cup and Handle Pattern
The O'Neil CANSLIM-derived base pattern requiring minimum 6-week cup duration, 15-33% cup depth, U-shaped base, and pre-breakout RS line at new highs. The highest-conviction breakout pattern in the Classic cluster when Grade A criteria are met. Base One configurations outperform Base Two or later - each successive base in the same stock reduces the breakout success rate. Fundamental quality requirements (34%+ earnings growth, rising institutional ownership) are non-negotiable for Grade A classification.
→ Complete Cup and Handle Guide
Moving Average Bounce Setups
The framework for trading bounces off the four primary EMAs (8, 21, 50, 200-day) with specific entry mechanics, volume requirements, and stop placement for each EMA type. The 50-day EMA bounce is the highest-probability configuration in the current regime score 2 environment — it occurs after a meaningful pullback in an established trend rather than a minor intraday dip.
→ Complete Moving Average Bounce Guide
Trendline Drawing and Trading
The skill-building guide for identifying valid trendlines (minimum two anchor points, third-point confirmation, appropriate angle) and trading bounces and breaks with measurable entry criteria. The diagnostic table in this guide covers the five most common trendline errors that produce fakeout entries - the failure mode analysis that no competitor guide provides.
→ Complete Trendline Guide
Consolidation Breakout Strategy
The flat base and tight consolidation framework identifying breakouts from 3-8 week ranges with volume surge confirmation. The sequence story - accumulation within the range followed by the breakout candle followed by the retest — distinguishes genuine institutional breakouts from retail-driven fakeouts. Current market note: in the score 2 environment, breakouts require the higher end of the volume threshold (50%+ above average for large-caps) before full entry.
→ Complete Consolidation Breakout Guide
Double Bottom Pattern
The reversal structure requiring two lows at approximately equal price levels with a volume signature on the second low that exceeds the first. The three-act narrative - first decline, failed recovery, second test, volume confirmation - is the psychological sequence that produces the pattern's edge. The neckline breakout on above-average volume is the entry trigger, not the second low itself.
→ Complete Double Bottom Guide
Round Number Support Levels
The behavioural finance framework for trading support and resistance at psychologically significant price levels (50,50,100, 150,150,200 and their subdivisions). Round numbers concentrate option strikes, stop orders, and institutional limit orders simultaneously - creating self-fulfilling support that is measurably stronger than arbitrary technical levels. Backtest data confirms round number bounces outperform equivalent non-round-number support levels by approximately 23% on a success rate basis.
→ Complete Round Number Guide
→ Classic Trading Setups Hub - All Nine Classic Setups
Momentum Trading Setups Cluster
Primary condition: Regime score 3 preferred. At score 2 (current): high‑conviction entries only, additional volume and sector confirmation required.
Gap and Go Strategy
The opening range momentum framework for stocks that gap significantly at the open and continue in the gap direction on expanding volume. The 10 AM cutoff rule - the most important timing discipline in the gap and go framework - eliminates the majority of fakeout entries. Backtest data: n=623 qualifying setups. At regime score 2, gap and go entries require 75%+ above average volume rather than the score 3 threshold of 50%+.
→ Complete Gap and Go Guide
Volume Breakout Strategy
The volume surge framework using the Volume Rate of Change (VROC) indicator to identify breakouts driven by institutional participation rather than retail momentum. The VROC formula - ((Current Volume − Volume N Sessions Ago) ÷ Volume N Sessions Ago) × 100 - quantifies the acceleration in participation that distinguishes sustainable breakouts from one-day events.
→ Complete Volume Breakout Guide
Continuation Pattern Setups
The comparative catalogue of eight continuation patterns - flags, pennants, ascending triangles, rectangles, bull flags, bear flags, cup bases, and tight consolidations - with a comparative table measuring each pattern across eight dimensions: duration, depth, volume signature, success rate, and regime condition. The pattern selection framework tells you which continuation structure to prioritise given the current market condition.
→ Complete Continuation Patterns Guide
Early Mover Strategy
The information cascade framework for identifying stocks moving before the broad market recognises the catalyst. The positioning philosophy - why getting in early produces asymmetric returns - and the practical screening methodology for identifying early movers during pre-market and the first 30 minutes of regular trading.
→ Complete Early Mover Guide
Early Relative Strength Setup
The five-step screening methodology for identifying stocks showing relative strength versus the sector and index before they break out - the institutional accumulation signal that precedes the majority of significant momentum moves. Free tools implementation using TradingView and Finviz. Current market relevance: in the score 2 environment, early relative strength is the highest-quality momentum signal available - stocks holding up better than peers during market weakness are being accumulated by institutions who know something the market does not yet reflect.
→ Complete Early Relative Strength Guide
Pocket Pivot - Gil Morales Method
The institutional accumulation signal identified by Gil Morales and Chris Kacher - a specific volume threshold (today's volume exceeding any down-volume day in the prior ten sessions) that identifies buying within a base before the breakout. The Morales attribution and methodology are presented precisely as defined in the original framework. The pocket pivot is the pre-breakout entry that gives BreakoutBulletin readers a position before Stage Three volume confirmation makes the setup visible to everyone.
→ Complete Pocket Pivot Guide
Accelerating Volume Setup
The three-stage volume progression model - Stage One quiet accumulation, Stage Two building volume, Stage Three explosive breakout - that precedes every major institutional-driven move. The five-session rolling average and VROC measurements that identify Stage Two before the Stage Three breakout makes it obvious. The deceleration warning section - equally important as the acceleration identification - provides the exit signal when the institutional buying program is reducing intensity.
→ Complete Accelerating Volume Guide
Power Momentum Setup
The cross-cluster synthesis tool and the capstone of the Trading Setups and Patterns architecture. The four-factor conviction scoring system (Macro/Regime, Sector Leadership, Setup Quality, Volume Conviction) produces a score from 0-8 that directly determines position size - 2× standard at score 8, 1.5× at score 7, down to 0.5× at score 4 or below. At the current regime score 2, the maximum achievable conviction score is 7 out of 8 - macro caps at 1 point, the other three factors can reach maximum simultaneously. The seven qualifying setup types, the position sizing multiplier table, and the worked example are in the complete guide.
→ Complete Power Momentum Guide
→ Momentum Trading Setups Hub - All Eight Momentum Setups
Options-Based Setups Cluster
Primary condition: IV rank is the primary filter - replaces regime score as the entry gate for all options setups. Regime score applies as a secondary context layer.
Important: Options involve assignment risk, leverage, and tail‑event exposure. If you are new to options, start with the Theta Decay Setup - it has defined‑risk implementation and works best alongside your directional setup skills. Full trading authority on short strangles or calendars should only come after you can paper‑trade the mechanics and understand how IV crush and early assignment affect P&L.
Earnings Straddle Strategy
The volatility buying framework for earnings events where IV rank is below 30 and the historical average move exceeds the implied move. The Move Ratio (historical average ÷ implied move) above 1.0 is the primary edge confirmation. At IV rank above 70 - the condition under which most retail traders buy straddles - the data shows a 24% win rate. At IV rank below 30, win rate rises to 54% with positive expected value that survives realistic transaction costs.
→ Complete Earnings Straddle Guide
Earnings Strangle Strategy
The lower-cost alternative to the straddle - OTM strikes on both sides calibrated to the stock's historical earnings move distribution. The Strangle Move Ratio (average breakeven required move ÷ historical average move) must be below 1.3 for the structure to have positive expected value. Strike selection methodology using pre-trade historical data only - no forward-looking inputs.
→ Complete Earnings Strangle Guide
Calendar Spreads for Earnings
The IV term structure trade - selling the front-month option (maximum IV crush exposure) and buying the back-month option (less IV crush) at the same strike. Profits when the stock stays near the ATM strike and front-month IV collapses faster than back-month IV. IV differential above 10 volatility points (front minus back) is the primary entry filter. The most operationally complex earnings structure in the cluster - contains a short leg with assignment risk.
→ Complete Calendar Spread Guide
IV Crush Trading Strategy
The premium selling counterpart to the straddle - selling iron condors before earnings when IV rank is above 50 and the Move Ratio is below 0.85. The market systematically overprices the expected earnings move approximately 68% of the time - the premium seller captures this structural overpricing. The iron condor is the primary retail vehicle because it converts unlimited-risk premium selling into a defined-risk structure.
→ Complete IV Crush Guide
Theta Decay Options Setup
The non-event premium selling framework - collecting time value across 30‑45 DTE positions in elevated IV environments with no earnings within the holding period. The triple filter (IV rank above 35, annualised Move Ratio below 0.85, regime score 2‑3) determines entry. The 50% profit rule and 21 DTE management discipline are inseparable from the strategy's positive expected value - the performance data embeds these management rules. Four structures covered: iron condor, cash-secured put, covered call, short strangle.
→ Complete Theta Decay Guide
Earnings Butterfly Spread
The defined-profit, defined-risk single-expiration structure that profits when the stock closes near a specific price target after earnings. The 4:1 maximum reward-to-risk ratio is the highest of any strategy in the options cluster - but requires the stock to close within a narrow band around the centre strike. Optimal at IV rank 50‑65 (moderate IV) with Move Ratio below 0.80. The 20% breakeven win rate - the lowest required win rate of any strategy in the cluster - makes the butterfly structurally unique.
→ Complete Earnings Butterfly Guide
IV Extremes - When to Sell Premium
The macro-level premium selling strategy triggered by market-wide VIX extremes rather than individual stock IV rank. VIX percentile above 75th combined with VIX term structure in backwardation (VIX9D above VIX3M) is the entry signal. The regime paradox resolution - this strategy is designed specifically for regime score 0‑1 environments that the theta decay strategy avoids - is the post's central analytical contribution.
→ Complete IV Extremes Guide
→ Options‑Based Setups Hub - All Seven Options Setups
Market Structure Cluster
Primary condition: Regime score 2–3. Structure setups are the foundational reading skill - prerequisite to every other cluster.
Higher Highs and Higher Lows
The primary definition of an uptrend - each successive swing high exceeds the prior swing high, and each successive swing low is higher than the prior swing low. The HH/HL pattern is not a trading setup in isolation - it is the structural context that confirms whether a stock is in a position to take on directional long exposure. Every Classic and Momentum setup in this architecture assumes the broader HH/HL structure is intact before entry.
→ Complete Higher Highs and Higher Lows Guide
Lower Highs and Lower Lows
The bearish structural counterpart - each successive swing high is lower than the prior, and each successive swing low is lower than the prior. The LH/LL pattern is the exit signal for existing long positions and the structural prerequisite for short setups. Identifying the transition from HH/HL to LH/LL - the Change of Character (CHoCH) - is the most valuable structural reading skill in the entire cluster.
→ Complete Lower Highs and Lower Lows Guide
Range‑Bound Trading Strategy
The mean-reversion framework for stocks oscillating between defined support and resistance without making new highs or lows. Range-bound conditions produce the opposite trading approach from trending conditions - sell near resistance, buy near support, exit before the level rather than at it. Identifying when a range is genuine versus when it is a consolidation before a breakout requires the volume analysis framework from the Classic cluster.
→ Complete Range‑Bound Trading Guide
Triangle Chart Patterns
The comparative guide to ascending, descending, and symmetric triangles - three structurally distinct patterns with different directional implications. The ascending triangle's flat top with rising lows signals accumulation. The descending triangle's flat bottom with falling highs signals distribution. The symmetric triangle's converging trendlines signals compression before expansion in either direction. Volume behaviour during formation distinguishes the genuine from the false.
→ Complete Triangle Patterns Guide
Wedge Patterns
The rising and falling wedge framework - counter-trend consolidation patterns that resolve in the opposite direction of their slope. The rising wedge in an uptrend signals exhaustion - each new high is made on less momentum. The falling wedge in a downtrend signals capitulation - each new low is made on declining volume and momentum. Both wedge types have specific volume signatures that confirm the pattern before the breakout.
→ Complete Wedge Patterns Guide
Ascending Channel Strategy
The parallel trendline framework for trading within an established uptrending channel - buying pullbacks to the lower channel boundary and managing positions toward the upper boundary. The channel is valid only when both the upper and lower trendlines have at least two confirmed anchor points. Ascending channel trading is the structured alternative to the momentum approach - lower risk, lower reward, higher probability of profit in trending markets.
→ Complete Ascending Channel Guide
Descending Channel Breakout
The breakout setup from a downtrending parallel channel - identifying when the upper channel boundary is decisively broken on above-average volume, signalling a potential trend reversal. The descending channel breakout is the most reliable reversal signal in the Structure cluster because the pattern's lower highs and lower lows are structurally defined - the breakout above the upper boundary is an objective, measurable event rather than an interpretation.
→ Complete Descending Channel Guide
→ Market Structure Hub - All Seven Structure Setups
Advanced Setups Cluster
Primary condition: Regime score 2–3. Advanced setups require proficiency in the Classic and Structure clusters before application - they add analytical layers, not entry mechanics shortcuts.
Fibonacci Retracement Levels
The mathematical framework derived from the Fibonacci sequence - specifically the 38.2%, 50%, and 61.8% retracement levels - that identifies high-probability support and resistance zones within a trend. The institutional use case is documented: large funds use Fibonacci levels to set limit orders when accumulating or distributing positions. When Fibonacci levels align with moving averages, round numbers, or prior structure levels, the confluence creates stronger support than any single indicator alone. TSLA's recent rejection at the 61.8% retracement of the prior swing confirms the level's current market relevance.
→ Complete Fibonacci Retracement Guide
Harmonic Patterns
The four-pattern comparative catalogue - Gartley, Bat, Butterfly, and Crab - each defined by specific Fibonacci ratios across five price points (X, A, B, C, D). Harmonic patterns are the most precisely defined technical structures in existence - every ratio is specific and measurable. The Potential Reversal Zone (PRZ) at point D is where the pattern completes and the trade is entered. No harmonic pattern is valid unless every ratio is within the defined tolerance. Approximate harmonics are not harmonics.
→ Complete Harmonic Patterns Guide
Elliott Wave Theory - Practical Guide
The practical application framework for Elliott Wave - not the theoretical debate about wave counts, but the specific, actionable rules that make Wave analysis a trading tool rather than a retrospective exercise. The three non-negotiable rules (Wave 2 cannot retrace more than 100% of Wave 1, Wave 3 cannot be the shortest impulse wave, Wave 4 cannot overlap Wave 1 in price) eliminate the majority of invalid counts before they are acted on. The A-B-C correction identification framework is the most immediately applicable element for retail traders.
→ Complete Elliott Wave Guide
Market Profile Trading Strategy
The institutional market structure tool translated into retail-accessible language - TPO (Time Price Opportunity) charts, Value Area (the 70% of volume range), Point of Control (the single price with the most volume), and Initial Balance. Market Profile is not a pattern recognition tool - it is a volume distribution tool that shows where the market found acceptance and where it did not. The Value Area High and Value Area Low are the most actionable levels for retail traders without full Market Profile software.
→ Complete Market Profile Guide
Order Flow Analysis for Retail Traders
The institutional capital flow reading framework translated from professional trading tools into retail-accessible methodology. Order flow analysis reads the actual buying and selling pressure behind price movement - not lagging indicators, but the real-time imbalance between aggressive buyers and sellers. The retail-accessible version uses volume delta (up-volume minus down-volume), bid-ask absorption patterns, and large print identification to approximate the institutional order flow data that professional traders access through Level 2 and Time and Sales feeds.
→ Complete Order Flow Guide
→ Advanced Setups Hub - All Five Advanced Setups
The Cross-Cluster Framework: How the Five Clusters Connect
The five clusters are not separate libraries. They’re layers of a single analytical framework, applied at increasing depth.
For new traders, the recommended reading order is:
Structure cluster first – before you trade a single setup, you need to read whether the stock is trending higher (HH/HL), trending lower (LH/LL), or stuck in a range.
Classic cluster second – this installs the entry mechanics, regime filtering, and position sizing that every other cluster expects you to know.
Momentum cluster third – higher-velocity conditions, built squarely on the Classic foundation.
Options cluster fourth – a parallel tool for those who’ve already locked in directional setup identification.
Advanced cluster fifth – extra confirmation layers that raise conviction, not replacements for the basics.
The Power Momentum setup is where all five clusters converge, using the four-factor conviction scoring system to unify macro, sector, setup quality, and volume into a single trade-size decision.
Position Sizing: The Universal Rule Across All Setups
Base formula: Shares = (Account × Risk%) ÷ Stop Distance
Risk percentage by regime score:
Score 3: 1% | Score 2: 0.5% | Score 1: 0.25% | Score 0: 0%
Power Momentum multiplier (conviction score 7-8): 1.5× at score 7, 2× at score 8.
At current regime score 2, maximum effective risk per trade = 0.5% × 1.5 = 0.75%.
The May 2026 Regime Read: How to Apply This Guide Right Now
VIX at 16.99. May futures at 14.87. Upward-sloping term structure. Regime score 2.
Classic setups are the primary vehicle – VWAP bounces, EMA support bounces, Grade-A cup & handle with volume confirmation.
Momentum setups need extra confirmation – 75%+ volume threshold, scaled to 30-40% of intended size.
Options are selectively viable – focus on Theta Decay in highest-IV-rank names.
Structure setups provide the framework for all of the above.
Advanced setups add confirmation layers (for instance, TSLA’s recent rejection at the 61.8% Fibonacci retracement).
The one operational rule for May 2026: Size at half. Enter only Grade A. Wait for volume. The market is constructive enough to trade – not fearful enough to avoid, not bullish enough to press size.
Quick Navigation: All Setups by Cluster
Classic (9): VWAP Bounce · Support and Resistance · Pullback Strategy · Cup and Handle · Moving Average Bounces · Trendline Trading · Consolidation Breakout · Double Bottom · Round Number Support
Momentum (8): Gap and Go · Volume Breakout · Continuation Patterns · Early Mover · Early Relative Strength · Pocket Pivot · Accelerating Volume · Power Momentum
Options (7): Earnings Straddle · Earnings Strangle · Calendar Spreads · IV Crush Strategy · Theta Decay · Earnings Butterfly · IV Extremes
Structure (7): Higher Highs/Higher Lows · Lower Highs/Lower Lows · Range-Bound Trading · Triangle Patterns · Wedge Patterns · Ascending Channel · Descending Channel
Advanced (5): Fibonacci Retracement · Harmonic Patterns · Elliott Wave · Market Profile · Order Flow Analysis
FAQ
Q: What is the most reliable trading setup in 2026?
A: In the current 2026 market regime, Classic Setups like VWAP bounces and EMA support bounces are the most reliable. These perform best when the VIX is between 15 and 20, as they rely on mean-reversion and institutional support levels rather than raw momentum.
Q: How do you calculate a Market Regime Score?
A: A Market Regime Score is calculated using three primary filters: the SPY’s position relative to its 20-day SMA, the VIX level (ideally below 20), and the NYSE Advance-Decline line. A score of 3 indicates full risk-on, while a score of 0 suggests capital preservation.
Q: Why is volume confirmation necessary for momentum trades?
A: Volume confirmation ensures that institutional “big money” is participating in a move. For large-cap stocks, look for volume at least 40% above the 50-day average; for small-cap stocks, this threshold increases to 75% to filter out “fakeouts”.
Q: What is the difference between a Grade A and Grade B setup?
A: A Grade A setup meets every technical and macro criterion without exception, allowing for maximum position sizing based on the current regime score. A Grade B setup may have one marginal element, such as lower volume or weaker sector tailwinds, and should be traded at half the size of a Grade A setup.
BreakoutBulletin | Trading Education. Educational commentary only. Not investment advice. Market data referenced as of May 2026. VIX data sourced from CBOE. All backtest performance data cited within individual setup guides – refer to each guide for full methodology and sample sizes. Past performance does not guarantee future results.