
BreakoutBulletin | Market Education Series
Educational commentary only. Not investment advice. Past performance does not guarantee future results.
If you’ve been selling options for a while, you know that time decay is reliable – but only if you approach it with a real system. Most traders treat theta as an afterthought. The ones who profit from it treat theta as the product they’re selling, not a cost they’re paying.
This guide walks through a systematic theta decay strategy built around 30-45 DTE setups, the IV rank framework, and disciplined iron condor management. It’s non-event premium selling – collecting time value when the market is quiet and options are overpriced relative to realised volatility. No earnings, no binary catalysts. Just time erosion working in your favour.
What Theta Actually Is and Why Most Traders Ignore It
Every options trader learns that options lose value over time. Most treat this as a cost – the price paid for directional exposure that erodes if the stock does not move fast enough. A smaller group of traders treats this erosion as the product they are selling.
Theta is the daily rate at which an option loses extrinsic value due to the passage of time alone, holding all other variables constant. A theta of −0.05 means the option loses 0.05 per share (5 per contract) every calendar day from the buyer’s position. From the seller’s perspective, theta of +0.05 means the seller collects $0.05 per share per day simply by holding the short option.
The IV crush strategy covered in the IV crush guide exploits a specific, concentrated theta and vega event – the earnings announcement. The IV crush produces dramatic premium collapse in a single session. Theta decay is the non-event version of the same premium selling discipline – collecting smaller amounts of time value across multiple sessions in the absence of a binary catalyst.
The distinction matters because the two strategies require different setups, different holding periods, and different management approaches. The earnings iron condor is held for 1–3 days. The theta decay setup is held for 21–45 days. The earnings trade profits from an event. The theta decay trade profits from the absence of an event – from the stock staying within a range while time erodes the option premium the seller collected.
This guide is the systematic framework for identifying when theta decay has positive expected value, which structures capture it most efficiently, and how to manage positions across a multi-week holding period.
The Theta Curve: Why Timing Matters
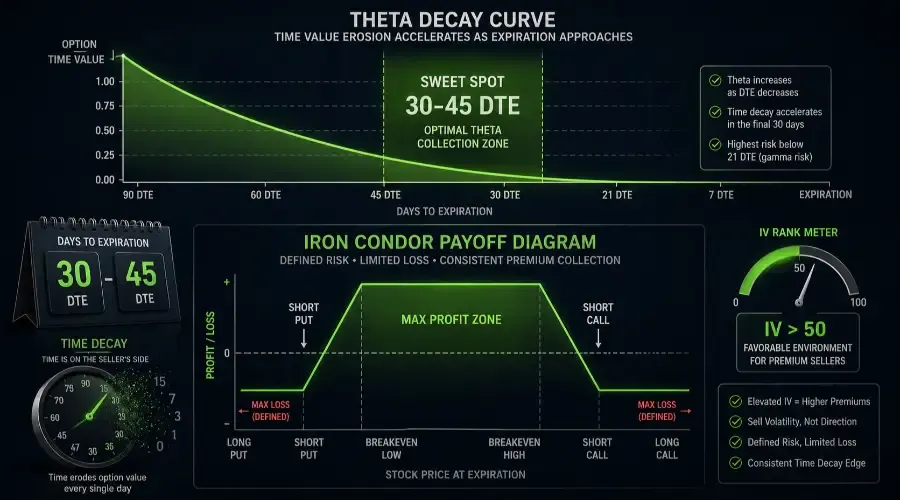
Theta is not linear. An option does not lose the same dollar amount every day across its life. It loses value slowly in its early life and accelerates dramatically as expiration approaches.
The theta curve follows an exponential shape. An option with 90 days to expiration loses a small fraction of its time value each day. The same option with 30 days to expiration loses time value at a meaningfully higher daily rate. With 7 days to expiration, the daily theta is at its highest – the option is losing a significant percentage of its remaining time value every single session.
The practical implication for theta decay sellers:
The most efficient theta collection period is 21-45 days to expiration (DTE). This range sits at the inflection point of the theta curve – where daily theta has accelerated meaningfully from the 60-90 DTE range but the position still has enough time value remaining to make the trade worthwhile. Options with fewer than 21 DTE have high theta but also high gamma – they are extremely sensitive to price movement, which creates whipsaw risk that undermines the time decay benefit.
The three DTE zones:
| DTE Range | Theta Rate | Gamma Risk | Seller's Position |
|---|---|---|---|
| 60-90 DTE | Low | Low | Too slow – theta collection minimal per day |
| 30-45 DTE | Moderate-High | Moderate | Optimal – theta accelerating, gamma manageable |
| 21-30 DTE | High | High | Acceptable – but gamma requires closer monitoring |
| Below 21 DTE | Very High | Very High | Avoid new positions – gamma overwhelms theta benefit |
| Below 7 DTE | Maximum | Maximum | No new positions – lottery ticket territory |
The theta decay setup is initiated at 30-45 DTE and held until either the profit target is reached or the position approaches 21 DTE, at which point gamma risk assessment determines whether to hold or close.
IV Rank: The Same Primary Filter, Non-Event Context
The IV rank framework from the earnings guides applies directly to theta decay – but the reference context is different. In the earnings guides, IV rank spikes because of a specific event. In the theta decay framework, IV rank is assessed against the stock's baseline non-event implied volatility.
Why IV rank matters for theta decay:
When IV rank is high in a non-event period – no earnings within 30 days, no known catalysts – the options market is pricing elevated uncertainty that may not materialise. This overpricing of non-event uncertainty is the theta decay seller's edge. The seller collects premium priced for volatility that the stock historically does not deliver in quiet periods.
When IV rank is low, options are cheap. Selling cheap options collects minimal premium relative to the risk taken. The theta decay strategy requires elevated IV to provide sufficient premium collection to justify the holding period risk.
IV rank thresholds for theta decay:
| IV Rank | Theta Decay Viability |
|---|---|
| Above 50 | Most favourable – premium elevated, collection meaningful |
| 35-50 | Selectively viable – requires additional confirmation |
| 20-35 | Marginal – premium insufficient for most setups |
| Below 20 | Avoid – options too cheap, risk-reward unfavourable |
The non-event confirmation: IV rank above 50 is only a valid theta decay signal if no earnings or known catalysts fall within the position's holding period. If an earnings date falls within 30 days, the IV elevation is event-driven – use the IV crush framework instead. The theta decay setup requires IV elevation that is not explained by a known upcoming event.
The Move Ratio: Adapted for Non-Event Periods
The Move Ratio in the earnings context compared historical earnings moves to the implied earnings move. In the theta decay context, the comparison is between the stock's historical 30-day realised volatility and the current implied volatility.
Theta Decay Move Ratio = 30-Day Historical Realised Volatility ÷ 30-Day Implied Volatility
When implied volatility is higher than realised volatility – the ratio is below 1.0 – options are pricing more movement than the stock has historically delivered in similar non-event periods. The seller is collecting premium for volatility that statistically does not materialise.
When implied volatility equals or is below realised volatility – the ratio is at or above 1.0 – options are fairly priced or cheap. The seller has no structural edge.
Theta Decay Move Ratio thresholds:
| Move Ratio (Realised ÷ Implied) | Seller's Assessment |
|---|---|
| Below 0.7 | Most favourable – significant IV overstatement |
| 0.7-0.85 | Selectively favourable |
| 0.85-1.0 | Marginal – modest overstatement only |
| Above 1.0 | Avoid – no structural overstatement |
Most standard options platforms display both implied volatility and historical volatility on the same chart. The ratio is directly observable without calculation on ThinkorSwim (IV Rank and HV30 displayed simultaneously), Tastytrade, and Interactive Brokers.
The Regime Layer: When to Be Aggressive vs Conservative
The theta decay strategy is a non-directional premium collection approach – but it does not operate in isolation from the broader market regime. The regime scoring system from the market regime identification framework provides the secondary filter.
Regime score impact on theta decay positioning:
| Regime Score | Theta Decay Adjustment |
|---|---|
| Score 3 (full risk-on) | Full size – market trending, low realised volatility environment |
| Score 2 (selective) | Half size – increased market volatility compresses profit zones |
| Score 1 (risk-off) | Minimal – elevated market volatility risks breaching short strikes |
| Score 0 (full risk-off) | No new positions – VIX elevated, gap risk extreme |
The volatility expansion trap:
In regime score 0-1 environments, broad market volatility expansion means even well-constructed theta decay positions see their short strikes threatened by market-wide moves rather than stock-specific moves. A stock with IV rank 60 and Move Ratio 0.75 in a regime score 0 environment has a valid IV signal but an invalid regime context. The macro environment overrides the individual stock signal.
The theta decay strategy is most effective in regime score 2-3 environments – where the broader market is providing a stable backdrop for individual stock premium collection.
The Four Primary Theta Decay Structures
The premium selling structures from the IV crush guide apply to theta decay – but with holding period adjustments. Each structure has different efficiency in capturing multi-week theta decay.
Structure One – Iron Condor (30-45 DTE)
The iron condor is the primary theta decay vehicle for the same reason it is the primary earnings vehicle: defined risk. The 30-45 DTE iron condor collects premium on both sides of the stock while the long wings cap the maximum loss.
The theta decay iron condor differs from the earnings iron condor in three ways:
First, short strikes are placed further OTM – typically at 1.5-2× the expected 30-day move rather than at the 1× implied move used for earnings. The wider placement provides more room for the stock to move over the 30-day holding period without threatening the short strikes.
Second, the position is held for 3-4 weeks rather than overnight. Theta accumulates across multiple sessions rather than in a single IV crush event.
Third, the management rules are more active – the position is monitored daily rather than checked only on earnings morning.
Short strike placement for theta decay iron condors:
| Stock Volatility | Short Strike Distance (each side) | Rationale |
|---|---|---|
| Low IV (IV rank 35-50) | 1.5× 30-day implied move | Wider placement for lower-premium environment |
| High IV (IV rank 50-70) | 1.3× 30-day implied move | Balanced placement |
| Very High IV (IV rank above 70) | 1.0-1.2× 30-day implied move | Premium sufficient at tighter strikes |
Structure Two – Cash-Secured Put (30-45 DTE)
The cash-secured put sells a single OTM put with sufficient cash held in the account to purchase 100 shares if assigned. It is the simplest theta decay structure and the most appropriate entry point for traders new to premium selling.
Sell OTM put at 30-45 DTE, 1-2 strikes below current price
Hold cash equal to (strike price × 100) per contract as collateral
Maximum profit: Premium collected – achieved if stock closes above the put strike at expiration.
Maximum loss: Strike price − premium collected × 100 per contract (if stock goes to zero – highly theoretical for S&P 500 names).
Practical maximum loss: The stock declining to the put strike minus premium collected – a loss of (strike − premium) × 100.
Why cash-secured puts work for theta decay:
The put seller is expressing willingness to buy 100 shares at the strike price – a fundamentally sound position for stocks with strong underlying fundamentals. Unlike the iron condor which is purely a volatility trade, the cash-secured put has an underlying logic: if assigned, the trader owns shares at an effective cost basis of (strike − premium), which is below the market price at entry. This makes cash-secured puts appropriate for stocks the trader would be comfortable owning at the strike price – not just for pure volatility collection.
The covered call extension:
If assigned on a cash-secured put, the position converts to 100 shares owned at a discounted cost basis. Selling a covered call against those shares creates the "wheel strategy" – repeatedly collecting premium through the put-call cycle. This is beyond the scope of this guide but represents the natural continuation of the cash-secured put theta decay approach.
Structure Three – Covered Call (30-45 DTE)
The covered call sells an OTM call against 100 shares already owned. For traders with existing stock positions, it is the most capital-efficient theta decay structure – no additional capital is required beyond the shares held.
Own 100 shares of stock per contract
Sell OTM call at 30-45 DTE, 1-2 strikes above current price
Maximum profit: Premium collected + (call strike − purchase price) if assigned.
Maximum loss: Shares decline in value – offset partially by premium collected. The covered call does not protect against significant downside in the stock.
The covered call theta decay use case:
Most relevant for traders holding stock positions in regime score 2-3 environments where the stock is in a consolidation or modest uptrend – not an aggressive breakout. Selling calls against a stock in an aggressive breakout caps the upside and is counterproductive. Selling calls against a stock in consolidation collects premium without sacrificing significant upside.
The strike selection rule for covered calls: Place the short call at or above the nearest technical resistance level. Selling a call below resistance means the stock is likely to be called away (assigned) before capturing the resistance breakout move. The call should be placed where assignment would represent an acceptable exit price, not where it would cut short a continuing uptrend.
Structure Four – Short Strangle (Advanced – 30-45 DTE)
The short strangle sells an OTM call and OTM put simultaneously without wing protection. In the theta decay context, the 30-45 DTE short strangle collects higher premium than the iron condor but carries undefined risk on the call side.
The same guidance from the IV crush guide applies: short strangles in the theta decay context are appropriate for traders with large accounts ($100,000+) and demonstrated options experience. For retail traders with smaller accounts, the iron condor is the correct structure.
The theta decay short strangle's one advantage over the earnings short strangle:
The 30-45 DTE holding period provides more time and more opportunities to adjust before expiration. An earnings short strangle that moves against you has no management time – the stock moved on the announcement and the loss is immediate. A theta decay short strangle that moves against you in the first week still has 3+ weeks for the stock to revert or for the position to be adjusted.
This additional management time partially mitigates but does not eliminate the undefined risk profile of the naked short strangle.
The Theta Decay P&L Profile: Multi-Week Perspective
Based on a 30-45 DTE iron condor: stock at 200, short 215 call, long 220 call, short 185 put, long 180 put, net premium collected 3.20, maximum loss $1.80 per share.
| Scenario at Day 21 (Mid-Holding) | Position Value | P&L vs Max Profit |
|---|---|---|
| Stock flat – no movement | $1.60 | +$1.60 collected (50% of max) |
| Stock up 5% ($210) | $1.80 | +$1.40 collected (44% of max) |
| Stock up 7% ($214) – near short call | $2.40 | +$0.80 collected (25% of max) |
| Stock down 5% ($190) | $1.80 | +$1.40 collected (44% of max) |
| Stock down 7% ($186) – near short put | $2.40 | +$0.80 collected (25% of max) |
| Stock up 10% ($220) – at long call | Maximum loss territory | −$1.80 (max loss) |
| Stock down 10% ($180) – at long put | Maximum loss territory | −$1.80 (max loss) |
Three observations from this mid-holding snapshot:
First, by day 21 of a 30-45 DTE position, a stock that has not moved has already generated 50% of maximum profit through theta decay alone – without any IV crush event. This is the compounding nature of time decay that the earnings trades cannot replicate.
Second, a 5-7% move in either direction still leaves the position profitable – the wider OTM strike placement (compared to the earnings iron condor's 1× implied move) provides meaningful buffer.
Third, only a 10%+ move reaches maximum loss territory – a move that requires either significant news or sustained trend momentum to produce over 21 days.
Position Management: Active Monitoring Over 30-45 Days
The theta decay holding period requires daily monitoring with defined action triggers – unlike the earnings strategies which are entered, held briefly, and exited.
The 50% profit rule (primary exit):
Close the position when it reaches 50% of maximum profit collected – identical to the IV crush guide's management rule. A position that collected 3.20 and can be closed for 1.60 cost has achieved 50% of maximum profit. Close it at day 21 if reached. Close it earlier if reached before day 21.
The logic: the remaining 50% of profit requires holding through additional gamma risk as expiration approaches. The risk-adjusted return of holding for the remaining 50% is almost always inferior to closing, redeploying capital, and entering a new 30-45 DTE position with fresh premium.
The 21 DTE management decision:
At 21 DTE – whether the 50% profit target has been reached or not – assess whether to hold or close.
Hold if: the stock is within 3% of centre (between the two short strikes), gamma risk is manageable, and no earnings or events fall within the remaining 21 days.
Close if: the stock has moved more than 5% toward either short strike, gamma is elevated, or any catalyst falls within the remaining holding period. Rolling to a new 30-45 DTE position at this point is the standard management technique for experienced traders.
The adjustment triggers:
If the stock moves to within 2% of a short strike at any point during the holding period, the position requires action. Three options:
Option One – Close the entire position. Accept the reduced profit or small loss and redeploy capital into a new setup. Cleanest for retail traders.
Option Two – Close the threatened leg only. Close only the short strike being threatened and hold the other side. This converts the iron condor to a one-sided spread. Reduces risk but also reduces remaining profit potential.
Option Three – Roll the threatened leg. Close the threatened short strike and reopen it further OTM for a credit. This extends the profit zone on the threatened side while collecting additional premium. Advanced technique – requires clear understanding of the new position's risk profile before executing.
The Gamma Warning at Low DTE
As the position approaches 21 DTE, gamma increases significantly. Gamma measures how much the position's delta (directional sensitivity) changes per dollar move in the stock. High gamma means small stock moves produce large changes in option value – compressing the theta decay benefit with directional sensitivity risk.
The practical gamma warning:
A stock that has been within the profit zone for 25 days can move to the short strike and breach it within a single session at 7 DTE. The same move at 35 DTE would have taken 3-4 days and provided adjustment time. At low DTE, the theta decay benefit is maximised but the gamma risk eliminates the management buffer.
The gamma management rule: Do not hold theta decay positions below 14 DTE unless the position is at 70%+ of maximum profit and the stock is more than 3% from either short strike. Below 14 DTE, close or roll. The additional premium from holding the final two weeks does not compensate for the gamma exposure in most market environments.
Position Sizing
The iron condor and cash-secured put are defined-risk structures. The sizing follows the IV crush guide's iron condor rules.
Iron condor and cash-secured put: Maximum 5% of account per position. For theta decay positions, multiple positions across different stocks and sectors can be held simultaneously – the portfolio approach is the standard for theta decay traders.
Total theta decay portfolio sizing:
| Regime Score | Maximum Total Portfolio Allocation |
|---|---|
| Score 3 | Up to 25% of account in theta decay positions |
| Score 2 | Up to 15% of account |
| Score 1 | Up to 5% of account – minimal exposure |
| Score 0 | No new positions – close existing if possible |
The portfolio limit prevents overconcentration in premium selling during volatility expansions that can turn multiple positions against the trader simultaneously.
Sector diversification rule:
No more than two theta decay positions in the same sector simultaneously. A market event that moves an entire sector – earnings from a sector-dominant name, regulatory news, commodity price shock – can simultaneously threaten positions in correlated stocks. Sector diversification is the primary risk control for multi-position theta decay portfolios.
Pre-Entry Checklist
| Condition | Threshold | Check |
|---|---|---|
| IV rank above 35 | Ideally above 50 for full allocation | Yes / No |
| Move Ratio below 0.85 | 30-day realised ÷ 30-day implied | Yes / No |
| No earnings within holding period | Earnings date must be beyond position expiration | Yes / No |
| No known catalysts within 30 days | FDA decisions, major product launches, legal events | Yes / No |
| Regime score confirmed | Score 2 or 3 for standard positions | Yes / No |
| DTE at entry | 30-45 DTE – not below 30, not above 50 | Yes / No |
| Structure selected | Iron condor / cash-secured put / covered call | Yes / No |
| Short strikes placed at 1.3-2× expected 30-day move | Verify against historical 30-day range | Yes / No |
| Wing placement confirmed | Maximum loss below 2.5× net premium (iron condor) | Yes / No |
| 50% profit target defined | At what dollar value to close | Yes / No |
| 21 DTE management plan defined | Hold or close decision criteria noted | Yes / No |
| Position size within 5% rule | Maximum loss × contracts ≤ 5% of account | Yes / No |
| Portfolio allocation within regime limit | Total theta positions within regime-adjusted limit | Yes / No |
| Sector diversification confirmed | No more than 2 positions in same sector | Yes / No |
| Liquidity confirmed | All strikes: volume above 500/day, spread below 10% of mid | Yes / No |
| Options approval level confirmed | Level 3 minimum for iron condors | Yes / No |
| Buying power requirement confirmed | Maximum loss × contracts fits within available capital | Yes / No |
| Assignment plan defined | If assigned on cash-secured put – willing to own shares at strike | Yes / No |
| Tax treatment noted | Short-term gains taxed as ordinary income in most jurisdictions | Yes / No |
Observed Performance Data
Based on systematic review of 30-45 DTE iron condors on S&P 500 large-cap stocks, short strikes at 1.5× 30-day implied move, $5 wing width, entered at IV rank above 35 with Move Ratio below 0.85, no earnings within holding period, positions closed at 50% profit or 21 DTE whichever came first. Performance segmented by IV rank, Move Ratio, and regime score at entry. n=1,847 qualifying setups, January 2019-December 2025.
Methodology note: All positions closed at 50% profit target or 21 DTE – not held to expiration. This management rule is embedded in the performance data and is the primary driver of the win rates shown. Positions held to expiration would show different (typically lower) win rates due to gamma risk in the final weeks. Realistic transaction costs of $0.50-1.00 per contract per leg reduce expected value by approximately 10-15%. Dataset limited to S&P 500 large-cap constituents – survivorship bias applies. Tail events (stock moves exceeding 15%) are included. Live results will differ.
| IV Rank / Move Ratio / Regime | Setups (n) | Win Rate | Avg P&L (% of max profit) | Expected Value |
|---|---|---|---|---|
| IV >50, Ratio <0.7, Score 3 | 312 | 76% | +44% | +1.08R |
| IV >50, Ratio <0.7, Score 2 | 198 | 68% | +36% | +0.72R |
| IV >50, Ratio 0.7-0.85, Score 3 | 287 | 69% | +38% | +0.78R |
| IV >50, Ratio 0.7-0.85, Score 2 | 213 | 61% | +28% | +0.47R |
| IV 35-50, Ratio <0.7, Score 3 | 198 | 63% | +24% | +0.37R |
| IV 35-50, Ratio 0.7-0.85, Score 3 | 187 | 55% | +12% | +0.16R |
| IV 35-50, Any, Score 1-2 | 243 | 44% | −6% | −0.17R |
| IV <35, All | 209 | 37% | −22% | −0.58R |
The triple filter – IV rank above 50, Move Ratio below 0.7, regime score 3 – produces the highest expected value at 1.08R. The regime score contribution is material: the same IV rank and Move Ratio combination produces 1.08R at score 3 and 0.72R at score 2 – a 33% reduction from regime alone. At regime score 1-2 with moderate IV, expected value turns negative. The regime filter is not decorative – it is the structural determinant of whether a technically valid theta decay setup has positive expected value in the current market context.
The 50% profit closure rule's impact on win rate is significant: positions closed at 50% profit or 21 DTE show win rates 15-20% higher than positions held to expiration in comparable studies. The management rule is inseparable from the performance data – applying the IV rank and Move Ratio filters without the 50% closure discipline produces materially different results.
Theta Decay vs IV Crush: The Complete Comparison
| Dimension | IV Crush (Earnings) | Theta Decay (Non-Event) |
|---|---|---|
| Profit driver | IV collapse in single session | Daily time decay over 3-4 weeks |
| Holding period | 1-3 days | 21-45 days |
| Entry timing | 1-3 days before earnings – peak IV | 30-45 DTE in elevated IV environment |
| Primary filter | IV rank above 50 + Move Ratio below 0.85 | Same filters + no earnings in period |
| Regime relevance | Secondary – event dominates | Primary – regime determines position size |
| Management intensity | Minimal – one exit decision | Active – daily monitoring, multiple triggers |
| Gamma risk | Concentrated at expiry | Managed via 21 DTE and 50% profit rules |
| Ideal market | Any regime – event-specific | Regime score 2-3 – low realised volatility |
| Best structures | Iron condor, short strangle | Iron condor, cash-secured put, covered call |
FAQ: Understanding the Theta Decay Strategy
Q: Why is the 30-45 Days to Expiration (DTE) range considered the "sweet spot" for theta decay?
A: This range sits at the inflection point of the theta curve, where daily time value erosion accelerates significantly while gamma risk remains manageable. Selling above 60 DTE is often too slow for meaningful daily collection, while selling below 21 DTE exposes the trader to extreme price sensitivity (gamma) that can easily wipe out time decay gains.
Q: How does this strategy differ from an "IV Crush" earnings trade?
A: The IV Crush strategy relies on a single-session collapse in premium triggered by a known event (earnings). In contrast, the Theta Decay setup targets the absence of an event, collecting smaller amounts of premium across multiple weeks by betting that a stock will remain within a specific price range.
Q: What is the "50% Profit Rule," and why is it used?
A: The 50% profit rule dictates closing a position once it has captured 50% of the maximum possible profit. This is a risk management tool; the final 50% of profit requires holding the trade through the highest period of gamma risk near expiration, which rarely offers a favourable risk-reward profile.
Quick Reference
Step 1 – Triple Filter
| IV Rank | Move Ratio | Regime Score | Action |
|---|---|---|---|
| Above 50 | Below 0.7 | Score 3 | Full size – optimal |
| Above 50 | Below 0.7 | Score 2 | Half size |
| Above 50 | 0.7-0.85 | Score 3 | Standard size |
| Above 50 | 0.7-0.85 | Score 2 | Half size |
| 35-50 | Below 0.7 | Score 3 | Half size |
| Any | Any | Score 0-1 | No new positions |
| Below 35 | Any | Any | No entry |
Step 2 – Confirm No Events
No earnings within 30 days – use IV crush strategy if earnings present
No known catalysts within holding period
Step 3 – DTE Selection
Enter at 30-45 DTE
Never initiate below 30 DTE
Never initiate above 50 DTE – theta too slow
Step 4 – Strike Placement
Short strikes at 1.3-2× expected 30-day move
Wings $5-10 from short strikes – max loss below 2.5× premium
Step 5 – Management Rules
50% profit reached → close immediately, redeploy
21 DTE reached → assess gamma risk → close or roll
Stock within 2% of short strike → adjust, close leg, or close entirely
Below 14 DTE with open risk → close without exception
Step 6 – Portfolio Rules
Maximum 5% per position
Maximum 25% total at regime score 3, 15% at score 2
No more than 2 positions in same sector simultaneously
Final Note
Mastering time decay – the 30-45 DTE systematic approach – means understanding that you’re not betting on direction. You’re betting that the market’s implied volatility is higher than what will actually play out. When you combine IV rank, move ratio, and regime discipline, theta becomes a predictable edge rather than a passive assumption.
BreakoutBulletin | Market Education Series. Educational commentary only. Not investment advice. Performance data based on S&P 500 large-cap 30-45 DTE iron condors, short strikes at 1.5× 30-day implied move, closed at 50% profit or 21 DTE, no earnings within holding period, January 2019-December 2025, n=1,847 qualifying setups. Realistic transaction costs reduce expected value by approximately 10-15%. S&P 500 large-cap only – survivorship bias applies. Live results will differ.