
| Article | Macro Driver | Stock Group |
|---|---|---|
| Why Rising Interest Rates Hurt Growth Stocks | Interest rates | Rate-sensitive growth (Gryffindor) |
| How a Strong Dollar Affects the S&P 500 | USD strength | Global multinationals (Slytherin) |
| Why Commodity Booms Lift Cyclical Stocks | Commodity cycles | Physical economy cyclicals (Ravenclaw) |
| Defensive Stocks Explained | Risk sentiment | Defensive yield (Hufflepuff) |
| Best Stocks During a Recession | Economic contraction | Recession-resistant positioning |
To apply these macro drivers in real trading, the Market Regime Identification Framework and Daily Market Analysis Framework show how to combine them into a structured daily process.
The Problem Most Retail Traders Quietly Struggle With
The S&P 500 drops 0.8%. Oil jumps 3%. Yields rise. The dollar strengthens. Now what?
Most retail traders freeze. Five hundred companies, a dozen signals, no framework. They check the index, scan their portfolio, skim a few headlines, and react to whichever data point feels most urgent. The result is a decision made on noise rather than structure.
What's missing is a systematic way to connect macro signals to stock behavior. Professional analysts don't approach the market as 500 separate companies. They start with a mental map: a classification of which businesses thrive in each macro environment. Once that map exists, daily market moves stop requiring fresh interpretation each session.
Building that map used to require years on a trading desk. With AI tools like Claude, it now takes a well-structured prompt.
The Idea: A Sorting Hat for Stocks
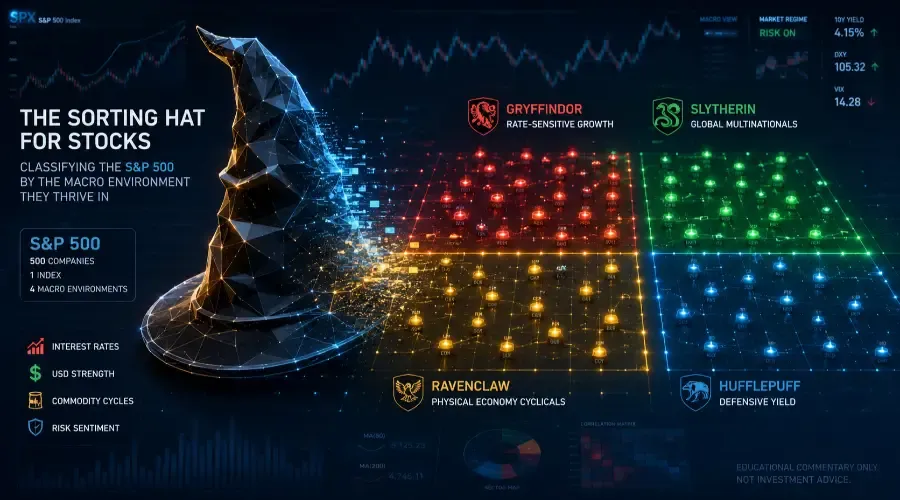
In the Harry Potter universe, the Sorting Hat performs one specific task. It reads a student's character and assigns them to the environment where they will develop most naturally.
Every S&P 500 company has a macro personality that works the same way. Certain economic conditions strengthen a business's revenue, margins, and valuation. Others create headwinds. The Sorting Hat framework asks one question about each company: which macro environment does it naturally belong in?
Four forces shape this classification: interest rates, dollar strength, commodity prices, and risk sentiment. Different companies respond to each of these forces differently, and those differences are consistent enough across cycles to be analytically useful.
The Four Houses of the S&P 500
Most companies in the index fall into one of four macro groups. Some have traits from multiple groups, but the dominant sensitivity is usually clear once you know what to look for.
House Gryffindor: Rate-Sensitive Growth Companies
These are long-duration businesses whose valuations depend heavily on earnings projected years into the future. Technology platforms, software firms, innovative consumer brands, and biotech companies typically fall here. Their valuations compress when rates rise because future cash flows are discounted more heavily. The reverse applies when rates fall.
The interest rate mechanism driving this group is explained in detail in Why Rising Interest Rates Hurt Growth Stocks , including the discount rate table showing how the same future profit stream is worth $82 at a 2% rate and $46 at 8%.
Favorable conditions: Falling bond yields, dovish central bank policy, low inflation.
Difficult conditions: Rate hike cycles, inflation surprises, tightening financial conditions.
AI sorting prompt: "Which S&P 500 companies have the highest valuation multiples and the lowest near-term free cash flow yields?" The names that appear most frequently are typically Gryffindor stocks.
House Slytherin: Global Multinationals
These companies generate a large share of revenue outside the United States. Consumer brands, pharmaceutical companies, industrial exporters, and global technology hardware firms populate this group. Their reported earnings are directly affected by currency translation: when the dollar weakens, foreign revenue converts into more dollars, boosting reported results. When the dollar strengthens, the same volume of international sales produces fewer dollars on the income statement.
The full mechanics, including the three-channel framework (translation, transaction, and economic effects) and the magnitude table, are covered in How a Strong Dollar Affects the S&P 500 .
Favorable conditions: Weak dollar, strong global growth, expanding emerging markets.
Difficult conditions: Strong dollar cycles, U.S.-centric economic expansion, global demand slowdowns.
AI sorting prompt: "Which S&P 500 companies generate more than half of their revenue outside the United States?"
House Ravenclaw: Commodity and Cyclical Companies
These businesses are tied to the physical economy: energy producers, mining companies, industrial manufacturers, logistics networks, and construction materials firms. Their revenue moves directly with global demand for real goods and infrastructure. During commodity booms or economic expansions, earnings can accelerate rapidly because cost bases are largely fixed. A 20% rise in copper prices can translate into a 40% or greater increase in a miner's operating profit through operating leverage.
The supply-lag dynamics that create commodity price spikes, including why new mines take 7 to 10 years to come online, are covered in Why Commodity Booms Lift Cyclical Stocks .
Favorable conditions: Commodity price spikes, manufacturing expansion, infrastructure spending cycles.
Difficult conditions: Recessions, demand shocks, falling commodity prices.
AI sorting prompt: "Which S&P 500 companies show strong revenue correlation with commodity prices or global manufacturing activity?"
House Hufflepuff: Defensive Yield Companies
These are the steady businesses of the market: utilities, telecommunications firms, consumer staples companies, and select healthcare names. They rarely deliver rapid growth, but they offer what institutions value during uncertain periods: predictable cash flows and dividend income. When investors rotate away from risk, capital flows toward these sectors.
Their primary vulnerability is rising interest rates. When government bond yields rise significantly, they compete directly with defensive dividend yields, reducing the relative attractiveness of these stocks. The complete framework for how defensive sectors behave, including the dividend yield arithmetic and the payout ratio thresholds to watch, is in Defensive Stocks Explained .
Favorable conditions: Risk-off markets, recession concerns, falling yields, VIX expansion.
Difficult conditions: Strong economic expansions, rapidly rising interest rates, broad risk-on environments.
AI sorting prompt: "Which S&P 500 companies have dividend yields above 3%, beta below 0.8, and revenue from essential services with stable demand across economic cycles?"
The Hybrids: When Stocks Belong to Multiple Houses
Some companies don't sit cleanly in one group. Apple's valuation behaves like a Gryffindor growth stock, sensitive to interest rates, but its revenue is deeply global, giving it Slytherin's dollar sensitivity. Johnson & Johnson carries Hufflepuff's defensive healthcare stability alongside significant international revenue that responds to currency moves. Caterpillar is a Ravenclaw cyclical with heavy global exposure that adds a Slytherin layer on top.
The analytical question for hybrids is which trait dominates under current conditions. When rates are rising but the dollar is falling, the two forces pull in opposite directions for a company like Apple. Tracking which force is winning, rather than which house the stock technically belongs in, is where the framework produces its most useful output. In practice, macro regimes usually have a dominant force–in a full-blown banking crisis, for example, interest rate sensitivity will almost always override currency translation effects.
The Macro Regime Map
Once companies are sorted, macro conditions become easier to interpret systematically.
| Macro Condition | Favored Group | Mechanism |
|---|---|---|
| Fed cutting rates | Gryffindor (Growth) | Lower discount rates support long-duration valuations |
| Dollar weakening | Slytherin (Multinationals) | Foreign revenue converts into more dollars |
| Risk-off sentiment | Hufflepuff (Defensives) | Investors prioritize stable income over growth |
| Commodity boom | Ravenclaw (Cyclicals) | Producers benefit directly from higher prices |
| Rising rates | Value-oriented cyclicals | Short-duration assets less sensitive to rate moves |
| Strong U.S. growth | Domestic cyclicals | U.S.-centric revenue exposure benefits |
These macro shifts are rarely random. They are often driven by scheduled economic events: central bank meetings, CPI releases, employment reports. Traders can anticipate them using the Economic Calendar Trading Framework . The broader regime context for any given shift is covered in the Market Regime Identification Framework , which classifies the market across four states from full risk-on to full risk-off.
Five AI Prompts That Build the Framework
Prompt 1 – Sector Rate Sensitivity
"Which S&P 500 sectors historically perform best when interest rates are rising versus falling?"
Produces a high-level map of rate sensitivity across the market.
Prompt 2 – Daily Macro Sorting
"Today the 10-year yield rose and oil prices increased. Which sectors typically benefit from this combination?"
Converts macro headlines into sector-level insights without requiring manual cross-referencing.
Prompt 3 – Dollar Exposure Mapping
"Which S&P 500 companies have the highest international revenue exposure?"
Identifies currency sensitivity at the company level in one query.
Prompt 4 – Historical Regime Comparison
"Which historical macro environments resemble current market conditions?"
Surfaces pattern comparisons across past cycles.
Prompt 5 – Single-Company Macro Profile
"How do interest rates, the dollar, and economic cycles affect [company name]'s valuation?"
Produces a macro sensitivity profile for any individual stock.
⚠️ AI Reality Check: Large language models can confidently generate financial figures and stock lists, but without a live data connection they may hallucinate revenue percentages or historical correlations. Use these prompts as conceptual filters, then cross-verify the specific output against a hard data screener like Finviz or TradingView.
What This Framework Doesn't Do
The Sorting Hat is a mental model, not a predictive tool. It won't signal when to buy or sell. It won't anticipate earnings surprises. It assumes historical correlations hold, which they don't in every cycle.
Companies also evolve. A regulated utility can shift toward growth-oriented renewable energy and gradually acquire Gryffindor traits. A global consumer brand can implement currency hedging programs that reduce its Slytherin sensitivity. Individual company narratives can override macro forces entirely in any given quarter.
Use the framework as a starting filter, not a final answer.
A Practical 30-Day Application
Week 1: Map your current holdings to the four houses. Identify which house is most concentrated in your portfolio.
Week 2: Track the dominant daily macro driver, whether rates, dollar, commodities, or risk sentiment, and note which house benefits. The Daily Market Analysis Framework provides the structured process for this step.
Week 3: Study three companies from each house. Record how each reacts to the day's dominant macro move.
Week 4: Focus on the exceptions: stocks that behave opposite to their house. Those divergences tend to contain more information than the confirmations do.
The Institutional Perspective Most Retail Traders Miss
Most investors equate diversification with owning several companies. Institutional investors measure diversification differently: by macro sensitivity, not by name count. Twenty companies that all belong to the same macro house carry concentrated risk regardless of how many tickers are in the portfolio. If all twenty are Gryffindor growth stocks, a rate hike cycle compresses every position simultaneously through the same mechanism.
The Sorting Hat framework doesn't resolve that concentration automatically. It makes it visible. Visibility is the precondition for managing it. How capital rotates between these four groups across economic cycles, and how to read those rotations before they become obvious in price, is what the full BB Macro Intelligence Series is built around.
Go Deeper: The Full Breakout Bulletin Macro Intelligence Series
Understand each macro driver:
- Why Rising Interest Rates Hurt Growth Stocks – Gryffindor deep-dive
- How a Strong Dollar Affects the S&P 500 – Slytherin deep-dive
- Why Commodity Booms Lift Cyclical Stocks – Ravenclaw deep-dive
- Defensive Stocks Explained – Hufflepuff deep-dive
- Best Stocks During a Recession – Applied recession positioning
Build the trading framework:
- Risk-On vs Risk-Off Markets Explained – Regime foundation
- Market Regime Identification Framework – How to classify the current environment
- Daily Market Analysis Framework – How to apply it every trading day
- Economic Calendar Trading Framework – How to trade CPI, NFP, and FOMC
This article is published by BreakoutBulletin for educational purposes only. It does not constitute investment advice or a recommendation to buy or sell any security. All company examples and macro frameworks are provided for illustrative purposes only. Past performance is not indicative of future results. BreakoutBulletin is an educational content platform and is not a registered investment advisor, broker-dealer, or financial institution.
Ready to apply the macro framework?
The 5-Layer Trading Framework covers how to identify the current market regime, confirm it through internals, and execute with price as the final signal.
© 2026 BreakoutBulletin | breakoutbulletin.com | All rights reserved.