
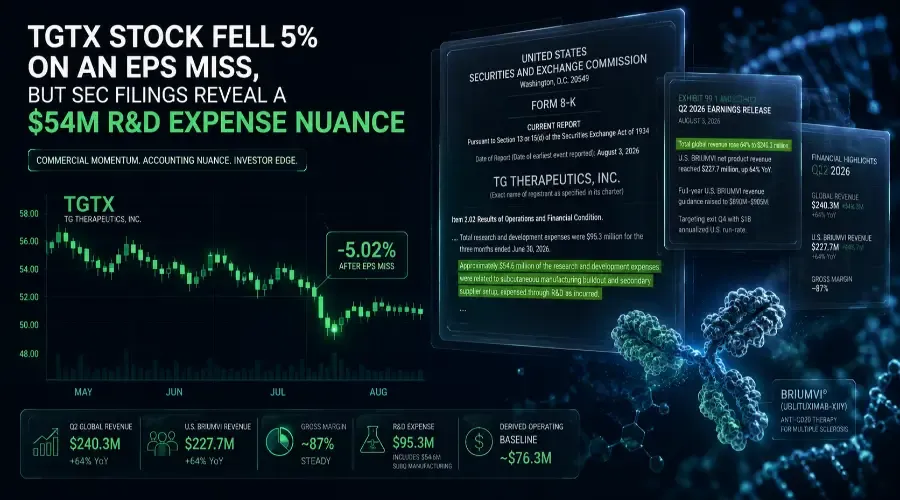
Traders selling TG Therapeutics on a knee-jerk EPS shortfall are responding to top-line headline numbers while ignoring the underlying operational mechanics.
While reported GAAP earnings per share fell to $0.05 against consensus expectations, commercial demand for BRIUMVI reached record levels. Total global revenue rose 64% to $240.3 million. In our analysis, the reported EPS miss is heavily influenced by subcutaneous manufacturing and supplier-buildout costs expensed through R&D, rather than commercial margin erosion.
All figures in this post are based on publicly available data. Derived thresholds are labelled as such. Actual outcomes can differ materially.
Thesis
The gap between investor panic and commercial realities lies in SEC Form 8-K disclosures and earnings commentary from August 3, 2026. Within Item 2.02, TG Therapeutics reported $95.3 million in total quarterly research and development costs. The filing and management remarks indicate that roughly $54.6 million was related directly to subcutaneous manufacturing buildup and secondary supplier setup, expensed through R&D as incurred. Adding back this $54.6 million manufacturing allocation to reported GAAP operating income ($21.7 million) yields a derived underlying operating baseline of ~$76.3 million.
Wall Street consensus estimates varied, reflecting differing analyst assumptions regarding the timing and accounting treatment of these pre-commercial manufacturing outlays.
What The Numbers Say
Commercial expansion remains strong across all metrics. U.S. BRIUMVI net product revenue reached $227.7 million for the second quarter, up 64% year-over-year from $138.8 million in the prior-year period. Sequential growth reached 16.9% over the $194.8 million reported in the first quarter. Gross margins on domestic sales remained steady near 87%.
Alongside these volume gains, management raised full-year U.S. BRIUMVI revenue guidance to $890M–$905M, up from prior targets. Total global revenue projections rose to approximately $950 million. The company aims to exit the fourth quarter with an annualized U.S. run-rate of $1 billion.
Volume vs. Price: The revenue growth is being driven primarily by record new patient starts, continued prescriber expansion, and higher-than-expected treatment persistence. More than 25,000 patients have now been prescribed BRIUMVI globally. This is a volume-led expansion, not price-driven—which is more durable and sustainable.
Bridging to Valuation
At the current market cap of approximately $7.96 billion and a stock price of ~$52.03, TGTX trades at:
| Metric | Value |
|---|---|
| Trailing P/E | 18.12x |
| Forward P/E | 31.16x |
| Price/Sales | 10.53x |
On our derived operating baseline: Annualizing the ~$76.3M quarterly operating income gives ~$305M in annualized operating earnings. At the current $7.96B market cap, this implies an operating-earnings multiple of ~26x on normalized earnings.
Peer context: The broader biotech industry trades at a median P/E of approximately 21.96x, while the peer group average for commercial-stage immunology players is ~23.7x. TGTX's trailing P/E of 18.12x sits below both the industry average and the peer group average—despite revenue growing at 70% year-over-year.
Implied upside: If the market re-rates TGTX to the peer group average of ~23.7x on normalized earnings, the implied price target would be approximately $63–65**—roughly 20–25% above current levels. Analyst consensus already reflects this, with an average price target of **$68.43 and a "Buy" consensus rating. HC Wainwright maintains a $77 price target.
Downside scenario: If the subQ Phase 3 fails to demonstrate bioequivalence, the manufacturing add-back disappears and the stock reverts to GAAP earnings. At that point, the operating-income multiple would compress significantly, implying downside of 30–40% from current levels.
What Could Break The Thesis
Elevated ongoing expenditure remains the primary structural friction. Management guided to $350 million–$400 million in target operating expenses (excluding non-cash compensation), plus an additional $100 million allocated specifically for subcutaneous BRIUMVI manufacturing and secondary supplier buildout ($450M–$500M total OpEx footprint).
With $58.8 million in manufacturing expenses incurred through H1, the market must absorb roughly another $41 million in second-half manufacturing charges.
Are these costs one-time or recurring? Management's guide of "$100 million allocated specifically for subcutaneous manufacturing and secondary supplier buildout" suggests a finite buildout period. These expenses are expected to step down materially after the buildout completes, driving significant operating leverage into 2027 and beyond. However, if the subcutaneous formulation launch succeeds, some manufacturing-related costs may migrate from R&D into COGS—but at a lower absolute level than the current buildout spend.
If subcutaneous Phase 3 trial readouts in late 2026 or early 2027 fail to demonstrate therapeutic equivalence, these manufacturing allocations will yield zero future commercial conversion.
The invalidation threshold (reconciled with guidance): Management's full-year U.S. guidance of $890M–$905M implies required H2 U.S. revenue of approximately $467–$480M (given H1 U.S. revenue of $422.5M). This translates to a Q3/Q4 average of ~$234–$240M.
Our invalidation threshold is aligned with this guidance floor: if quarterly U.S. BRIUMVI revenue falls below $230M (implying the company cannot achieve the low end of its full-year guidance), the thesis weakens materially. If Phase 3 subcutaneous data fails to meet bioequivalence endpoints, the thesis is invalidated entirely—regardless of revenue performance.
Educational Setup Context
BRIUMVI competes in the highly competitive multiple sclerosis (MS) treatment landscape, where Roche's Ocrevus and Novartis's Kesimpta dominate. Ocrevus generates over $4 billion** in annual U.S. sales, while Kesimpta reached **$1.42 billion in Q2 2026 alone (up 32% year-over-year). BRIUMVI's key differentiator is its infrequent dosing—a major competitive advantage in a market where patient convenience drives adherence. The drug has already captured approximately one-third market share in the healthcare-provider-administered segment.
The instrument context involves mid-cap equity tracking biopharma commercial execution cycles, with a near-term catalyst (subQ Phase 3 readout) and a fundamental growth story (BRIUMVI market share expansion).
Note: The following is a hypothetical illustration for educational purposes only and does not constitute a trade recommendation.
If market pricing re-evaluates TGTX based on its derived underlying operating baseline, valuation multiples may recalibrate toward full-year guidance; conversely, if sequential quarterly sales slow below $230 million in the third quarter—implying the company cannot achieve its full-year guidance—the thesis invalidates.
| Metric | Value | Analytical Context and Critical Meaning |
|---|---|---|
| Q2 2026 Global Revenue | $240.3 Million | Expands 70% year-over-year, proving strong underlying product adoption. |
| Q2 U.S. BRIUMVI Revenue | $227.7 Million | 64% YoY growth; 16.9% sequential growth; record new patient starts. |
| Q2 Gross Margins | ~87% | Stable; no commercial margin erosion despite R&D expense spike. |
| Q2 Total R&D | $95.3 Million | Includes ~$54.6M subQ manufacturing buildout expensed as incurred. |
| Q2 SubQ Manufacturing R&D | $54.6 Million | One-time buildout cost; ~$41M remaining to be expensed in H2 2026. |
| Reported GAAP Operating Income | $21.7 Million | Depressed by the $54.6M manufacturing charge. |
| Derived Operating Baseline | ~$76.3 Million (est.) | Analytical calculation adding back subQ R&D charges to reported GAAP operating income. |
| Annualized Operating Earnings | ~$305 Million | Derived baseline × 4 quarters—the "normalized" earnings power. |
| 2026 Total OpEx Guide | $450M–$500M | Combines $350M–$400M base OpEx guide (ex-non-cash comp) with $100M subQ manufacturing allocation. |
| U.S. BRIUMVI FY Guidance | $890M–$905M | Raised target requiring ~$467–480M in second-half sales to validate. |
| Total Global FY Guidance | ~$950M | Up from prior $875–900M range. |
| Cash and Investments | $612.3 Million | Provides liquid runway to absorb full-year operating commitments. |
| Market Cap | ~$7.96 Billion | At ~$52.03/share; 153.08M shares outstanding. |
| Trailing P/E | 18.12x | Below industry average (~21.96x) and peer group average (~23.7x). |
| Forward P/E | 31.16x | Reflects expected earnings normalization post-buildout. |
| Implied Operating Earnings Multiple | ~26x | On derived annualized operating baseline of ~$305M. |