
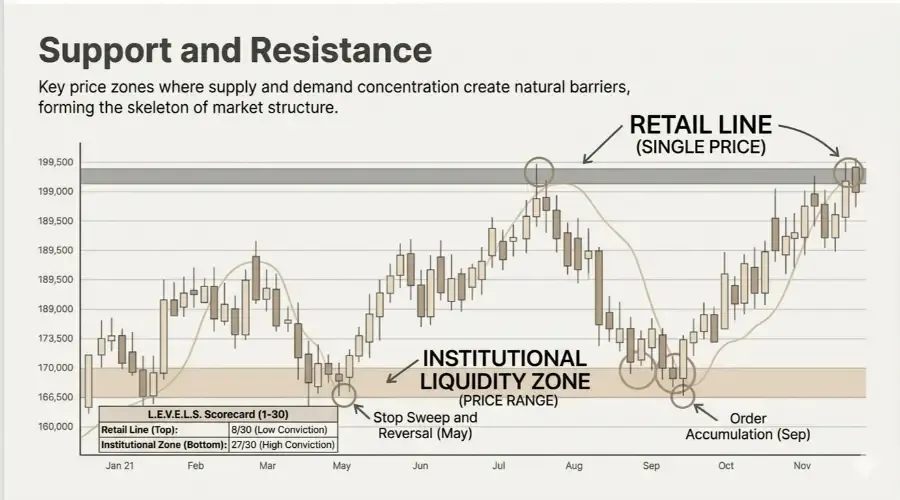
Quick Summary: How Institutions Trade Support and Resistance
Institutional traders don’t view support and resistance as simple lines. They view them as Liquidity Zones.
Retail traders often get trapped in fake breakouts.
Institutions use these same areas to accumulate or distribute positions.
The Zone Concept:
Support and resistance are areas of order flow, not exact prices.
These zones represent where supply or demand is strong enough to stop or reverse price.
The Three-Filter Method:
Focus only on:
Market Structure (swing highs/lows)
Multiple strong reactions
Volume Confirmation (≥1.5x average)
The L.E.V.E.L.S. Framework:
Used to filter high-quality zones vs noise:
Liquidity
Entry clusters
Volume
Exhaustion
Multi-timeframe strength
Stop hunt potential
Key Insight:
Institutions react to liquidity - not lines
Most retail traders draw horizontal lines and wait for price to bounce.
Institutions don’t.
They trade zones where capital was deployed.
A level matters not because price touched it, but because orders were executed there.
This is the shift that changes everything.
What is support and resistance in trading?
Support and resistance are price zones where buying or selling pressure repeatedly appears.
Support → demand exceeds supply
Resistance → supply exceeds demand
These zones are driven by institutional order flow, not retail patterns.
complete stock market technical analysis guide
What Support and Resistance Actually Represent
Support and resistance are not exact price levels.
They are zones of liquidity concentration.
Institutions cannot enter at one price.
They build positions across a range.
That’s why price reacts to areas - not lines.
Key Insight:
Price reacts because of order flow - not technical lines.
This is supported by:
Wyckoff Method
Market Profile theory
Both show institutions operate in zones.
How to Identify Strong Support and Resistance - The 3 Filters
1. Market Structure (Highs & Lows)
The strongest levels come from real reversals.
Focus on:
Previous highs
Previous lows
Rule:
Mark only the top 3 levels on the daily chart.
More levels create noise.
2. Multiple Strong Reactions
Not all touches matter.
A valid level must show:
Sharp rejection
Strong move away
Avoid:
Weak drift
Random wicks
3. Volume Confirmation
This is where most traders fail.
No volume = no institutional participation.
Look for:
Volume ≥ 1.5x average
Studies show:
High-volume levels = higher success rate.
Support Becomes Resistance - Why It Happens
This is not magic. It is behavior.
When support breaks:
Buyers are now in loss
Price returns → they sell at breakeven
At the same time:
Short sellers enter
Algorithms target the level
Result:
Support becomes resistance
Key Insight:
This is a liquidity event — not a pattern.
Data shows:
60–70% of retail breakouts fail.
how to identify and avoid false breakouts
The L.E.V.E.L.S. Framework (Institutional Scoring System)
Most traders identify levels.
We score them.
Each factor = 1 to 5
L — Liquidity Pool
Are stops trapped here?
E — Entry Clusters
Multiple strong reversals?
V — Volume
Above-average activity?
E — Exhaustion
Rejection candles present?
L — Level Strength
Daily + Weekly alignment?
S — Stop Hunt Potential
Are stops sitting beyond the zone?
Scoring Guide
20+ → Watch
25+ → High-conviction zone
Trader Takeaway:
This framework removes guesswork
and highlights institutional zones
Timeframe Hierarchy - What Actually Matters
Dynamic Support and Resistance - Institutional Liquidity in Motion
Not all support and resistance levels are horizontal.
Institutions also use dynamic liquidity zones that move with price.
The most important dynamic levels are:
VWAP (Volume Weighted Average Price)
Moving Averages (20, 50, 200)
These levels reflect real-time positioning and the average cost of institutional trades.
VWAP helps institutions understand whether price is trading at a premium or discount relative to the day’s activity.
When price returns to VWAP, it often acts as a dynamic support or resistance zone.
Moving averages behave similarly.
They become self-reinforcing levels because many large participants use them for execution and risk management.
Key Insight:
Static levels show where liquidity was.
Dynamic levels show where liquidity is forming now.
The highest-probability setups occur when dynamic levels align with horizontal zones.
This alignment creates confluence between past and present liquidity, which is where institutions are most active.
Higher Timeframes (Weekly / Monthly)
Institutional zones
Highest reliability
Daily Timeframe (Best for Trading)
Filters noise
Captures real activity
Most important timeframe
Intraday (5m / 15m)
Use only for:
Entry timing
Best intraday levels:
Previous day high/low
Overnight range
Opening range
Key Insight:
Never trade based only on intraday levels
5 Mistakes Retail Traders Make
1. Too Many Levels
Creates confusion
2. Treating Zones as Lines
Unrealistic expectations
3. Ignoring Volume
No institutional confirmation
4. Trading Every Touch
Low probability
5. Treating All Levels Equal
No filtering system
how to read volume for trade confirmation
BreakoutBulletin Take - Liquidity vs Lines
Retail asks:
Where did price bounce?
We ask:
Where is liquidity?
That’s the difference.
Not every level matters.
Not every zone is active.
The best levels are created by:
Institutional order flow
Volume
Liquidity imbalance
Final Insight:
The shift from lines to liquidity
separates average traders from advanced traders
Frequently Asked Questions:
Why does support break before bouncing?
This is a stop hunt.
Institutions push price below support to trigger stop-losses and create liquidity.
How do you identify strong support and resistance levels?
Look for:
Sharp rejection
High volume
Multiple reactions
Why does support become resistance?
Trapped buyers sell
Short sellers enter
Selling pressure builds
Which timeframe is best for support and resistance?
Weekly + Daily = strongest
Intraday = entry only
What is the difference between support/resistance and supply/demand zones?
Support/resistance = levels
Supply/demand = zones
Institutions use zones
Conclusion
Support and resistance is not about drawing lines.
It is about understanding where institutions are active.
The L.E.V.E.L.S. framework helps you:
Filter noise
Focus on real zones
Improve trade quality
Instead of asking:
Is this support?
Ask:
Is this institutional liquidity?
That shift changes everything.
complete technical analysis guide for retail traders
DISCLAIMER:
This article is for informational and educational purposes only and does not constitute financial, investment, or trading advice. You are solely responsible for your own investment decisions and should consult a licensed financial professional before acting on any information in this post.