
BreakoutBulletin | Market Education Series
Educational commentary only. Not investment advice. Past performance does not guarantee future results.
Why Support Levels Work - The Mechanism Behind the Bounce
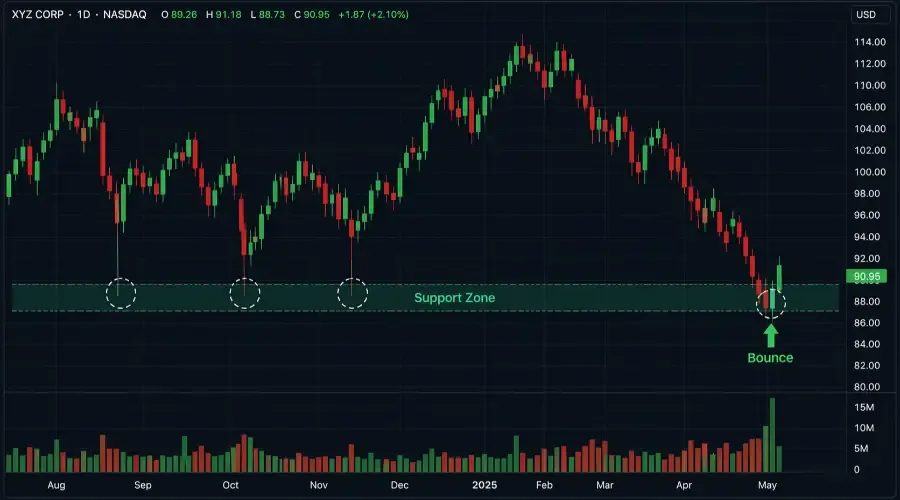
Most trading guides describe support levels as “areas where price has bounced before.” That description is accurate but explains nothing. To trade support levels with real conviction, you need to understand why price bounces - because the reason determines how to identify levels worth trading and how to distinguish them from levels that will fail.
Support levels exist because of unfilled institutional orders.
When a large fund executes a position - buying 2 million shares of a stock over several sessions - it rarely completes the full order before price moves away. Some portion of that intended position remains unfilled. The price level where the fund was actively buying becomes a reference point. When price returns to that level, the same institutional player - and others who observed the original buying - recognises the opportunity and re-engages. That concentrated demand creates the bounce.This is why support levels with multiple prior touches carry more significance than single-touch levels. Multiple touches mean multiple institutional participants have transacted at or near that level across different time periods. The level has accumulated institutional memory. When price returns, it is returning to a zone where multiple large players have a stated interest in defending.
Q&A: The Mechanics of the Institutional Bounce
Why do support levels actually work in a market dominated by algorithms?
It isn’t just “technical magic”- it’s Institutional Memory. When a large fund buys millions of shares, they often can’t fill their entire order as the price moves up. They leave “unfilled orders” behind. When the price returns to that level, those same institutions (and others watching them) re-engage to complete their positions. In 2026, we trade these levels because we are effectively “piggybacking” on the massive capital requirements of these institutional players.
In the current selective risk-off environment, why should I reduce my position size?
We use a Regime Scoring System to stay safe. In a “Score 2” environment, the market lacks the broad “tailwinds” needed for high-probability bounces. Even a “Grade A” support level is under pressure from macro headwinds. Reducing to half-size (0.5% risk) ensures that a few failed levels don’t derail your annual performance while waiting for a “Full Risk-On” Score 3 environment to return.
What is the biggest mistake retail traders make when identifying support?
They treat support as a thin line rather than a Zone. In our 2026 framework, we use an ATR (Average True Range) Formula to calculate the “width” of the support area. Algorithms frequently “hunt” for stop losses just below obvious round numbers. By building a zone that allows for 0.5× to 0.8× ATR of “noise,” you avoid being stopped out by a temporary dip before the real institutional bounce occurs.
The Regime Scoring System: Start Here
Before any level analysis, score the current market environment. This applies to every setup in the BreakoutBulletin cluster (for a deeper discussion of the VIX heuristic, see the VWAP bounce guide).
SPY trend positive: SPY above its 20-day SMA → +1 point
Volatility contained: VIX below 20 (heuristic threshold) → +1 point
Breadth positive: NYSE advance/decline line not diverging from SPY → +1 point
Scoring rules:
Score 3 → Full intended position size
Score 2 → Half intended position size
Score 1 or 0 → Paper trade only, no live positions
VIX note: The 20 level is a practical heuristic, not a precise cutoff. A more precise filter uses VIX relative to its own 20-day moving average. For daily decision-making, the absolute 20 threshold is sufficient.
In the current April 2026 selective risk-off environment, most sessions score 2. Half size is the correct default until conditions improve.
The Level Quality Grading System
Not all support levels are equal. The grade assigned to a level determines maximum allowable position size — independent of and in addition to the regime score.
Grade Requirements and Maximum Position Size
| Grade | Min Touches | Volume at Touches | Timeframe Visible | Last Test | Max Size (Regime 3) | Max Size (Regime 2) |
|---|---|---|---|---|---|---|
| A | 4+ (3 for AAPL/MSFT/SPY*) | Above avg at 2+ touches | Daily AND weekly | 10+ sessions ago | Full 1% risk | Half 0.5% risk |
| B | 3 | Above avg at 2 touches | Daily only | 5-10 sessions ago | 0.75% risk | 0.4% risk |
| C | Under 3 | Low or mixed | Intraday only | Recently overworked | No trade | No trade |
Grade A — Institutional-Grade Support
Four or more prior touches on the daily or weekly chart with clear reversals
Volume at prior touches above the stock’s 20-day average volume
Level visible on both daily and weekly chart
Most recent test was more than 10 sessions ago (level is fresh)
Ideally aligns with a round number, prior earnings gap, or major moving average
The “Freshness” Rule (The Well Analogy)
Think of a support level like a well. Every time price touches it, a “bucket” of institutional demand is taken out. If price returns too quickly (less than 5-10 days), the well may be dry. Institutional demand is finite — each test consumes a portion of the unfilled orders. Requiring 10+ sessions between the last test and the current approach allows order books to rebuild. Rapid retests fail more often because demand hasn’t been replenished.
Grade B — Tradeable Support
Three prior touches on the daily chart with reversals
At least two touches show above-average volume
Level visible on the daily chart (may not appear on weekly)
Most recent test was 5-10 sessions ago
Trade Grade B with reduced size and stricter entry confirmation.
Grade C — Skip
Fewer than three prior touches, low volume at touches, or only visible on intraday timeframes
Insufficient institutional memory for reliable bounce trading.
Support Zones: Width Formula
Support is never a line - it is a zone. Treating it as a precise single price produces premature stops and missed entries.
Zone width formula: 0.3× ATR (minimum) to 0.8× ATR (maximum) measured from the median prior touch price.
Example: A stock with 14-day ATR of $1.50 has prior touch lows of $48.10, $48.20, $48.35. Median touch price: $48.20.
Zone lower boundary: $48.20 − (0.5 × $1.50) = $47.45
Zone upper boundary: $48.20 + (0.3 × $1.50) = $48.65
Zone = $47.45 – $48.65. Price entering this zone triggers setup monitoring. Price closing above $48.65 on the bounce candle with volume triggers entry.
Multiplier guidance: Use 0.3× for tight, liquid names with small ATR relative to price. Use 0.8× for volatile names or wider spreads.
Multi-Timeframe Identification: Top-Down Always
Weekly chart first – major structural levels (prior week lows, multi-month consolidations, 52-week lows) — deepest institutional memory.
Daily chart second – prior session lows, consolidation bases, 50-day and 200-day MA intersections.
4-hour or 1-hour for zone refinement – define precise boundaries (ATR formula) for stop placement.
15-minute or 5-minute for entry confirmation – execution only, not identification.
The identification hierarchy and execution timeframe must be different.
Level Identification: Exact Rules
Identify left to right – the level should be obvious before you know where current price is. Working backward from price to justify a trade produces false confirmation.
Count only touches with genuine reversals – a pause of one or two candles does not qualify. A reversal means multiple sessions of directional change. Count conservatively.
Wider time between touches is better – three tests over six months is stronger than three tests over six days. Time allows institutional demand to rebuild.
Convergence strengthens the level – a zone coinciding with an earnings gap fill, the 200-day SMA, and a round number is significantly stronger than a level from touch points alone.
The most obvious level is also the most hunted – algorithmic stop hunts target round numbers aligned with prior lows and major MAs. Allow 0.5–1× ATR penetration below the obvious level before requiring confirmation.
Binary Event Rule
Avoid all support bounce trades within five sessions of a scheduled binary event - earnings, FDA decisions, major central bank announcements, index rebalancing. Support levels break unpredictably around catalysts because institutional positioning overrides normal technical behavior. Check the earnings calendar before any trade. If earnings fall within five sessions, pass and wait for post-event structure.
The Three Confirmation Types
Type One – Candle Confirmation
Wait for a candle on the execution timeframe to close above the upper boundary of the support zone with above-average volume.
The candle body must close above the zone - wicks into the zone without a closing body above are insufficient.
Entry: Close of the confirmation candle
Stop: Below the lowest wick touching the zone, plus 0.5× ATR buffer
Best for: Grade A and B levels
Type Two – Failed Breakdown Confirmation
Price briefly breaks below the support zone (closes 1-2 candles beneath) then recovers back above the zone boundary on expanding volume within the same session.
Entry: Close of the first candle recovering above the zone upper boundary
Stop: Below the breakdown low, plus 0.5× ATR
Best for: Grade A levels only
Type Three – Compression Entry
Price enters the support zone and forms a series of narrow-range candles over multiple sessions.
Entry: Above the high of the compression range on the breakout candle
Stop: Below the compression range low, plus 0.5× ATR
Best for: Grade A levels
Pre-Entry Checklist (Full)
| Condition | Threshold | Check |
|---|---|---|
| Regime score | 2 or 3 | Yes / No |
| Level grade | A or B only (C = pass) | Yes / No |
| Level identified on daily or weekly chart | Not intraday identification | Yes / No |
| Minimum 3 prior touches with reversals | Counted left to right | Yes / No |
| Volume at prior touches | Above avg at ≥2 of 3 touches | Yes / No |
| Level fresh | Grade A: 10+ sessions; Grade B: 5+ sessions | Yes / No |
| Zone width calculated | 0.3–0.8× ATR from median touch | Yes / No |
| Approach momentum decelerating | Narrowing candles, declining volume on decline | Yes / No |
| Confirmation type identified | Candle, failed breakdown, or compression | Yes / No |
| Confirmation candle closes above zone | Above-average volume | Yes / No |
| No binary catalyst within 5 sessions | Earnings, FDA, major macro | Yes / No |
| Stock ADV above 1M | Adequate institutional participation | Yes / No |
Position Sizing: Full Calculation With Stop Examples
| Account | Risk Level | Dollar Risk | Stop Distance | Shares |
|---|---|---|---|---|
| $10,000 | 1% (Grade A, Regime 3) | $100 | $1.25 | 80 |
| $10,000 | 0.5% (Grade A, Regime 2) | $50 | $1.25 | 40 |
| $25,000 | 1% (Grade A, Regime 3) | $250 | $1.25 | 200 |
| $25,000 | 0.5% (Grade A, Regime 2) | $125 | $1.25 | 100 |
| $50,000 | 1% (Grade A, Regime 3) | $500 | $1.25 | 400 |
| $50,000 | 0.5% (Grade A, Regime 2) | $250 | $1.25 | 200 |
Observed Performance Data
| Regime Condition | Grade A (n) | Grade A Bounce Rate | Grade A R:R | Grade B Bounce Rate | Grade B R:R |
|---|---|---|---|---|---|
| Full risk-on (score 3) | 234 | 68% | 2.3:1 | ~58-60% | ~1.8:1 |
| Selective risk-on (score 2-3) | 318 | 61% | 1.9:1 | ~52-53% | ~1.5:1 |
| Selective risk-off (score 2 – current) | 219 | 52% | 1.6:1 | ~42-44% | ~1.2:1 |
| Full risk-off (score 0-1) | 76 | 31% | 0.9:1 | ~22-24% | ~0.8:1 |
Failure Modes: Five Ways Support Breaks Down
Demand exhaustion through repeated testing – each test consumes institutional demand. Five or more tests = pass or max 30% of standard size.
Volume deterioration at successive touches – declining bounce volume signals weakening conviction. Reduce size or pass.
High-volume approach – above-average volume on declining candles into support signals institutional distribution. Wait for volume to normalise.
Macro regime override – regime score 0 or 1 overrides all technicals. No trades.
The hunted level – obvious round-number support is a stop-hunt target. Build zone width to accommodate 0.5-1× ATR penetration.
The Forward-Testing Protocol
Phase One – Identification practice without trading (2 weeks).
Phase Two – Paper trading (3-4 weeks).
Phase Three – Live trading at 30% of intended size (4 weeks).
Phase Four – Full size after documented consistency.
The Professional Edge
In today's market, support is not a line it is a zone of institutional intent.
The edge lies in identifying where institutions are likely to defend price - and waiting for confirmation before committing capital.
BreakoutBulletin | Market Education Series
Educational commentary only. Not investment advice. Past performance does not guarantee future results.