
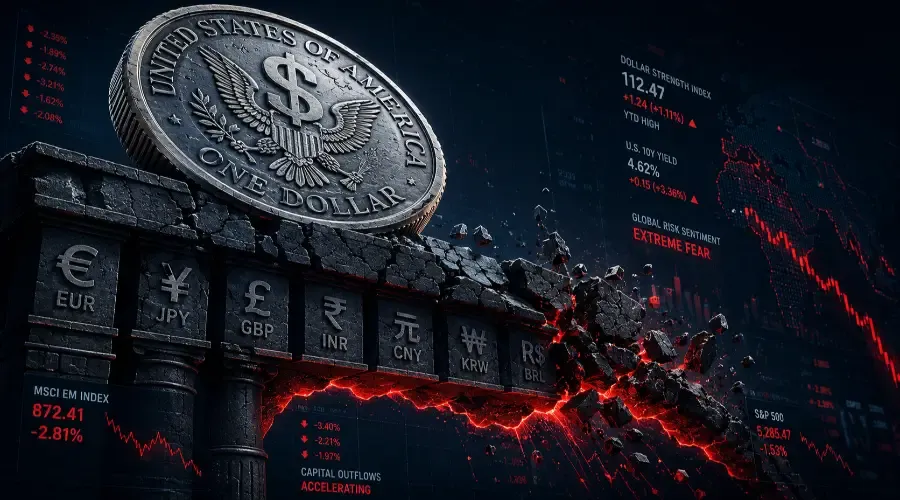
MSCI's research on EM stress identified dollar strength, rising US rates, current account deficits, and commodity price collapses as the key vulnerability factors. The Emerging Markets Forum's crisis analysiscatalogued how contagion spreads from initial defaults to developed market equities. None maps the precise sequence to US equity sector rotation – or identifies the most useful reframe: an EM debt crisis is largely a strong-dollar consequence. Understanding it as such reveals which sectors are hit, through which channels, and in what order.
The Foundation: Original Sin and the Dollar Dependency
Emerging market economies represent approximately 40% of global GDP and are the dominant consumers of global industrial commodities – China and other EM economies account for roughly 60–70% of global copper and iron ore demand (World Bureau of Metal Statistics; China alone represents the largest single share and percentages vary by metal). Most EM countries borrow in a currency they cannot print: the US dollar.
This is the "original sin" of emerging market finance – the structural inability of developing economies to issue internationally accepted debt in their own currency. When local currencies fall, dollar debt service costs rise automatically, triggering fiscal crisis without any change in the nominal dollar amount owed.
Important caveat: domestic vulnerabilities – fiscal profligacy, political instability, central bank credibility loss – set the stage. Dollar strength lights the fuse. Argentina's repeated defaults involve deep structural issues that persist across dollar cycles. The dollar-centric framework describes the most powerful external trigger, not every crisis in its entirety.
The Indicator Cheat Sheet: EMBI Thresholds
The JP Morgan EMBI spread – the yield premium EM sovereign bonds pay over US Treasuries – is the primary real-time barometer. Limitation: it can be distorted by large defaulted sovereigns (Venezuela) and may not capture stress in countries that have shifted to local-currency borrowing. Use alongside the JP Morgan EM Currency Index (EMCI) and sovereign CDS spreads.
| Metric | Threshold | Risk Status | Tactical Rule |
|---|---|---|---|
| EMBI Spread | < 300 bps | Normal | Maintain benchmark allocations |
| EMBI Spread | 400–500 bps | Elevated local stress | Scale down XLB; monitor major EMs |
| EMBI Spread | 500–700 bps | Significant contagion | Overweight XLP/XLU; underweight XLB/XLE |
| EMBI Spread | > 700 bps | Systemic risk-off | Maximum defensive positioning |
| DXY vs. EMCI | DXY +5% / EMCI −5% | Loop activating | Confirms dollar-EM crisis is live |
EMBI available free at FRED (series: EMBI).
The China Conundrum
China's debt profile is fundamentally different from traditional EM economies like Argentina or Turkey. Traditional EM crises run through dollar-denominated debt → currency devaluation → fiscal austerity → commodity demand falls. China's systemic risk is primarily domestic and RMB-denominated – local government financing vehicles, real estate sector debt (Evergrande, Country Garden). A China-specific stress episode transmits to US equities through real estate and industrial overcapacity channels, not EMBI blowout. Monitor China PMI and property sales data separately when assessing commodity demand risk.
The Fed Reflexivity Loop
Dollar strength driving EM crises is itself often a Fed tightening consequence – and the loop is two-way. Sustained EM contagion eventually forces a Fed dovish pivot: growth risk rises, the dollar weakens, EM pressure relieves. This reflexivity creates sharp reversals – particularly in XLB (commodity recovery) and XLF (EM credit quality improvement). When EMBI falls from its peak and Fed language shifts toward pausing or cutting, initiate recovery rotation ahead of official data.
Sector Scorecard
All magnitude ranges are illustrative based on historical central tendencies. Each crisis differs in depth and breadth – treat these as directional, not statistical forecasts.
Materials (XLB) – Significant Negative – 3–6 Month Lag
The highest-conviction EM crisis trade. Currency collapse triggers EM import and capex curtailment – copper, iron ore, and aluminium demand fall three to six months after the initial crisis. The lag provides a positioning window unavailable in faster-moving currency or equity trades.
Energy (XLE) – Moderate Negative – 3–6 Month Lag
China accounts for ~15% of global oil demand; broader EM adds more. Fiscal austerity and industrial contraction reduce energy consumption with a similar lag to XLB. Use EMBI crossing 500 bps as the threshold to begin reducing.
Financials (XLF) – Moderate Negative – Immediate to 3 Months
US banks with EM loan portfolios face provisioning increases when systemically important EMs show stress. Small-country defaults produce limited XLF impact. Two or more major US banks citing EM deterioration in the same quarterly earnings cycle is the signal.
Technology (XLK) – Mild Negative – Immediate
Dollar strengthening creates translation headwinds. A 5% DXY rise produces approximately 1–2% translation headwind for companies with 20–25% EM revenue.
Consumer Staples (XLP) and Utilities (XLU) – Mild Positive Relative – Immediate
Defensive rotation from EM-exposed cyclicals and potential Fed dovish pivot expectations both support these sectors. The positive is relative – absolute returns may still be small negative in severe risk-off episodes.
Real Estate (XLRE) – Mixed
Dollar strength mildly negative; Fed dovish pivot potential mildly positive. Net signal approximately neutral.
Historical Cases
1997–1998 Asian Financial Crisis
Began with Thailand's baht devaluation (July 2, 1997), spread to Indonesia, South Korea, Russia (domestic default, August 1998), and LTCM collapse (September 1998). EMBI exceeded 700 bps at peak. Copper fell ~30%, oil reached $10/barrel. Key lesson: US equity impact peaked fourteen months after the initial Thai baht move – when LTCM's leveraged EM exposure threatened US financial system stability.
2022 Small-Country Cluster
Sri Lanka, Ghana, Zambia defaults without full systemic contagion. EMBI widened but did not reach crisis thresholds. US equity impact was minimal – confirming the scale rule: small-country crises without systemically important EM involvement produce noise, not signal.
Playbook
Before:
Track EMBI weekly on FRED. When DXY rises 5%+ while EMCI falls 5%+ over two months, the feedback loop is activating.
During:
EMBI 400–500 bps – reduce XLB, watch provisioning. 500–700 bps – reduce XLB/XLE, add XLP/XLU. Above 700 bps – maximum defensive; monitor Fed for reflexivity pivot.
After:
EMBI below 350 bps for four consecutive weeks is the recovery signal. Rebuild XLB first. Add XLF when bank earnings show provisioning stabilising.
Bottom Line Checklist
Dollar strength lights the fuse; domestic vulnerabilities set the stage
EMBI is the primary dashboard – supplement with EMCI and CDS spreads
China operates differently – monitor PMI and property data separately
XLB is the primary trade with a 3–6 month lag providing the entry window
EMBI thresholds: >400 reduce XLB · >500 add defensives · >700 maximum defensive
DXY +5% / EMCI −5% confirms the loop is live
Fed dovish pivot from EM stress = XLB and XLF recovery – act ahead of data
Q&A
Q: Why is a strong US dollar the primary driver of an EM debt crisis?
A: Through "original sin" – the structural inability of developing economies to borrow internationally in their own currencies. Dollar-denominated debt means Fed tightening or dollar strength automatically increases local-currency debt service costs, triggering a feedback loop: rising dollar → EM currency devaluation → fiscal austerity → capital flight → deeper currency pressure. Domestic vulnerabilities determine which countries are most exposed; dollar strength determines timing.
Q: What is the JP Morgan EMBI spread and how do traders use it?
A: The EMBI spread measures the yield premium investors demand to hold EM sovereign debt over risk-free US Treasuries – available free on FRED. Above 400 bps signals localised stress; 500 bps signals active contagion; above 700 bps signals a full systemic crisis requiring maximum defensive equity positioning. The thresholds provide objective, rules-based triggers for sector rotation.
Q: Why does an EM debt crisis hit the US Materials sector harder than Tech or Financials?
A: EM economies consume 60–70% of global industrial commodities. When currency collapse hits, local governments curtail imports and capital expenditure – commodity demand destruction follows within three to six months. This lag is what makes XLB the highest-conviction EM crisis trade: the window between the initial currency breakdown and the commodity demand impact provides time to position before the fundamental deterioration appears in earnings.
Educational content only. Not investment advice. All sector magnitude ranges are illustrative historical central tendencies – each crisis episode will differ in severity and transmission.