
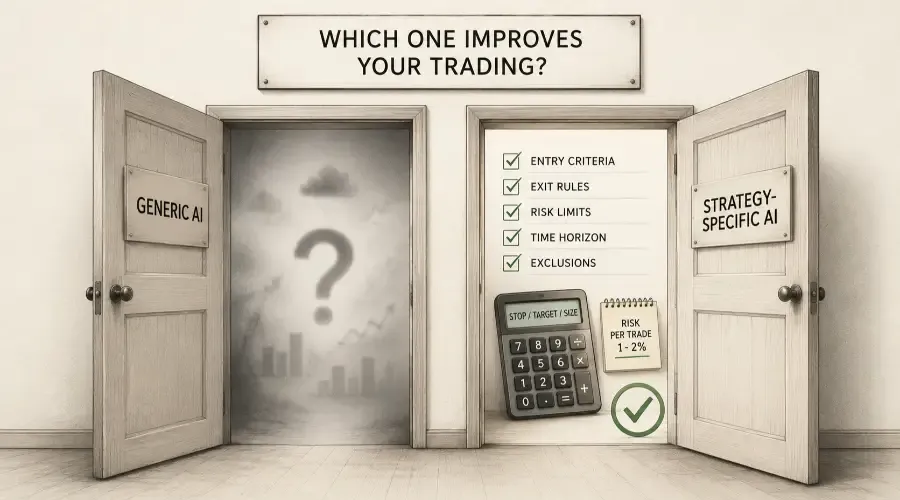
After spending years watching markets, the pattern I keep seeing is this: the biggest hurdle for most traders isn't access to data — it's discipline. Having a strategy is easy. Executing it consistently, without emotional drift, without rationalising exceptions, without letting a compelling setup override a clear rule - that's where most traders leak edge.
What changed my own process was learning to use AI not as a research tool but as a discipline enforcer.
The frameworks in this guide are what that looks like in practice.
Most traders use AI incorrectly. They ask broad market questions, consume broad market answers, and mistake information for edge. But professional trading does not reward information alone. It rewards process consistency.
AI becomes valuable only when it operates inside a trader’s existing framework.
This blog explains how to use AI for strategy-specific trading - not as a prediction engine, but as a structured analytical layer that reinforces discipline, validates logic, and reduces emotional decision-making.
This hub is part of the How to Use AI for US Stock Market Trading series. The pillar post covers the series structure and gives you the reading order across all six hubs.
Why Generic AI Use Fails Traders
There is a version of AI-assisted trading that is generic.
A trader opens ChatGPT or Claude, asks:
“What do you think about AMD?”
The model responds with:
-
Semiconductor industry commentary
-
Earnings expectations
-
Analyst opinions
-
Competitive positioning
-
Bullish and bearish scenarios
The response sounds intelligent.
But from a trading perspective, it is mostly unusable.
Why?
Because the output has no connection to:
-
The trader’s holding period
-
Risk tolerance
-
Entry criteria
-
Position sizing rules
-
Sector filters
-
Exclusion rules
-
Portfolio exposure limits
Professional trading is not about collecting opinions.
It is about executing a repeatable framework.
Generic AI outputs are designed to be balanced and non-committal because the questions being asked are broad and undefined.
A professional trader, however, needs something completely different:
-
Is the setup valid?
-
Does it meet the strategy conditions?
-
Is position sizing correct?
-
Does it violate any risk rules?
-
Is the trade inside the approved market regime?
That requires alignment.
The Strategy-AI Alignment Principle
The single most important concept in AI-assisted trading is alignment.
AI must operate within the exact constraints of the strategy.
That means every prompt should contain:
-
Holding period
-
Entry rules
-
Exit conditions
-
Risk parameters
-
Position sizing framework
-
Volume requirements
-
Sector filters
-
Exclusion conditions
Without constraints, AI produces commentary.
With constraints, AI produces decision support.
This is the difference between using AI casually and using AI professionally.
Example
A swing trader who avoids earnings-week volatility should explicitly include:
“Do not consider entries within 5 trading days of earnings.”
A momentum trader might include:
“Only consider stocks trading above the 20-day EMA with volume at least 1.2x average.”
A macro trader may include:
“Classify the current regime before evaluating sector positioning.”
The more precisely the strategy is defined, the more useful the AI output becomes.
The Biggest Mistake Traders Make With AI
Many traders subconsciously use AI to justify breaking their rules.
That is dangerous.
AI is extremely good at constructing persuasive arguments.
If a trader asks:
“Why might averaging down still make sense here?”
AI will likely produce a sophisticated answer.
But sophistication is not edge.
If the strategy prohibits averaging down, then the AI should reinforce the rule — not help rationalise exceptions.
The purpose of AI in trading is not to create emotional flexibility.
It is to create process consistency.
Build prompts that reinforce your framework.
Never build prompts designed to weaken it.
AI Is Not a Replacement for Data Verification
Another misconception is that AI calculations are automatically accurate.
They are not.
LLMs can:
-
Miscalculate percentages
-
Make arithmetic mistakes
-
Misread pasted tables
-
Misinterpret incomplete data
-
Estimate instead of calculating precisely
Before acting on any AI-assisted trading output:
Always verify:
-
ATR values
-
Relative strength calculations
-
Position sizes
-
Risk percentages
-
Stop-loss distances
-
Reward-to-risk calculations
AI is a logic assistant.
Your trading platform remains the source of truth for execution-level numbers.
The Six Core Applications of AI-Assisted Trading
This framework focuses on six practical trading applications where AI adds meaningful value.
| Application | Most Relevant For |
|---|---|
| Sector Rotation Analysis | Swing traders, ETF traders, macro-aligned stock pickers |
| Risk Management Framework | Traders improving sizing discipline |
| Macro Regime Identification | Macro traders, multi-asset traders |
| Backtesting Strategy Ideas | Traders building or refining systems |
| Trading Psychology and Bias Checks | Every discretionary trader |
| Yield Curve Analysis and Sector Impact | Macro-oriented and rate-sensitive traders |
Each application works because the AI is constrained inside a defined analytical framework.
Sector Rotation Analysis With AI
Sector rotation is one of the strongest use cases for AI-assisted market analysis.
Institutional money rarely moves randomly.
Capital rotates:
-
From growth to defensives
-
From cyclicals to staples
-
From technology to energy
-
From high beta to low beta
Tracking these rotations manually across dozens of sectors and ETFs becomes inefficient.
AI helps by:
-
Comparing relative strength trends
-
Ranking sector momentum
-
Identifying emerging leadership
-
Summarising institutional flow patterns
-
Flagging divergences between price action and sector breadth
Key Rotation Threshold
A useful benchmark:
Sector outperformance of more than 3% versus SPY over a rolling four-week period often signals meaningful rotation.
Rotation typically leads economic data by several months.
That makes sector analysis especially useful for swing traders and macro-aligned positioning.
How to Run Sector Rotation Analysis with AI covers the full rotation framework. The 11 SPDR ETF performance table, how to identify rotation phase signals, how to cross-reference with macro data, and the 3% outperformance threshold worth tracking.
Risk Management Framework With AI
Most traders already know risk management rules.
The real problem is inconsistent execution.
Position sizes drift.
Stops widen emotionally.
Portfolio concentration slowly increases.
AI helps reduce these inconsistencies by standardising calculations.
Instead of estimating risk manually each time, the trader defines the framework once and lets AI apply it consistently.
Standard Risk Benchmarks
Common professional benchmarks include:
-
Risking only 1–2% of account equity per trade
-
Limiting sector concentration to 30–35%
-
Using ATR-based stop placement
-
Maintaining minimum reward-to-risk thresholds
For swing trading, a common structure is:
Stop placement at 1.5x–2x the 14-period ATR below entry.
AI becomes valuable because it removes discretionary drift from repetitive calculations.
How to Build a Risk Management Framework with AI covers position sizing rules, ATR-based stop calculation, portfolio concentration checks, and the pre-trade compliance checklist that applies the framework mechanically before every entry.
Macro Regime Identification With AI
A trading strategy does not behave the same way across all macro environments.
Momentum strategies behave differently in:
-
Economic expansion
-
Contraction
-
High inflation
-
Disinflation
-
Liquidity-driven environments
-
Credit stress regimes
AI can help classify the current environment using predefined macro indicators.
Three High-Value Macro Signals
1. ISM Manufacturing PMI Below 50
Signals manufacturing contraction.
2. 10-Year Minus 2-Year Yield Spread Below Zero
Historically preceded every US recession in the past 50 years.
Typical lag:
12–18 months.
3. High-Yield Credit Spreads Above 400 Basis Points
Often signals rising systemic stress.
Macro regime classification helps traders avoid applying the wrong strategy in the wrong environment.
How to Identify Macro Regimes with AI covers the four-quadrant model growth vs contraction, inflation vs deflation. The data inputs for regime classification, and how to translate a regime assessment into sector and asset class positioning.
Backtesting Strategy Ideas With AI
AI is useful for logic testing.
It is not a substitute for proper quantitative backtesting.
This distinction matters.
Before coding a strategy into TradingView or Python, AI can help identify:
-
Contradictory rules
-
Weak assumptions
-
Entry/exit conflicts
-
Missing conditions
-
Regime vulnerabilities
-
Structural inconsistencies
Example
A strategy might simultaneously require:
-
High momentum
-
Low volatility
-
Mean reversion conditions
AI can quickly flag that these assumptions may conflict under certain market environments.
That saves time before deeper testing begins.
Critical Limitation
AI should not be trusted for:
-
Win rate calculations
-
Expectancy analysis
-
Sharpe ratios
-
Realistic backtests
-
Slippage modelling
-
Look-ahead bias detection
Those require dedicated quantitative tools.
How to Backtest a Strategy Idea Using AI covers the difference between AI logic testing and true quantitative backtesting, how to describe a strategy clearly enough for AI to identify its structural flaws, and the four questions that surface the most critical design problems.
Robustness Guidelines
A strategy should ideally demonstrate:
-
Positive expectancy across at least three different market regimes
-
Meaningful sample sizes
-
Stable performance characteristics over time
As a rule of thumb:
Fewer than 30 trades is usually insufficient for statistical confidence.
Trading Psychology and Bias Checks With AI
Technical systems fail less often than human behaviour.
Most trading damage comes from psychological drift.
The challenge is that cognitive biases rarely feel irrational in real time.
Examples:
-
FOMO feels like opportunity recognition
-
Anchoring feels like conviction
-
Revenge trading feels like confidence
-
Overtrading feels productive
AI cannot eliminate emotions.
But it can expose behavioural inconsistencies objectively.
A trader can feed:
-
Journal entries
-
Trade rationales
-
Execution notes
-
Emotional commentary
And ask the model to identify recurring behavioural patterns.
AI works here as a mirror.
Not a cure.
The behavioural correction still belongs to the trader.
But objective pattern recognition dramatically improves self-awareness.
How to Use AI for Trading Psychology and Bias Checks covers the pre-trade steelman check, the post-loss debrief structure, and how AI surfaces recurring cognitive patterns in your trading from the journal entries you provide.
Yield Curve Analysis and Sector Impact With AI
The yield curve is one of the most important macro indicators in financial markets.
It acts simultaneously as:
-
A recession indicator
-
A liquidity signal
-
A sector rotation framework
-
A macro regime classifier
Most retail traders know only the recession narrative.
Fewer understand how the yield curve affects sector positioning in real time.
Three Critical Yield Curve Signals
1. 10-Year Minus 2-Year Spread Below Zero
Historically associated with elevated recession probability.
Typical lead time:
12–18 months.
2. Re-Steepening After Inversion
Often more dangerous for equities than inversion itself.
It can signal recessionary dynamics beginning to materialise.
3. 10-Year Treasury Yields Above 4.5%
Historically creates pressure on:
-
Utilities
-
REITs
-
Dividend-sensitive sectors
Because fixed-income alternatives become more attractive.
AI helps connect these macro developments to actionable sector implications.
How to Analyze Yield Curve Moves and Sector Impact Using AI covers the three curve configurations steepening, flattening, inverted - their sector implications, and how to combine yield data with ETF performance to identify where the rate environment is creating tailwinds and headwinds.
How to Build Strategy-Specific AI Prompts
The quality of AI-assisted trading depends almost entirely on prompt structure.
Generic questions produce generic answers.
Professional prompts contain operational constraints.
Four elements matter most.
1. Holding Period
A day trader and a position trader interpret the same chart differently.
Always specify:
-
Intraday
-
Swing trade
-
Position trade
-
Multi-week trend
Time horizon changes everything.
2. Entry and Exit Rules
AI must know:
-
What qualifies as a valid entry
-
What invalidates the setup
-
What triggers profit-taking
-
What triggers exits
Without rules, the model cannot evaluate the setup properly.
3. Risk Parameters
Include:
-
Account size
-
Risk-per-trade percentage
-
Stop methodology
-
Position sizing rules
-
Maximum exposure limits
This transforms AI from commentary into execution support.
4. Exclusion Rules
This is where most traders fail.
Define what not to trade.
Examples:
-
No earnings-week entries
-
No low-volume setups
-
No trades below moving averages
-
No trades against higher timeframe trend
One important reminder:
AI only knows the data you provide.
If earnings dates matter, include them explicitly.
Before and After - AMD Swing Trade Example
The Strategy
The trader:
-
Swing trades US technology and semiconductor stocks
-
Holding period: 5–15 days
-
Requires XLK positive relative strength versus SPY
-
Requires AMD above 20-day EMA
-
Requires volume above 0.8x average
-
Uses ATR-based stops
-
Risks 2% per trade
-
Avoids earnings-week entries
Generic Prompt
“What do you think about AMD as a swing trade?”
Typical output:
-
Business analysis
-
Analyst opinions
-
Semiconductor industry commentary
-
Bullish and bearish scenarios
Interesting.
But operationally useless.
Strategy-Specific Prompt
Act as a technical analyst reviewing a potential swing trade in AMD.

Strategy parameters:
- Holding period: 5–15 days
- Entry requires XLK positive 5-day relative strength vs SPY
- AMD above 20-day EMA
- Volume at or above 0.8x 20-day average
- Stop at 1.5x 14-period ATR below entry
- Target at 2x stop distance
- 2% account risk
- No entries within 5 days of earnings

AMD earnings: [date]

Data provided:
- XLK relative strength data
- AMD OHLCV data
- 20-day EMA
- 14-period ATR
- Volume statistics

Tasks:
1. Verify whether all conditions are met
2. Identify any failed condition
3. Calculate stop level
4. Calculate target level
5. Calculate position size for a $50,000 account
6. Verify all calculations exactly
Now the output becomes:
-
Clear
-
Structured
-
Directly actionable
-
Strategy-compliant
This is where AI becomes genuinely useful for trading.
Frequently Asked Questions
Q: Why is generic AI advice ineffective for professional trading?
Generic AI outputs are usually broad, balanced, and non-committal. They may explain market conditions well, but they rarely align with a trader’s actual system, risk tolerance, holding period, or execution rules.
Professional trading requires strategy alignment. That means feeding the AI your exact criteria — entry triggers, exit conditions, risk limits, exclusions, and time horizon — so the output becomes directly actionable instead of merely descriptive.
Without alignment, AI generates commentary.
With alignment, it supports disciplined execution.
Q: How can I ensure my AI-assisted trading prompts stay within my strategy?
Use a constraint-first prompting approach.
Instead of asking open-ended questions, define your strategy guardrails inside every prompt:
-
Holding period
-
Risk-per-trade limits
-
Volume thresholds
-
Entry and exit rules
-
Exclusion conditions
Equally important is defining what not to trade.
Strong exclusion rules prevent AI from suggesting setups outside your proven edge.
The objective is not to let AI invent trades.
The objective is to make AI operate strictly within your framework.
Q: Does using AI for trading require advanced programming or coding skills?
No.
While coding helps for deep quantitative research and automation, many of the most valuable AI-assisted workflows require no programming at all.
LLMs are highly effective for:
-
Logic testing
-
Bias checks
-
Strategy consistency reviews
-
Trade journaling analysis
-
Process validation
By describing your strategy clearly in plain language, AI can help identify structural flaws, conflicting conditions, or behavioural inconsistencies.
However, statistical validation — such as expectancy calculations, Sharpe ratios, and realistic backtesting — still requires dedicated quantitative platforms like TradingView or Python.
AI handles the logic layer.
Quantitative tools handle the statistical layer.
Final Thoughts
AI will not replace trading skill.
It will not eliminate losses.
It will not predict markets consistently.
But it can improve discipline.
And discipline is where most traders lose edge.
Strategy-specific AI use works best when the underlying research is thorough. Fundamental Research with AI covers how to compress the research phase - screening, transcript analysis, ratio contextualisation, and peer comparison. So the strategy decisions this hub covers are built on a solid fundamental foundation.
Applying these strategy frameworks consistently requires a systematic prompt approach. Prompt Engineering and Automation for Traders covers how to build a prompt library for the specific analytical tasks this hub introduces, chain them into a research workflow, and embed them in a Claude Project that knows your strategy rules.
The traders who benefit most from AI will not be the ones asking the broadest questions.
They will be the ones who:
-
Define precise frameworks
-
Build strict constraints
-
Validate logic systematically
-
Reinforce process consistency
-
Use AI as structure rather than entertainment
That is where strategy-specific AI becomes genuinely powerful.
Not as a replacement for judgment.
But as a reinforcement layer for disciplined execution.