
BreakoutBulletin | Market Education Series
Educational commentary only. Not investment advice. Past performance does not guarantee future results.
Why the Strangle Exists
The earnings straddle guide established the core problem with buying options before earnings: you are paying peak extrinsic value, absorbing maximum IV crush, and requiring a large move just to break even. Both strategies need the stock to move significantly to profit.
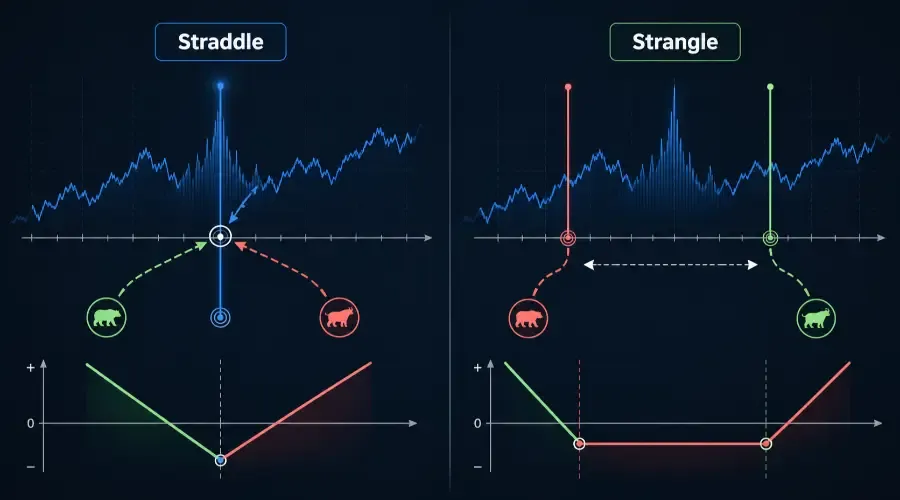
The earnings strangle strategy solves the cost problem by moving both strikes away from the current price – buying an OTM call above the stock and an OTM put below it simultaneously. Lower strike price on the put, higher strike price on the call, both out of the money. The combined premium is lower than the ATM straddle. The breakevens are wider. The stock must move further before the position profits. This makes the options strangle vs straddle decision a direct tradeoff between cost and required move distance.
This is the fundamental tradeoff the strangle introduces: cheaper entry in exchange for a higher movement requirement. Whether that tradeoff is worth making depends entirely on the relationship between the option prices chosen, the stock's historical earnings move, and the IV rank environment at entry – the same analytical framework as the straddle, with one additional layer: strike width selection.
Understanding when to use a strangle instead of a straddle, and how to select strikes that give the structure a genuine edge, is the complete analytical task this guide addresses. For traders focused on trading volatility with strangles, strike calibration is everything.
Straddle vs Strangle: The Precise Difference
Both strategies buy a call and a put simultaneously. The difference is strike placement.
Straddle: Call and put at the same strike, both at the money. Example: stock at $100, buy $100 call and $100 put.
Strangle: Call and put at different strikes, both out of the money. Example: stock at $100, buy $105 call and $95 put.
The straddle begins accumulating intrinsic value the moment the stock moves in either direction from the entry price. The strangle begins accumulating intrinsic value only after the stock clears the OTM strike – it must first travel through the gap between current price and the strike before generating intrinsic value.
Both legs are long options – there is no assignment risk for the buyer. The maximum loss on a strangle is limited entirely to the total premium paid, identical to the straddle in structure if not in amount.
This gap is the strangle's defining characteristic. It is simultaneously the source of lower cost and the source of higher breakeven. The wider the gap – the further OTM the strikes – the cheaper the structure and the further the stock must move.
The three questions strangle construction requires answering:
How far OTM should the strikes be placed?
Does the lower premium justify the wider breakeven?
Does the stock's historical earnings move support the structure at the chosen width?
These three questions are answered sequentially in the strike selection methodology below.
IV Rank – Same Primary Filter, Same Thresholds
| IV Rank Before Earnings | Strangle Viability | Reasoning |
|---|---|---|
| Below 30 | Most favourable | Options cheap – implied move modest – actual move more likely to exceed it |
| 30-50 | Selectively viable | Neutral – requires Move Ratio confirmation |
| 50-70 | Marginal | IV crush risk elevated – dollar loss lower but percentage loss severe |
| Above 70 | Avoid | Options extremely expensive – crush overwhelms any directional move |
Why the thresholds are identical to the straddle: OTM options are cheaper in absolute dollar terms than ATM options, meaning the dollar loss from IV crush is lower even if the percentage loss is higher. The additional filtering work in the strangle is done by the Strangle Move Ratio – the strike calibration tool introduced below – not by tightening the IV rank ceiling. An identical IV rank environment with a well-calibrated strike width produces comparable structural edge to the straddle.
The same practical reality applies: For liquid large-cap names – mega-cap tech, major financials, semiconductors – IV rank below 30 before earnings is uncommon. The below-30 condition appears more frequently on mid-cap S&P 500 names with less options market attention. If the IV rank filter eliminates most setups, it is working correctly.
The Implied Move Calculation
The implied move calculation is identical to the straddle guide and is the second input alongside IV rank:
Implied Move % = (ATM Call Price + ATM Put Price) ÷ Stock Price × 100
The strangle does not use the ATM options for entry – but the ATM implied move remains the reference benchmark against which the strangle's strike width is calibrated.
The move comparison ratio:
Historical Average Move ÷ Implied Move = Move Ratio
Move ratio above 1.0 → historical moves exceed implied → straddle or strangle buyer has historical edge
Move ratio below 1.0 → implied move exceeds historical → premium seller has historical edge
When IV rank is above 70 and the move ratio is below 1.0, the structural edge belongs to the premium seller – covered in the IV Crush strategy guide.
IV Crush and OTM Options
The IV crush mechanism is identical to the straddle – front-month IV collapses 40-70% after earnings regardless of stock movement. For the strangle, the IV crush vulnerability has one additional dimension.
When IV collapses after earnings, ATM options lose extrinsic value proportionally. OTM options can lose all extrinsic value entirely – going to near zero – even when the stock moves significantly, if the move does not reach the OTM strike. A straddle always retains intrinsic value once the stock moves away from the strike. A strangle retains zero value until the stock clears the OTM strike.
A critical warning on delta decay for OTM options: If the stock moves away from your OTM call, that leg's delta can collapse from 0.30 to 0.05 in a single session. For example, a call with 30 days to expiration might have a delta of 0.35 when the stock is $100 and the strike is $105. If the stock drops to $97 the next day, that same call's delta can drop to 0.12. The call becomes nearly worthless – not because of IV crush yet, but because the probability of ever reaching the strike has plummeted. This is why OTM options earnings strategy requires monitoring both legs, not just the side the stock is moving toward.
This all-or-nothing intrinsic value profile is why strike calibration – not IV rank threshold tightening – is the strangle's primary risk management tool. A well-calibrated strike placed at the historical average move distance provides the structural protection that a lower IV rank ceiling was incorrectly used to approximate.
Strike Width Selection: The Core Analytical Task
Step One – Calculate the historical move distribution.
Collect the last 8 earnings announcements for the stock. Record the absolute move percentage (ignoring direction) for each. Calculate:
The average move
The median move
The minimum move
The maximum move
Example: AAPL over 8 quarters – moves of 4.1%, 7.8%, 3.2%, 5.6%, 8.9%, 4.4%, 6.1%, 5.3%. Average: 5.68%. Median: 5.85%. Min: 3.2%. Max: 8.9%.
Important: Use only the six earnings announcements preceding each trade in live application – no forward-looking data. The historical average must be calculated from pre-trade information only.
Step Two – Calculate the implied move.
Use the ATM formula: (ATM Call + ATM Put) ÷ Stock Price × 100.
Example: ATM call $4.20, ATM put $3.80, stock $175. Implied move: ($4.20 + $3.80) ÷ $175 × 100 = 4.57%.
Step Three – Select strike width using the historical average.
Set both OTM strikes at approximately the historical average move distance from current price.
Continuing the AAPL example: Historical average move 5.68%. Call strike: $175 × 1.057 = $185.00 (5.7% OTM). Put strike: $175 × 0.943 = $165.00 (5.7% OTM). Both strikes placed at the historical average.
Step Four – Verify premium and calculate the Strangle Move Ratio.
After selecting strikes, calculate total premium and breakevens:
AAPL example continued: $185 call costs $2.80. $165 put costs $2.40. Total premium: $5.20. Upper breakeven: $185.00 + $5.20 = $190.20. Lower breakeven: $165.00 − $5.20 = $159.80. Required move to upper breakeven: ($190.20 − $175) ÷ $175 × 100 = 8.7%. Required move to lower breakeven: ($175 − $159.80) ÷ $175 × 100 = 8.7%. Average required move to breakeven: 8.7%.
Strangle Move Ratio = Average Breakeven Required Move ÷ Historical Average Move
AAPL Strangle Move Ratio: 8.7% ÷ 5.68% = 1.53 – above the 1.3 threshold. This strike width is too wide for this stock – the breakeven requires a move 53% larger than AAPL historically delivers. Adjust by narrowing the strikes.
Revised AAPL: Move strikes to $183 call and $167 put (4.6% each side). $183 call costs $3.40, $167 put costs $3.00. Total premium: $6.40. Upper breakeven: $189.40 (8.2%). Lower breakeven: $160.60 (8.2%). Move Ratio: 8.2% ÷ 5.68% = 1.44 – still above 1.3.
Further adjustment: $181 call and $169 put (3.4% each side). $181 call costs $4.10, $169 put costs $3.60. Total premium: $7.70. Upper breakeven: $188.70 (7.8%). Lower breakeven: $161.30 (7.8%). Move Ratio: 7.8% ÷ 5.68% = 1.37 – approaching threshold.
The AAPL example demonstrates a critical insight: for stocks with modest historical moves relative to their option pricing, the strangle Move Ratio may remain above 1.3 regardless of strike adjustment – which means the strangle is the wrong structure for that stock. The straddle or no trade is the correct answer.
Strangle Move Ratio thresholds:
| Strangle Move Ratio | Assessment |
|---|---|
| Below 1.0 | Structurally favourable – breakeven below historical average |
| 1.0-1.3 | Acceptable – breakeven modestly above historical average |
| Above 1.3 | Structurally unfavourable – regardless of IV rank |
The Move Ratio is calculated after strikes and premium are known. It validates the selection – it does not guide it. The sequence is: historical move → strike selection → premium calculation → Move Ratio verification. If the ratio fails, adjust strikes inward or abandon the trade.
OTM Liquidity – The Strangle-Specific Risk
ATM options are the most liquid options on any underlying. As strikes move further OTM, liquidity degrades – volume decreases and bid-ask spreads widen. This is a more serious concern for strangles than for straddles. Options liquidity and bid-ask spreads are often the silent killer of otherwise sound strangle setups.
Before finalising strike selection, verify the bid-ask spread on the specific OTM strikes chosen – not just the ATM options. A strangle on a mid-cap stock can have 20-30% bid-ask spreads on the OTM legs, making mid-price fills unrealistic. At 25% spread on each leg, the effective entry cost is meaningfully higher than the mid-price premium used in all theoretical calculations.
Real-world slippage example: Suppose an OTM call has a mid-price of $2.00, but the bid is $1.80 and the ask is $2.20. The spread is 20% of mid. If you buy at the ask ($2.20) and later need to exit at the bid ($1.80), you lose $0.40 – 18% of your entry – just from crossing the spread. On a strangle with two legs, you are down roughly 10-15% on the total position immediately upon entry, before the stock has moved a single cent. This friction is why many strangles fail even when the math says they should work.
The OTM liquidity rule: If the bid-ask spread on either OTM strike exceeds 10% of mid-price, either move the strikes closer to ATM (narrower strangle, lower Move Ratio, higher cost) or abandon the trade. A theoretically sound strangle executed at unfavourable fills produces losses that the backtest data does not reflect.
This is the primary reason strangle transaction costs are higher than straddle transaction costs in practice – and why the methodology note in the performance section quantifies the realistic cost impact separately.
Symmetric vs Asymmetric Strangles
The standard strangle places both strikes equidistant from the current price – a symmetric structure that gives equal probability of either strike being reached.
An asymmetric strangle deliberately places one strike closer than the other, reflecting a directional bias without fully committing to a single direction.
When to use an asymmetric strangle: The technical chart setup before earnings provides a clear directional lean. A stock in a confirmed uptrend with RS line at new highs approaching earnings might warrant a narrower call strike (closer to current price) and wider put strike (further from current price).
The asymmetric construction guideline: The closer strike should be at least 2-3% OTM to avoid paying near-ATM prices. A common starting point is placing the wider strike at 1.5-2× the closer strike's distance from current price – enough separation to create meaningful asymmetry without paying near-symmetric premium. Adjust based on the specific stock's historical move distribution rather than treating this as a fixed rule. The Move Ratio must still be calculated for both breakevens independently and both should remain below 1.3.
This is an advanced modification appropriate only when both technical and fundamental evidence clearly support a directional lean. For the majority of earnings strangles, the symmetric structure is the correct and complete answer.
The P&L Profile: What Happens at Every Price
Based on a symmetric strangle: stock at $100, $106 call at $2.20, $94 put at $2.00, total premium $4.20. Upper breakeven: $110.20. Lower breakeven: $89.80.
| Stock Price at Expiry | Call Value | Put Value | Total Value | P&L |
|---|---|---|---|---|
| $82 (−18%) | $0.05 | $12.00 | $12.05 | +$7.85 |
| $89.80 (lower breakeven) | $0.05 | $4.20 | $4.25 | ~$0 |
| $94 (put strike) | $0.05 | $0.05 | $0.10 | −$4.10 |
| $100 (flat) | $0.10 | $0.10 | $0.20 | −$4.00 |
| $106 (call strike) | $0.05 | $0.05 | $0.10 | −$4.10 |
| $110.20 (upper breakeven) | $4.20 | $0.05 | $4.25 | ~$0 |
| $118 (+18%) | $12.00 | $0.05 | $12.05 | +$7.85 |
Three observations this table reveals that the Move Ratio alone does not:
First, the maximum loss zone is wider than the straddle's. The strangle loses its full premium across the entire range between the two OTM strikes – from $94 to $106, a 12% band, the position decays to near zero. The straddle's maximum loss is at a single point (at the strike).
Second, if the stock moves exactly to the OTM strike but not through it, the position is at near-maximum loss despite the stock having moved 6%. This is the all-or-nothing characteristic of OTM options.
Third, once the stock clears a breakeven, profit accelerates – the strangle's leverage beyond the breakeven is comparable to the straddle's because the OTM option is now generating intrinsic value on a lower cost basis.
Understanding the three profit zones:
You can think of the strangle's P&L curve in three distinct zones:
Zone A – The Valley of Death: Between the two OTM strikes (from $94 to $106 in this example). Here the position is at maximum or near-maximum loss. Both options have minimal extrinsic value and no intrinsic value. The stock can move 5% and still be stuck in this zone.
Zone B – The Recovery Zone: Between an OTM strike and its breakeven (from $106 to $110.20 on the upside, or $89.80 to $94 on the downside). The option is now in the money, but the gain in intrinsic value is still less than the premium paid. The position is still losing money but approaching breakeven.
Zone C – The Profit Zone: Beyond the breakeven (above $110.20 or below $89.80). Here intrinsic value exceeds the premium paid. Profit accelerates dollar-for-dollar with further stock movement.
If the stock opens exactly at the OTM strike: The option has zero intrinsic value and minimal time value. Exit immediately for whatever residual premium remains rather than waiting for further movement that may not materialise. Do not hold hoping the stock continues through the strike – you are at maximum risk with minimal reward at that specific price.
Position Sizing
The straddle sizing methodology applies directly: maximum 2% of account in any single earnings strangle, adjusted by IV rank.
One strangle-specific sizing consideration: the defined maximum loss on a strangle is typically 30-50% lower in absolute dollar terms than an equivalent straddle on the same underlying. This lower cost does not justify increasing the number of contracts proportionally. The probability of losing the full premium on a strangle is higher than on a straddle – the OTM strikes can expire worthless on moves that a straddle would have profited from.
Do not size up simply because the strangle is cheaper than the straddle.
IV Rank at Entry
| IV Rank at Entry | Maximum Position Size |
|---|---|
| Below 30 | 2% of account |
| 30-50 | 1.5% of account |
| 50-70 | 0.75% of account |
| Above 70 | No entry |
Pre-Entry Checklist
| Condition | Threshold | Check |
|---|---|---|
| IV rank at entry | Below 50 – ideally below 30 | Yes / No |
| Implied move calculated | (ATM Call + ATM Put) ÷ Stock Price | Yes / No |
| Historical move distribution | Last 6-8 pre-trade earnings, average and range recorded | Yes / No |
| Strikes set using historical average | Call/put strikes near historical average move from current price | Yes / No |
| Premium calculated post-strike selection | Total cost recalculated after strike choice | Yes / No |
| Strangle Move Ratio below 1.3 | Average breakeven required move ÷ historical average | Yes / No |
| OTM liquidity confirmed | Both OTM strikes: bid-ask spread below 10% of mid-price | Yes / No |
| Options volume confirmed | Both OTM strikes: avg volume above 500 contracts/day | Yes / No |
| Asymmetric structure justified | Only if clear technical directional lean – not default | Yes / No |
| Position size within 2% rule | Total premium ≤ 2% of account | Yes / No |
| IV rank sizing applied | Reduced if IV rank above 30 | Yes / No |
| Earnings date confirmed from two sources | Company IR page + options chain IV spike confirms date | Yes / No |
| Options approval level confirmed | Level 3 or Level 4 depending on broker | Yes / No |
| Tax treatment noted | Short-term gains taxed as ordinary income in most jurisdictions | Yes / No |
Managing the Strangle
Before earnings:
The same partial-exit discipline from the straddle guide applies. If IV continues rising after entry and the strangle is profitable before the announcement, taking 50-75% of profit before earnings eliminates IV crush risk on that portion.
After earnings – the overnight gap and opening spread:
Earnings reactions typically occur overnight. Options open with wide bid-ask spreads in the first 15-30 minutes as market makers reprice IV at the new stock level. OTM options are particularly vulnerable to wide opening spreads – the leg that moved away from the stock may be nearly worthless with a 30-40% bid-ask spread, while the leg that moved toward the stock may have a 15-20% spread. Wait 20-30 minutes after the open for spreads to normalise before exiting – unless the position is in significant loss territory, in which case exit at whatever the market offers.
After earnings – the OTM management challenge:
If the stock moves 6% and the call strike is 7% OTM, the position has not yet generated intrinsic value despite a significant stock move. The management decision: hold for continuation or exit for residual time value.
Hold the approaching leg if: volume is above the 20-day average confirming institutional participation, price is accelerating toward the strike, and the move is consistent with gap-and-go structure.
Exit both legs if: the stock opens beyond both strikes simultaneously (immediate intrinsic value – take it), or if the stock moves less than 50% of the distance to either strike on earnings day.
Legging out:
If the stock reaches one breakeven and momentum stalls, selling the profitable leg locks in its value while leaving the other leg as residual exposure at no cost. This converts the position to a single long option with no additional risk. Use only if the profitable leg has moved well into the money and the reversal risk is real.
Pin risk warning – critical for weekly options:
If the stock closes within $0.50 of either OTM strike on expiration Friday, exit before 3:30 PM ET. The OCC automatically exercises options $0.01 or more in the money – leaving you with 100 shares of stock per contract rather than a cash settlement. Exit both legs before expiration Friday close without exception.
Stop loss:
If the stock moves less than 50% of the distance to either strike on earnings day, both legs are likely to expire worthless. Exit before market close to recover residual value – typically 10-20% of premium – rather than holding to expiration.
Strangle vs Straddle: When to Choose Each
| Condition | Use Straddle | Use Strangle |
|---|---|---|
| IV rank | Below 30 | Below 30 – same filter |
| Move Ratio | Above 1.0 vs implied | Move Ratio below 1.3 after strike calibration |
| Historical move vs implied | Modest edge – small moves exceed implied | Significant edge – large historical moves |
| Premium budget | Higher absolute cost | Lower absolute cost |
| Directional conviction | None | Slight – asymmetric modification available |
| Account size | Larger – ATM premium affordable | Smaller – OTM reduces absolute cost |
| Stock behaviour | Medium historical movers | Large historical movers – OTM strikes reachable |
| Liquidity requirement | ATM – always liquid | OTM – verify before entry |
The single most useful selection rule: if the Strangle Move Ratio cannot be brought below 1.3 regardless of strike adjustment, use the straddle or no trade. The ratio failing is the market telling you that OTM options on this stock are too expensive relative to its historical behaviour.
Observed Performance Data
Based on systematic review of OTM earnings strangles on S&P 500 large-cap stocks, strikes placed at approximately 1× pre-trade historical average move from current price (calculated using the six earnings announcements preceding each trade – no forward-looking data), entered 1 session before earnings with front-month expiration, January 2019–December 2025. Performance segmented by IV rank at entry and Strangle Move Ratio. n=934 qualifying setups.
Methodology note: Entries are one session before earnings to isolate the IV rank and Move Ratio effects – the recommended 7-14 day pre-entry window shows improved expected value through lower initial premium and pre-earnings profit opportunities, but introduces holding-period variables not cleanly attributable to the filters being tested. The relationship between IV rank, Move Ratio, and expected value holds in both entry windows; the earlier entry provides additional management flexibility not captured here.
OTM options carry wider bid-ask spreads than ATM options. Realistic transaction costs for strangles are higher than for straddles – reducing expected value by approximately 10-20% rather than the 5-15% noted for the straddle. At IV rank below 30 with Move Ratio below 1.0, positive expected value likely survives realistic OTM transaction costs. At IV rank 30-50, transaction costs may eliminate the marginal edge. Dataset limited to S&P 500 large-cap constituents – survivorship bias applies. Live results will differ.
IV Rank / Move Ratio
| IV Rank / Move Ratio | Setups (n) | Profitable (%) | Avg P&L (% of premium) | Expected Value |
|---|---|---|---|---|
| IV <30, Ratio <1.0 | 143 | 49% | +62% | +0.72R |
| IV <30, Ratio 1.0-1.3 | 98 | 41% | +28% | +0.36R |
| IV 30-50, Ratio <1.0 | 187 | 38% | +14% | +0.19R |
| IV 30-50, Ratio 1.0-1.3 | 156 | 31% | −8% | −0.14R |
| IV >50, All | 350 | 23% | −38% | −0.81R |
The joint filter – IV rank below 30 combined with Strangle Move Ratio below 1.0 – produces the highest expected value in the dataset. The Move Ratio is the differentiator at comparable IV rank levels: the same IV environment produces positive expected value with a well-calibrated strike width and negative expected value with a poorly calibrated one. Strike selection is not cosmetic – it is the primary determinant of strangle edge beyond the IV rank filter.
Frequently Asked Questions (FAQ)
Q: What is the main advantage of a Strangle over a Straddle for earnings?
A: The primary advantage is lower cost. Because you are buying Out-of-the-Money (OTM) options rather than At-the-Money (ATM) options, the total premium paid is significantly less. This allows for lower absolute dollar risk, though it requires a larger price move to reach profitability.
Q: What is the "Strangle Move Ratio"?
A: It is a calibration tool used to determine if a trade is structurally sound. It is calculated by dividing the Required Move to Breakeven by the Historical Average Earnings Move. A ratio below 1.3 is generally considered acceptable, while a ratio below 1.0 indicates a high-probability setup.
Q: Why are OTM options riskier during IV Crush?
A: OTM options consist entirely of extrinsic value. When Implied Volatility (IV) collapses after earnings, these options can lose 100% of their value if the stock does not move past the strike price. Unlike a straddle, which always retains some intrinsic value if the stock moves at all, a strangle can expire worthless even after a 5% or 6% move.
Q: When should I choose a Strangle instead of a Straddle?
A: Choose a Strangle when you expect an outsized move (greater than what the market is pricing) or when you have a smaller account and need a lower-cost entry. However, you must ensure the OTM strikes are liquid and have a bid-ask spread below 10%.
Quick Reference
Step 1 – IV Rank Check
| IV Rank | Action |
|---|---|
| Below 30 | Full size – most favourable |
| 30-50 | Half size – selective |
| 50-70 | Avoid |
| Above 70 | No entry |
Step 2 – Historical Move Analysis
Collect last 6-8 pre-trade earnings moves → calculate average, median, min, max
No forward-looking data – pre-trade history only
Step 3 – Strike Selection and Move Ratio
Set call and put strikes at approximately historical average move from current price
Calculate total premium after strike selection
Calculate Strangle Move Ratio: average breakeven required move ÷ historical average
Ratio must be below 1.3 – if not achievable, use straddle or no trade
Step 4 – OTM Liquidity Check
Both OTM strikes: bid-ask spread below 10% of mid-price
Volume above 500 contracts/day on both legs
If either fails – narrow strikes or abandon trade
Step 5 – Sizing
Maximum 2% of account – same as straddle
Do not size up because strangle costs less than straddle
Step 6 – Management
Up 40%+ before earnings → take 50-75% off
Stock opens exactly at OTM strike → exit immediately for residual value
Morning after earnings → wait 20-30 minutes for spread normalisation
Less than 50% distance to nearest strike on earnings day → exit residual
Weekly options: exit before 3:30 PM ET on expiration Friday – pin risk
BreakoutBulletin | Market Education Series. Educational commentary only. Not investment advice. Performance data based on S&P 500 large-cap OTM earnings strangle review, strikes at approximately 1× pre-trade historical average move, front-month expiration entered one session before earnings, January 2019–December 2025, n=934 qualifying setups. Live results will differ.