
BreakoutBulletin | BB Trading Frameworks Series
Part of the 5-Layer Trading Framework Master Guide
Educational commentary only. Not investment advice.
Markets Move in Layers – The Index Hides More Than It Shows
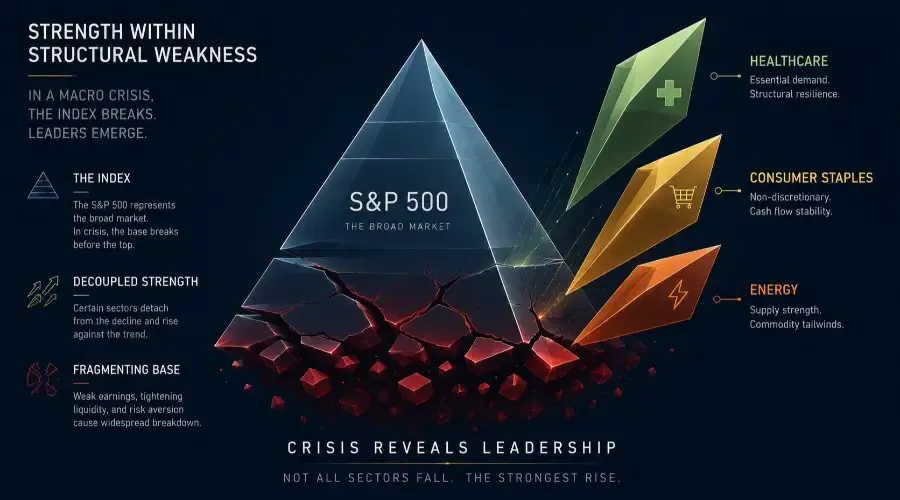
When the S&P 500 falls, most investors assume uniform damage across the market. The index reflects an average, and averages obscure the distribution beneath them. During every significant market decline on record, some sectors have moved opposite to the index – not randomly, but because a specific macro mechanism was creating genuine earnings advantage for those businesses at the same time broader conditions were deteriorating.
The three cases below – energy in 2022, defensives in 2008, and technology in 2020 – each illustrate a different macro mechanism that produced sector strength amid index weakness.
Historical examples help make the pattern recognition structure behind the hidden strength framework more concrete. Each case study below documents a different macro mechanism, a different sector beneficiary, and a different signal profile – but the same underlying structure.
Case Study 1: Energy in 2022 – Supply Shock Divergence
What Happened
The S&P 500 declined approximately 19% across 2022. Rising interest rates compressed growth stock valuations. Technology fell 33%. Consumer Discretionary fell 37%. It was the worst calendar-year performance for the index since 2008.
The energy sector gained approximately 59%.
The Macro Mechanism
Three forces converged simultaneously, each reinforcing the others.
First, the Russia-Ukraine conflict that began in February 2022 removed a significant source of global oil and natural gas supply. Russia had accounted for approximately 10% of global oil production and was the primary natural gas supplier to Europe. The supply disruption was immediate and structural – the energy infrastructure could not be redirected within months.
Second, post-COVID demand recovery was running hotter than supply could accommodate. Air travel, road transportation, and industrial activity were all rebounding from 2020–2021 lows at the same time supply was contracting.
Third, a decade of underinvestment in new production during the low-price period of 2015–2020 meant the industry had limited spare capacity to absorb the demand surge. New oil fields take 5–8 years from discovery to production. The supply response to 2022 prices could not arrive until 2027 or later.
Brent crude moved from approximately $75 at the start of 2022 to above $120 by June. For energy producers with largely fixed cost structures, this price move translated directly into margin expansion. Operating leverage amplified the revenue increase into earnings growth of 150% or more for major producers.
The Hidden Strength Signals
The energy sector began showing Stage 1 and Stage 2 accumulation signals in late 2021, before the Russia-Ukraine conflict became the dominant narrative. Volume on XLE (Energy Select Sector ETF) was running above its 20-session average through November and December 2021 while the broader index was still near all-time highs. Several major energy names were holding prior support levels during the late-2021 index pullback.
By January 2022, Stage 3 visible divergence was developing – energy stocks were rising on days the index was declining. By the time this became an obvious consensus trade in March 2022, the sector had already gained 20–25% from the late-2021 accumulation phase.
The 2026 Parallel
Current geopolitical conditions in the Middle East are creating a similar, though not identical, supply risk dynamic. The supply disruption mechanism is the same. The demand context differs – global growth is slowing rather than recovering. Whether this dynamic translates into similar sector outperformance depends on whether supply disruption or demand deterioration proves to be the dominant force.
Case Study 2: Defensives in 2008 – Relative Resilience During Systemic Stress
What Happened
The S&P 500 declined approximately 38% during 2008. Financials fell 55%. Energy fell 35%. Technology fell 43%.
Consumer Staples fell approximately 15%. Healthcare fell approximately 23%. Both significantly outperformed the index on a relative basis.
The Macro Mechanism
The 2008 case is structurally different from 2022. There was no sector with positive absolute returns. The divergence was entirely relative – some sectors fell significantly less because their earnings were structurally insulated from the financial crisis.
Consumer Staples companies sell products with non-discretionary demand. Procter & Gamble's revenue from soap, detergent, and personal care products did not decline materially in 2008 because households continued purchasing these items regardless of economic conditions. The same logic applied to food and beverage companies.
Healthcare operated on a similar principle. Patients did not defer cancer treatment or essential prescription medications because of the financial crisis. Hospital admissions and pharmaceutical revenues were structurally immune to the credit contraction driving the broader decline.
S&P 500 earnings fell approximately 23% in 2008. Consumer Staples earnings fell approximately 5%. Healthcare earnings were broadly stable. That earnings differential, maintained through the crisis, is what produced the relative outperformance in stock prices.
The Hidden Strength Signals
The 2008 case is instructive because the hidden strength signals appeared in relative terms, not absolute. In mid-2007, as financial stocks began showing stress, Consumer Staples and Healthcare were not rising – they were simply declining less. XLP (Consumer Staples ETF) was making higher relative lows against the S&P 500 across the second half of 2007.
The key signal was the divergence between sector price structure and index price structure, not absolute strength. Sectors that held their prior support levels while the index broke lower were showing institutional preference – capital rotating toward earnings stability before the severity of the crisis became consensus.
What This Case Illustrates
The 2008 case establishes that hidden strength does not always produce positive absolute returns. During systemic stress events, relative outperformance – falling less – is the analytical objective and the practical earnings-preservation mechanism. Investors who rotated into Consumer Staples from Financials in mid-2007 lost approximately 15% through 2008. Those who stayed in Financials lost 55%. The relative outcome was a 40-percentage-point advantage despite still generating a negative absolute return.
This matters for how the framework is applied. Historically, the analytical objective in such environments has been relative outperformance, not necessarily positive returns.
Case Study 3: Technology in 2020 – Structural Demand Shift
What Happened
The S&P 500 fell approximately 34% from February 20 to March 23, 2020 – one of the fastest market declines in history. By year-end 2020, the index had gained approximately 16% for the full calendar year.
Technology gained approximately 44% for 2020. Consumer Discretionary gained approximately 33%. Energy fell approximately 37%.
The Macro Mechanism
The 2020 divergence differs from both 2022 and 2008 in a structural way: the macro mechanism was a demand shift rather than a supply shock or earnings preservation dynamic.
Remote work, digital communication, e-commerce, and cloud computing services became structurally necessary within weeks of the COVID lockdowns beginning. Companies that had been planning multi-year digital transformation initiatives accelerated them into months. Enterprise software spending, cloud infrastructure capacity, and remote collaboration tools all saw demand surge simultaneously.
This structural demand shift produced a different divergence profile. Technology stocks did not simply fall less in 2020 – they recovered faster and then accelerated above pre-crisis levels. Microsoft, Amazon, and Alphabet were significantly higher by mid-2020 than they had been before the crash.
The Hidden Strength Signals
The 2020 case is the hardest to identify in advance because the macro mechanism (a global pandemic forcing structural behaviour change) was not predictable. However, the accumulation signals appeared quickly after the initial crash.
By early April 2020, cloud computing and e-commerce names were showing Stage 1 volume signals while the broader market was still in deep drawdown. XLK (Technology ETF) was recovering faster than the index from the March 23 low, with volume consistently above average on up days and below average on down days – the classic institutional accumulation volume pattern.
By May 2020, Stage 2 and Stage 3 signals were visible: technology names were making higher lows while the broader index was still recovering, and sector leadership was concentrating in the names with the most direct structural demand tailwinds (cloud, e-commerce, digital payments).
Why 2026 Is Not 2020
The 2020 technology divergence was driven by a structural demand shift in a zero-rate environment. Both conditions are absent in 2026. Real yields near 2.1% create a structural headwind for long-duration growth stocks regardless of demand conditions. And no equivalent structural demand shift is currently visible. The technology sector in 2026 is facing the opposite dynamics: elevated discount rates and revenue visibility challenges rather than accelerating demand and accommodative monetary policy.
This comparison matters because the most common analytical error is assuming the sector that led the last divergence will lead the next one. The mechanism changes with the macro environment.
The Pattern Across All Three Cases
Three different years. Three different macro mechanisms. Three different sector beneficiaries. One consistent underlying structure.
| Case | Macro Mechanism | Leading Sector | Signal Type |
|---|---|---|---|
| 2022 | Supply shock + demand recovery | Energy | Positive absolute returns |
| 2008 | Systemic financial stress | Consumer Staples, Healthcare | Relative resilience (fell less) |
| 2020 | Structural demand shift | Technology | Fast recovery + new highs |
In every case, the hidden strength signals appeared before the divergence became consensus. Volume accumulation preceded price confirmation. Relative support held while the index broke lower. Macro mechanism alignment was identifiable before the magnitude of the move became obvious.
The sector rotation dynamics that produced these leadership shifts are not random. They follow the macro classification logic of the Sorting Hat framework – Ravenclaw in 2022, Hufflepuff in 2008, and Gryffindor in 2020 each led for macro reasons that were identifiable in advance.
Key Takeaways
| Concept | Summary |
|---|---|
| 2022 energy | Supply shock + operating leverage = 59% gain vs S&P -19%; signals visible in late 2021 |
| 2008 defensives | Earnings stability = relative resilience; Staples -15% vs S&P -38% |
| 2020 technology | Structural demand shift = fast recovery and new highs; signals appeared by April 2020 |
| Common structure | Volume accumulation → relative support → visible divergence, in that sequence |
| 2026 parallel | Energy/industrials showing Stage 1-2 signals on geopolitical supply thesis |
| Critical distinction | Mechanism changes each cycle; 2026 is not 2020 |
Go Deeper: Breakout Bulletin Trading Frameworks Series
- Stocks Rising While Market Falls – The hidden strength framework and three-stage accumulation process
- How to Read the Stock Market Like a Professional: The 5-Layer Trading Framework – Master guide to the full trading framework
- The Sorting Hat for Stocks – Which macro house led each cycle and why
- Sector Rotation Strategy – How macro mechanisms drive sector leadership changes
- Market Regime Identification Framework – Classifying the current regime to identify which mechanism is active
This article is published by BreakoutBulletin for educational purposes only. It does not constitute investment advice or a recommendation to buy or sell any security. All historical return figures are approximate and provided for illustrative purposes only. Past performance is not indicative of future results. BreakoutBulletin is an educational content platform and is not a registered investment advisor, broker-dealer, or financial institution.