
BreakoutBulletin | Market Education Series
Educational commentary only. Not investment advice. Past performance does not guarantee future results.
Why Calendar Spreads Exist in an Earnings Context
The straddle and strangle guides established the core problem with buying options before earnings: you are paying peak extrinsic value, absorbing maximum IV crush, and requiring a large move just to break even. Both strategies need the stock to move significantly to profit.
The calendar spread approaches earnings from a completely different angle. Instead of buying options and hoping for a large move, the calendar spread exploits the difference in how IV crush affects different expiration dates simultaneously. It is not a directional trade. It is not a volatility magnitude trade. It is a volatility term structure trade - a position that profits when near-term options lose value faster than longer-term options. This is the essence of the earnings calendar spread strategy.
Understanding why this happens requires understanding one concept that neither the straddle nor strangle guide required: the difference between how earnings IV affects the front-month expiration versus the back-month expiration. That difference is the engine the calendar spread runs on.
Complexity note before proceeding: The calendar spread is the most operationally complex strategy in the Options cluster. It involves a short option leg that carries assignment risk, two expirations to manage simultaneously, and a profit mechanism that depends on IV differential rather than price movement. Paper trade this strategy before committing real capital. The straddle or strangle is more appropriate for traders who have not yet managed a short options position.
The Term Structure Concept
When a company reports earnings, the uncertainty that inflates options prices is event-specific. The market does not know what the revenue number will be, what guidance management will provide, or how investors will react. This uncertainty is concentrated in the expiration that includes the earnings date. Options expiring after earnings carry some residual uncertainty but significantly less - the event will have resolved.
This creates a measurable difference in implied volatility between expirations:
Front-month options (expiring shortly after earnings): IV is heavily inflated by earnings uncertainty. IV rank for these options is often 70-90+ in the days before the announcement.
Back-month options (expiring 30-60 days after earnings): IV is elevated but moderately. Earnings uncertainty contributes less to their pricing because many other events could affect the stock before their expiration.
The difference between these two IV levels is the volatility term structure. When front-month IV is significantly higher than back-month IV - which is the typical condition before earnings - the term structure is said to be in contango (front higher than back). After earnings, front-month IV collapses while back-month IV declines only modestly. This differential collapse is what the calendar spread captures. Understanding implied volatility contango and backwardation is critical here: contango (front higher than back) is your friend; backwardation (back higher than front) is a disqualifier.
Inverted term structure - when not to trade:
Occasionally the term structure inverts - back-month IV exceeds front-month IV. This occurs when the market anticipates a longer-duration event (regulatory decision, product approval, macroeconomic catalyst) expected to resolve after the front-month but before the back-month expiration. In this condition, the standard earnings calendar reverses its profit logic - the back-month would crush more than the front-month, producing losses. The IV differential options strategy filter (front minus back must be above 10 points) screens out inverted term structure automatically. A negative or near-zero differential is a disqualifying condition. Do not attempt to reverse the position by buying the front-month and selling the back-month without considerably more options experience.
What a Calendar Spread Is
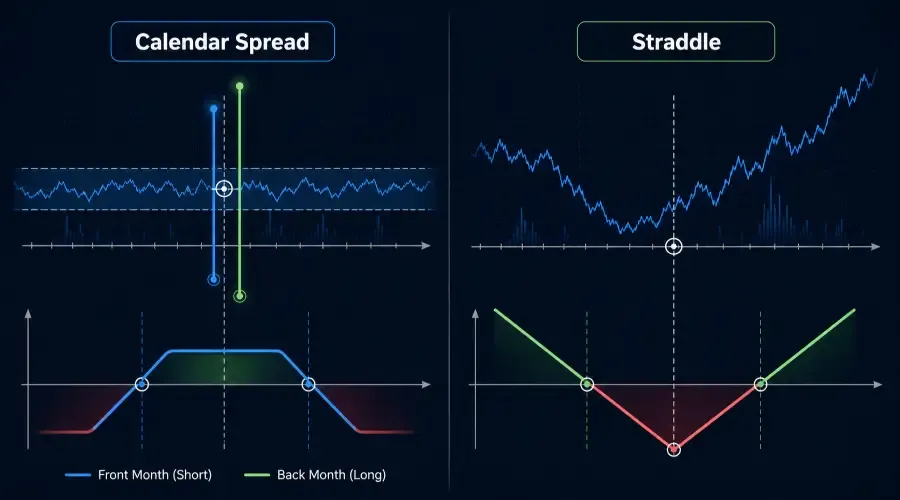
A calendar spread (also called a time spread or horizontal spread) involves:
-
Sell the near-term option (front-month, expiring shortly after earnings)
-
Buy the longer-term option (back-month, expiring 30-60 days later)
-
Both at the same strike price
The position is net debit - you pay more for the back-month option than you receive for the front-month option. The net premium paid is the maximum loss.
The profit mechanism: After earnings, the front-month option you sold collapses in value due to IV crush. The back-month option you bought loses less value because its IV declines less dramatically. The differential - front-month collapsing faster than back-month - produces profit without requiring the stock to move significantly.
Maximum profit: Occurs when the stock closes exactly at the strike price on the front-month expiration. Both options have maximum time value at this point. In practice, maximum profit occurs in a band around the strike rather than at a precise price.
Maximum loss: The net debit paid. The long back-month covers the short front-month - the position is defined-risk.
The short leg distinction: Unlike the straddle and strangle which are long-only, the calendar spread has a short front-month option. This short leg can be assigned before expiration if it moves in the money. This is the calendar spread's most important operational difference from the other earnings strategies in this cluster - and is addressed in detail in the management section.
Why Earnings Calendars Are Different From Regular Calendars
The standard calendar spread benefits from time decay - the front-month option decays faster than the back-month because theta accelerates near expiration. This produces slow, steady profit in low-volatility environments.
The earnings calendar spread is different. It is not primarily a theta trade. It is primarily a volatility differential trade - positioned to capture the IV term structure collapse that occurs when earnings resolve the front-month uncertainty without equally resolving the back-month uncertainty. This is trading time spreads for earnings as opposed to trading standard time decay.
This distinction matters because the earnings calendar does not need significant time to pass to profit. It profits rapidly - in a single session - when earnings are released and front-month IV collapses. The position can be entered, held through earnings, and exited the following morning.
The trade duration is typically 3-7 days total: enter 2-4 days before earnings, hold through the announcement, exit the morning after.
IV Term Structure as the Entry Filter
Instead of measuring IV rank for a single expiration, the calendar spread requires measuring the IV differential between front-month and back-month.
IV Differential = Front-Month IV − Back-Month IV
A large IV differential means the front-month is expensive relative to the back-month - the favourable condition because the front-month has more room to collapse relative to the back-month after earnings resolve.
A small IV differential means the expirations are priced similarly - an unfavourable condition because there is less differential compression to capture.
IV Differential thresholds for earnings calendars:
| IV Differential (Front − Back) | Calendar Viability |
|---|---|
| Above 15 volatility points | Most favourable - steep term structure |
| 10-15 volatility points | Selectively viable |
| 5-10 volatility points | Marginal - term structure too flat |
| Below 5 volatility points | Avoid - insufficient differential |
| Negative (back > front) | No entry - inverted term structure |
Most standard options platforms (ThinkorSwim, Tastytrade, Interactive Brokers) display IV by expiration. The differential is read directly from the options chain by comparing the IV column across expiration dates.
Strike Selection for Earnings Calendars
The earnings calendar strike is placed at or very near the current stock price - ATM. The reason: the calendar spread profits most when the stock stays near the strike. Moving away from the strike in either direction reduces the differential between front-month and back-month time value.
Strike selection rule: Place the strike at the ATM level - the strike nearest to current stock price.
The directional bias modification: If the technical setup suggests a clear directional lean, placing the strike one increment above or below the current price biases the profit zone toward the expected direction. This is an advanced modification appropriate only when both technical and fundamental evidence clearly support a directional lean. For the majority of earnings calendars, the ATM strike is the correct and complete answer.
Expiration Selection: The Critical Decision
Front-month selection (the short leg): The front-month expiration must include the earnings date. It should expire as soon as possible after earnings to maximise IV crush capture on the short leg. Weekly options expiring 1-2 days after earnings are ideal.
Back-month selection (the long leg): The back-month expiration should be 25-45 days after earnings. This range is optimal: close enough to be sensitive to the stock's movement and remaining IV, but far enough that its IV does not collapse dramatically with the front-month.
Specific expiration combination by earnings timing:
| Earnings Release | Front-Month | Back-Month |
|---|---|---|
| Monday AMC or Tuesday BMO | Weekly expiring that Friday | Monthly expiring 4-5 weeks later |
| Mid-week AMC | Weekly expiring that Friday | Monthly expiring 4-5 weeks later |
| Friday AMC | Weekly expiring the following Friday | Monthly expiring 5-6 weeks later |
| No weekly available | Nearest monthly after earnings | Next monthly 30 days later |
The Profit Zone: Formula and Approximation
The guide cannot state a fixed profit zone percentage because it depends on the net debit paid relative to the back-month's remaining time value at different price points - which itself depends on IV levels that are unknown at entry.
A practical approximation: Divide the back-month option's current price by the stock price. This percentage approximates the profit zone half-width on each side of the strike.
Example: Stock at $175. Back-month option costs $8.00. Approximate profit zone half-width: $8.00 ÷ $175 = 4.6%. Profit zone: approximately $175 ± 4.6%, or $166.95 to $183.05.
Higher net debit relative to back-month value narrows the profit zone. Lower net debit widens it. This is an approximation - verify with your broker's options profit/loss calculator before entry. Most platforms display the profit/loss at expiration visually, which is more accurate than any approximation formula.
Historical earnings move screen: The stock's historical earnings moves must typically fall within the estimated profit zone. If the stock has historically moved 10% on earnings and the profit zone is ±4.6%, the calendar spread is the wrong structure - use the straddle or strangle instead. The calendar is structurally appropriate only for stocks with historically modest earnings reactions.
The Vega Relationship
Every options position has a vega - how much position value changes per one-point change in implied volatility. In a calendar spread, the two legs interact to produce net volatility exposure.
The back-month option (long) has higher vega than the front-month option (short) at the same strike. The calendar spread is therefore net long vega - a small increase in back-month IV increases position value, and a larger decrease in front-month IV (the IV crush) generates the profit.
The adverse vega scenario: If both front-month and back-month IV collapse simultaneously and by similar magnitudes, the calendar loses money despite the front-month technically expiring worthless - because the back-month position also lost value proportionally. This occurs when the earnings event removes uncertainty across the entire term structure simultaneously - more common for stocks with a single dominant risk event (biotech catalyst, regulatory decision) than for standard quarterly earnings.
Another way to think about this: the horizontal spread vs straddle comparison reveals that the calendar is long volatility on the back-month and short volatility on the front-month. You want the front-month IV to crush, but you need the back-month IV to hold up. If the whole volatility surface flattens, the trade suffers.
Position Sizing for Earnings Calendars
Maximum 2% of account in any single earnings calendar - identical to the straddle and strangle sizing rule.
Broker requirements and buying power: Despite being a defined-risk net debit position, calendar spreads require the broker to recognise the long back-month as cover for the short front-month. Most brokers require Level 3 or Level 4 options approval. Some brokers additionally impose a buying power reduction on the short leg - typically 10-20% of the underlying's notional value - even when the position is fully covered by the long back-month.
Verify with your specific broker before placing the trade. A calendar that fits within the 2% account sizing rule may still be blocked if buying power requirements exceed available capital. This is particularly relevant for smaller accounts - a $10,000 account may find that a calendar spread on a $150 stock triggers buying power requirements that make the trade impractical regardless of the premium calculation.
IV differential sizing adjustment:
| IV Differential | Maximum Position Size |
|---|---|
| Above 15 points | 2% of account |
| 10-15 points | 1.5% of account |
| 5-10 points | 0.75% of account |
| Below 5 points | No entry |
Pre-Entry Checklist
| Condition | Threshold | Check |
|---|---|---|
| IV differential measured | Front-month IV − back-month IV above 10 points | Yes / No |
| Term structure confirmed in contango | Front-month IV higher than back-month IV | Yes / No |
| Front-month expiration confirmed | Includes earnings date, expires shortly after | Yes / No |
| Back-month expiration confirmed | 25-45 days after earnings | Yes / No |
| Strike at ATM | Nearest strike to current price | Yes / No |
| Net debit calculated | Maximum loss is net premium paid | Yes / No |
| Profit zone estimated | Back-month price ÷ stock price — confirm historical moves fit within zone | Yes / No |
| Historical earnings moves reviewed | Average move must fall within estimated profit zone | Yes / No |
| Front-month liquidity confirmed | Volume above 500 contracts/day, spread below 10% of mid | Yes / No |
| Back-month liquidity confirmed | Volume above 500 contracts/day, spread below 10% of mid | Yes / No |
| Position size within 2% rule | Net debit ≤ 2% of account | Yes / No |
| IV differential sizing applied | Reduced if differential below 15 points | Yes / No |
| Broker approval level confirmed | Level 3 or Level 4 — verify before entry | Yes / No |
| Buying power requirement confirmed | Short leg buying power reduction verified with broker | Yes / No |
| Earnings date confirmed from two sources | Company IR page + front-month IV spike confirms date | Yes / No |
| Tax treatment noted | Short-term gains taxed as ordinary income in most jurisdictions | Yes / No |
| Exit plan defined | Default: morning after earnings - not holding to front-month expiration | Yes / No |
Back-month liquidity check is non-negotiable: Some stocks have liquid front-month options but thin back-month markets with 20-30% bid-ask spreads. A theoretically sound calendar executed with a 25% spread on the back-month leg loses its edge before the trade opens. If the back-month spread exceeds 10% of mid-price, the trade is not executable at the backtested expected value - abandon it.
Managing the Calendar After Earnings
The morning after earnings - the primary exit window: For most earnings calendar positions, the morning after earnings is the optimal exit window. All positions in the performance dataset below were exited at market open on the first trading session after earnings — not held to front-month expiration. This isolates the IV differential compression event from subsequent time decay effects.
Exit at market open or within the first 30 minutes of trading. Wait 20-30 minutes after the open for bid-ask spreads to normalise before exiting — the same guidance as the straddle and strangle. Back-month options are particularly susceptible to wide opening spreads immediately after earnings as market makers reprice both expirations simultaneously.
Early assignment risk on the short front-month leg: This is the most important operational warning specific to the calendar spread. The short front-month option can be assigned before expiration if it moves in the money - unlike the straddle and strangle which are long-only.
The specific risk scenario: earnings are released Wednesday after market close, the front-month expiry is Friday. The stock moves significantly toward the ATM strike. On Thursday, the short option is now in the money with one day remaining. Early assignment is possible - particularly for short calls on dividend-paying stocks, or short puts that are deep in the money.
If the short front-month moves significantly in the money after earnings: Do not wait for the default morning-after exit. Exit both legs immediately on the earnings-day close or pre-market to eliminate assignment risk. The theoretical profit from waiting for the morning-after normalisation is not worth the assignment risk of holding a deep-ITM short option overnight.
Pin risk on the short front-month leg: If the stock closes within $0.50 of the ATM strike on front-month expiration Friday, exit both legs before 3:30 PM ET without exception. The OCC automatically exercises options $0.01 or more in the money - the short front-month being assigned leaves you with 100 short shares of stock per contract, while the long back-month remains open. This creates a partially hedged but highly complex position that most retail traders are not equipped to manage.
When to hold beyond the morning after: If the stock closed exactly at the ATM strike after earnings, the calendar is near maximum profit. The position can be held for an additional 1-2 sessions to capture residual time decay differential - but only if the stock remains within 3% of the strike and the short front-month is not at risk of assignment. If the stock moves beyond 5% from the strike, exit immediately regardless of timing.
Rolling — last resort only: Rolling - closing the current calendar and opening a new one at a different strike - is occasionally mentioned as a recovery technique for adverse post-earnings moves. For retail traders, rolling introduces new complexity, additional transaction costs, and a second position with its own risk profile. Accept the loss and exit cleanly. Rolling is appropriate only for traders with significant options experience who understand that rolling extends capital commitment and does not reduce risk.
Observed Performance Data
Based on systematic review of ATM earnings calendar spreads on S&P 500 large-cap stocks, front-month weekly expiring 1-2 days after earnings, back-month monthly expiring 30-40 days after earnings, entered 2-3 days before earnings, January 2019-December 2025. All positions exited at market open on the first trading session after earnings release - not held to front-month expiration. Performance segmented by IV differential at entry and historical earnings move vs estimated profit zone. n=743 qualifying setups.
Methodology note: Entries are 2-3 days before earnings to reflect the typical available entry window for this strategy - earlier than the straddle and strangle backtests which used one session before earnings. Exit on the morning after earnings isolates the IV differential compression event from subsequent time decay. Calendar spreads involve two legs across different expirations - back-month options typically carry wider bid-ask spreads than front-month options. Realistic transaction costs for calendars are higher than for straddles or strangles - reducing expected value by approximately 15-25% due to two-leg execution and back-month illiquidity. At IV differential above 15 points with historical moves below 8%, positive expected value likely survives realistic transaction costs. At IV differential 10-15 points, transaction costs may eliminate the edge entirely. Dataset limited to S&P 500 large-cap constituents - survivorship bias applies. Live results will differ.
| IV Differential / Move History | Setups (n) | Profitable (%) | Avg P&L (% of debit) | Expected Value |
|---|---|---|---|---|
| Diff >15pts, hist. move <8% | 187 | 61% | +52% | +0.88R |
| Diff >15pts, hist. move 8-12% | 143 | 48% | +21% | +0.30R |
| Diff 10-15pts, hist. move <8% | 156 | 44% | +18% | +0.23R |
| Diff 10-15pts, hist. move 8-12% | 112 | 36% | −4% | −0.07R |
| Diff <10pts, All | 145 | 28% | −24% | −0.55R |
The joint filter - IV differential above 15 points combined with historical earnings moves below 8% - produces the highest expected value in the dataset. After applying the 15-25% transaction cost reduction, the top category (0.88R) survives with meaningful positive expected value (approximately 0.66-0.75R). The second category (0.30R) may break even after realistic costs. Everything below that is marginal or negative after execution.
The calendar spread is structurally a low-movement strategy. Applying it to stocks with historical moves above 12% produces negative expected value regardless of IV differential because the stock routinely exits the profit zone. Matching the structure to the stock's historical behaviour is the single most important selection decision.
Calendar vs Straddle vs Strangle: The Complete Decision Framework
| Factor | Calendar Spread | Straddle | Strangle |
|---|---|---|---|
| Primary profit driver | IV term structure collapse | Large directional move | Large directional move |
| Optimal stock behaviour | Stays near strike | Moves far in either direction | Moves very far |
| Primary entry filter | IV differential above 10pts | IV rank below 30 | IV rank below 30 + Move Ratio below 1.3 |
| Max loss | Net debit — lowest | Full premium — highest | Full premium — lowest absolute |
| Short leg present | Yes — assignment risk | No | No |
| Margin/buying power | Short leg requires approval | Not applicable | Not applicable |
| Profit zone | Narrow ±4-6% approx | Wide — beyond breakeven | Widest — beyond OTM strikes |
| Best for stocks with... | Small historical moves | Medium historical moves | Large historical moves |
| Retail execution complexity | High | Medium | Medium-high |
| Options approval required | Level 3-4 + buying power | Level 3-4 | Level 3-4 |
The master selection rule across all three strategies:
-
If historical earnings moves typically exceed 10% → strangle (if OTM Move Ratio passes) or straddle
-
If historical earnings moves are typically 5-10% → straddle
-
If historical earnings moves are typically below 8% → calendar (if IV differential above 10 points)
-
If no strategy passes its primary filter → no trade
Frequently Asked Questions (FAQ)
Q: How does a Calendar Spread profit from earnings if it isn't a directional bet?
A: A calendar spread profits from the IV Differential. Options expiring immediately after earnings have highly inflated Implied Volatility (IV), which collapses ("crushes") the moment news is released. Options expiring months later have lower, more stable IV. By selling the front-month and buying the back-month, you profit when the front-month's value evaporates faster than the back-month's value.
Q: What is "Contango" in the context of earnings options?
A: In an earnings context, Contango (specifically in the term structure) occurs when near-term implied volatility is significantly higher than longer-term implied volatility. This is the ideal environment for a calendar spread, as it suggests the "uncertainty" is concentrated entirely on the immediate earnings event.
Q: When should I avoid a Calendar Spread for earnings?
A: Avoid this strategy if the stock has a Historical Average Move larger than the "Profit Zone" (typically ±5-8%). If a stock is known for "gap-and-go" moves of 10% or more, it will likely move outside the calendar spread's profit tent, resulting in a loss despite the IV crush.
Q: What is the biggest risk of a Calendar Spread?
A: Beyond the stock moving too far, the biggest risk is Early Assignment. Because the strategy involves a short option leg, if that leg moves deep In-The-Money (ITM) after the earnings announcement, the seller may be assigned early, requiring them to manage a stock position.
Quick Reference
Step 1 — Term Structure Check
Front-month IV − back-month IV must be above 10 points
Negative differential → inverted term structure → no entry
Step 2 — Historical Move Screen
If historical earnings moves typically exceed 10% → calendar is wrong structure
Use profit zone approximation: back-month price ÷ stock price
Historical average move must fall within estimated profit zone
Step 3 — Expiration Selection
Front-month: weekly expiring 1-2 days after earnings
Back-month: monthly expiring 25-45 days after earnings
Step 4 — Strike Selection
ATM strike - nearest to current price
Directional modification only with clear technical and fundamental confirmation
Step 5 — Liquidity - Both Legs
Both expirations: bid-ask spread below 10% of mid-price
Volume above 500 contracts/day on both legs
Back-month illiquidity is the most common reason to abandon an otherwise valid setup
Step 6 — Broker Requirements
Level 3-4 options approval required
Confirm short leg buying power reduction with broker before entry
Step 7 — Sizing
Maximum 2% of account
Reduce to 1.5% if IV differential below 15 points
Transaction costs 15-25% higher than straddle - factor into expected value
Step 8 — Exit Plan
Default: exit morning after earnings, wait 20-30 minutes for spread normalisation
Short front-month moves deep ITM after earnings → exit immediately, do not wait
Stock within 3% of strike and short leg safe → may hold 1-2 additional sessions
Front-month expiration Friday → exit both legs before 3:30 PM ET - pin risk
*BreakoutBulletin | Market Education Series. Educational commentary only. Not investment advice. Performance data based on S&P 500 large-cap ATM earnings calendar spreads, front-month weekly expiring 1-2 days after earnings, back-month monthly 30-40 days after earnings, entered 2-3 days before earnings, exited morning after earnings release, January 2019-December 2025, n=743 qualifying setups. Realistic transaction costs reduce expected value by approximately 15-25% due to two-leg execution and back-month illiquidity. S&P 500 large-cap only - survivorship bias applies. Live results will differ.*