
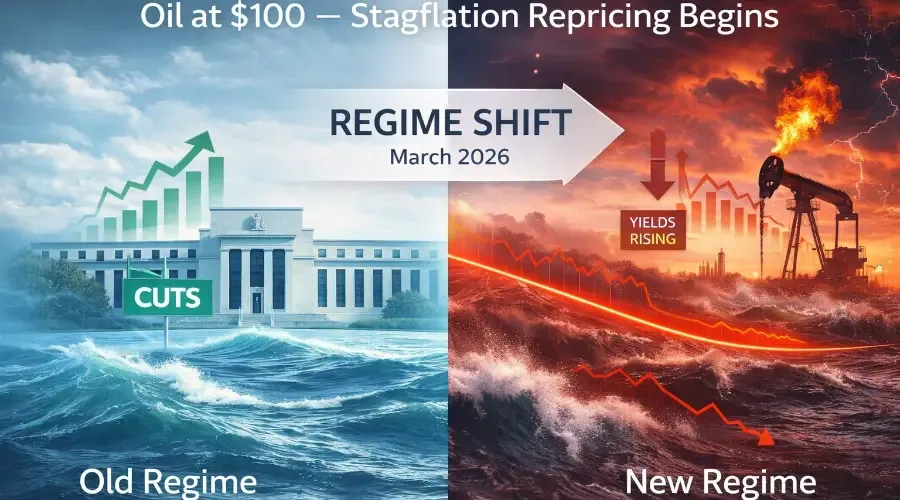
The defining feature of today's session: rising yields alongside falling stocks. That is the signal that inflation repricing now dominates growth fears.
BreakoutBulletin | Macro Intelligence
Published: March 9, 2026
Educational commentary only. Not investment advice.
The Hook
The dominant catalyst entering this week is not a single economic data release or central bank decision.
It is a macro regime question.
With oil crossing $100 per barrel for the first time since 2022, markets are now repricing inflation expectations, Federal Reserve policy flexibility, and equity risk premiums across global assets.
S&P 500 futures fell more than 1 percent, while Dow futures dropped roughly 450 points at the open—a clear risk-off signal.
The move reflects more than a routine pullback. It represents a structural repricing of risk as investors confront the possibility that the global economy is entering a stagflationary configuration.
Since the escalation of the Iran conflict approximately six weeks ago, roughly $6 trillion in global equity value has been erased. Energy stocks—represented by the Energy Select Sector ETF (XLE)—remain the primary beneficiaries of the oil surge.
For investors, the key task is not simply identifying what moved. It is understanding why the transmission mechanism this time is structurally different from a typical geopolitical volatility spike.
Oil Above $100 and the Hormuz Risk Premium
The breach of $100 WTI crude forms the structural anchor of the current market repricing.
The move reflects a concrete supply risk tied to the Strait of Hormuz, a maritime chokepoint through which roughly 20 percent of global oil supply flows. As tensions surrounding Iran escalate, markets are increasingly pricing the possibility of sustained supply disruption.
This is not being treated as a temporary spike.
Instead, markets appear to be pricing a sustained supply constraint, which introduces inflation risk at a moment when economic growth indicators were already weakening.
Historical context matters here. When oil last traded above $100 in 2022 following the Russia-Ukraine invasion, the S&P 500 fell approximately 20 percent peak-to-trough over the following six months. Inflation peaked at 9.1 percent, and the Fed delivered 425 basis points of rate hikes. Current conditions differ—growth was stronger then—but the precedent is worth noting.
The economic transmission channel operates through two simultaneous effects.
Higher energy prices raise inflation expectations directly. U.S. gasoline prices have already moved above $3 per gallon, up from $2.80 a month ago. Every $0.10 increase at the pump drains approximately $15 billion annually from consumer spending.
Monetary policy flexibility becomes constrained. The Federal Reserve is currently in its pre-meeting blackout period ahead of the March FOMC meeting, leaving markets without immediate policy guidance. This amplifies volatility—no official commentary means markets must interpret the data alone.
Prior to the oil shock, markets were pricing roughly one interest-rate cut for the full year. That expectation is now under pressure as the inflation outlook deteriorates.
Reports that the G7 is discussing coordinated Strategic Petroleum Reserve releases represent the primary near-term policy lever. Such actions could add 1 to 2 million barrels per day to supply temporarily, potentially shaving $5 to $10 off oil prices. But they do not eliminate the underlying supply risk driving the oil premium.
The Stagflation Transmission Chain
The oil shock is now propagating through multiple asset classes in a sequence consistent with stagflation pricing.
Catalyst:
Oil surges above $100 on supply disruption fears linked to Middle East escalation.
Immediate market reaction:
U.S. equity futures fall more than 1 percent, while the energy sector outperforms due to direct commodity exposure.
Cross-asset movement:
Treasury yields rise despite falling equities—the defining feature of the current environment. The 10-year yield rose to 4.17 percent, up approximately 10 basis points on the session. In a traditional risk-off event, yields fall as investors seek safety in bonds.
Rising yields alongside declining stocks indicates that inflation repricing is dominating growth fears.
Sector rotation:
Energy becomes the primary beneficiary, while traditional defensive sectors struggle to attract capital because rising yields reduce the valuation advantage of rate-sensitive sectors.
Structural implication:
Weak labor market data combined with rising energy costs creates the classic macro configuration of slowing growth with rising inflation pressures.
Historically, this environment has been one of the most challenging for both policymakers and diversified investment portfolios.
If yields continue rising while equities fall, the stagflation thesis strengthens. If yields reverse and equities stabilize, markets may treat this as a temporary oil spike. Today's action suggests the former.
Cross-Asset Confirmation
Market behavior across asset classes reinforces the stagflation interpretation.
Treasury yields:
The 10-year yield rose to 4.17 percent. The 2-year reached 3.60 percent. The 30-year approached 4.79 percent. Simultaneous declines in both bonds and equities suggest that neither asset class is providing a safe haven—a phenomenon known as correlation breakdown under stagflation.
U.S. dollar:
The dollar strengthened to approximately 105.5 on the DXY index, up 0.5 percent on the session, as investors moved into liquidity and safe cash equivalents. A stronger dollar adds pressure to emerging markets and multinational corporate earnings.
Gold:
Despite the geopolitical shock, gold has underperformed, trading near $2,880 per ounce, down modestly on the session. Rising real yields and dollar strength are suppressing its traditional safe-haven role.
Oil:
WTI briefly approached $110 intraday before stabilizing just above $100. The volatility reflects a market attempting to establish a new equilibrium.
Bitcoin:
Bitcoin moved higher during the session, gaining approximately 2 percent to near $69,000. This divergence suggests some investors may be treating digital assets as an alternative inflation hedge. One session does not make a trend, but sustained decoupling from equities would be worth watching.
Taken together, these signals confirm that inflation expectations—not recession fears—are dominating current market pricing.
Divergent Signals
Two developments offer partial divergence from the dominant narrative.
First, discussions among G7 nations about coordinated strategic petroleum reserve releases could provide temporary relief to oil markets. Strategic Petroleum Reserve releases can add 1 to 2 million barrels per day to supply temporarily. At current prices, this could shave $5 to $10 off oil prices. However, such measures address inventory levels rather than structural supply disruptions. Markets will watch for concrete announcements, not just discussions.
Second, Bitcoin's positive performance during an otherwise risk-off session suggests fragmentation in investor behavior. Some capital appears to be rotating into alternative inflation hedges rather than moving entirely into cash. If this continues, it would suggest that some investors are positioning for monetary debasement concerns alongside the stagflation trade.
Neither signal meaningfully challenges the dominant stagflation repricing narrative.
Structural Implications for Markets
Monday's session should be viewed as a repricing event rather than a positioning adjustment.
A positioning adjustment occurs when investors temporarily reduce risk and rebuild exposure once uncertainty fades.
A repricing event occurs when the assumptions underpinning asset valuations change.
The oil shock layered on top of labor market weakness may represent precisely such a shift.
Equity valuations had been built on the assumption that the Federal Reserve retained sufficient flexibility to cut rates in response to slowing growth. The S&P 500 forward P/E multiple expanded from 15x to 20x during the low-rate environment of 2020 to 2021.
An oil-driven inflation surge threatens that assumption.
If inflation remains elevated, the Fed may be forced to maintain restrictive policy even as economic growth slows. A sustained move to 4.5 percent yields could compress the market multiple back toward 16 to 17 times earnings, implying 10 to 15 percent downside even with unchanged earnings.
This recalibration affects the discount rate applied to corporate earnings, creating broad downward pressure on equity valuations.
Portfolio Implications
The stagflation configuration introduces challenges across portfolio styles.
Growth-oriented portfolios:
Rising yields compress valuation multiples and increase the cost of capital. Long-duration tech names are most exposed. Consider reducing exposure to the Technology Select Sector ETF (XLK) and the Semiconductor ETF (SMH). Adding energy exposure through the Energy Select Sector ETF (XLE) or the Oil and Gas Exploration ETF (XOP) provides a natural hedge.
Defensive portfolios:
Traditional defensive sectors often benefit from falling rates. In a rising-yield environment, that advantage diminishes. Utilities (XLU) and REITs (XLRE) face yield headwinds. Consumer staples (XLP) and healthcare (XLV) offer more rate-resilient defensive positioning.
Balanced portfolios:
The simultaneous decline of stocks and bonds weakens traditional diversification benefits. The 60/40 portfolio is under pressure. Consider adding commodities through the Invesco Commodity ETF (GSG) or the Invesco Commodity Index ETF (DBC). Short-term Treasuries (SHV) offer stability with positive real yields.
For all investors:
Cash is no longer trash when yields are 4 percent. Short-term money market funds and Treasury bills offer positive real returns for the first time in years. This provides a genuine alternative to risk assets while the macro picture clarifies.
Earnings Impact Timeline
Higher energy costs do not hit corporate earnings immediately.
For most companies, higher energy costs flow through to earnings with a one to two quarter lag. Q1 earnings reports in April may not fully reflect the oil shock.
Q2 guidance updates will be the first place investors see management teams quantify the impact. Watch for companies citing "fuel surcharges," "transportation costs," and "input price pressures" in their earnings calls.
Airlines, trucking, and logistics companies will feel the impact first. Consumer discretionary names will follow as higher gasoline prices divert spending.
Regional Exposure Differences
Not all markets are equally exposed to oil shocks.
Europe and Asia, as net energy importers, face greater economic pressure than the United States. The STOXX 600 fell 2.3 percent, more than double the S&P 500's decline, reflecting this structural vulnerability.
Emerging markets that are net oil importers-India, Turkey, much of Southeast Asia-face additional pressure from both higher oil prices and a stronger dollar.
For U.S. investors with international exposure, this regional differentiation matters. Multinational companies with significant European or Asian revenue streams may face currency headwinds on top of energy cost pressures.
The Fed Blackout Period
The Federal Reserve is currently in its pre-meeting blackout period ahead of the March FOMC meeting on March 19 and 20.
This means no official commentary until after the meeting. Markets must interpret the data without policy guidance, which can amplify volatility.
The next signal comes with the dot plot release on March 20. Investors will watch closely whether Fed officials have revised their rate expectations upward in response to the oil shock.
Until then, markets are flying blind—another factor contributing to today's sharp repricing.
The Bigger Picture
Monday's market behavior does not introduce a new macro narrative.
It accelerates a tension that has been building since the Iran conflict began.
Markets previously assumed that the Federal Reserve could navigate slowing growth with measured rate cuts. That assumption required inflation to remain contained.
Oil above $100 challenges that assumption.
The result is a macro environment where policy flexibility becomes constrained just as economic momentum weakens.
Whether this tension resolves through diplomatic de-escalation, supply normalization, or policy adaptation remains uncertain.
What markets are doing today is acknowledging that the path forward is less clear than it was a week ago—and pricing risk accordingly.
Trader Takeaways
For investors navigating this environment, several conclusions emerge.
First, recognize the signal. Rising yields plus falling stocks equals inflation fears dominating growth fears. This is stagflation pricing.
Second, position for persistence. Markets are treating this as a sustained supply shock, not a temporary spike. Energy and commodities are the primary beneficiaries.
Third, reevaluate traditional defensives. Utilities and REITs face yield headwinds. Staples and healthcare offer better defense.
Fourth, watch the catalysts. G7 SPR announcements, Iran diplomatic developments, and the March 20 Fed dot plot will determine whether this repricing accelerates or reverses.
Fifth, let price confirm. If yields continue rising and equities fall, the stagflation thesis strengthens. If yields reverse, markets may treat this as a buying opportunity.
The Bottom Line
The defining feature of today's session is not the magnitude of the decline.
It is the configuration.
Rising yields alongside falling stocks indicates that inflation repricing is now dominating growth fears. That is the signal that separates this episode from a typical risk-off event.
The oil shock layered on top of weakening growth creates the classic stagflation setup.
Policy flexibility is constrained. Valuation assumptions are being challenged. Traditional diversification is under pressure.
What markets are doing today is not overreacting. They are repricing risk to reflect a less certain, more inflationary future.
The path forward depends on oil, diplomacy, and the Fed's response.
Until those variables resolve, the stagflation trade remains in control.
Disclaimer
This analysis is published by BreakoutBulletin for educational and informational purposes only. It does not constitute financial advice, investment recommendations, or a solicitation to buy or sell any security or financial instrument.
All price levels, scenarios, and interpretations are based on publicly available data as of the publication date and may not reflect current market conditions. Futures trading and equity investing involve substantial risk of loss. Past performance is not indicative of future results.
Readers should conduct their own independent research and consult with a qualified financial advisor before making any investment decisions. BreakoutBulletin is an educational content platform and is not a registered investment advisor, broker-dealer, or financial institution.
© 2026 BreakoutBulletin | breakoutbulletin.com | All rights reserved.