
S&P 500 Falls as Treasury Yields Drop After Jobs Miss
BreakoutBulletin | Flow Tape Column | Friday, March 7, 2026 |
*Educational commentary only. Not investment advice. All flow data and price references sourced from CNBC, WSJ live blog, Schwab market commentary, and publicly available index coverage as of March 7, 2026. Sector-level ETF flow dollar figures were not available in verified research for this session—where data is absent, that absence is stated explicitly.*
Here's how Friday morning looked if you were watching the tape.
By 8:30 AM ET, markets had already spent a week absorbing geopolitical oil shocks. Then the February jobs report landed—and added a second concern to the mix.
Nonfarm payrolls came in at -92,000, against consensus expectations for a modest gain around 50,000 to 60,000. The unemployment rate ticked up to 4.4% from 4.3%. Wages, meanwhile, kept climbing—average hourly earnings rose about 0.4% month-over-month, a tick above what forecasters had expected. And oil was still hovering near $90 on Iran headlines.
The number itself was striking enough. But the real story was what happened next.
What Moved the Tape
The payroll figure wasn't just a miss relative to expectations. It represented a directional reversal against a market that had largely positioned itself for continued labor resilience. You could see that in how yields reacted.
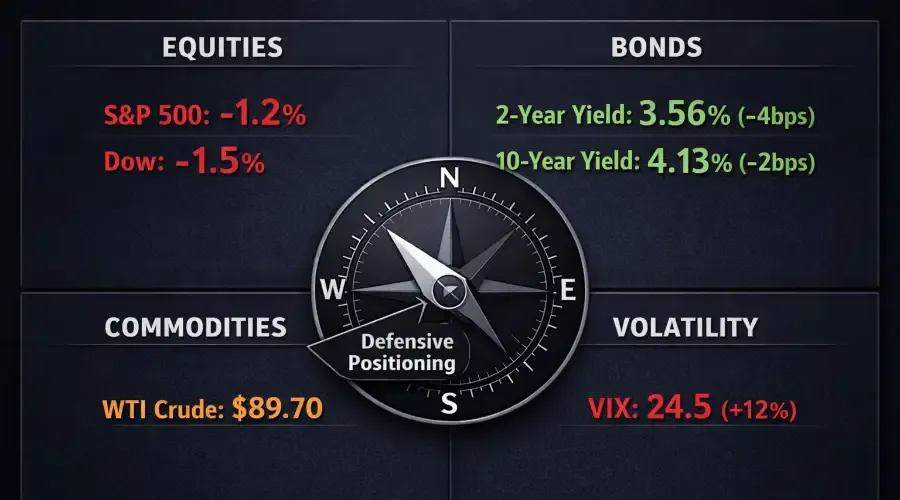
The 2-year Treasury yield—the maturity most sensitive to near-term Fed expectations—fell roughly 4 basis points to about 3.56%. The 10-year yield eased around 2 basis points, settling near the 4.12%-4.14% range. Because the 2-year moved more than the 10-year, the curve steepened modestly. That's the kind of pattern you tend to see when markets start pulling forward expectations for rate cuts.
Equities, though, didn't get the memo. At least not in a positive way.
The Dow Jones Industrial Average declined roughly 1.5%. The S&P 500 and Nasdaq Composite each fell more than 1%. The employment data arrived at the same time crude remained elevated due to the Iran conflict narrative. So you had headlines about oil hitting $90 running alongside headlines about the U.S. losing 92,000 jobs.
It's worth noting these two catalysts landed at the exact same time. Untangling their precise contribution to each sector's move? Not really possible with what we can see.
Where the Money Is Moving
From a positioning standpoint, the dominant capital pattern during this 12-hour window looks like broad equity de-risking paired with moderate Treasury demand.
When the Dow, S&P 500, and Nasdaq all decline by more than 1% in the same session, that's usually index-level risk reduction, not capital rotating between sectors. The fact that the declines were similar in magnitude across all three supports that reading.
Treasury markets show the defensive counterpart. The 2-year yield falling about 4 basis points and the 10-year easing about 2 basis points suggests investors added some duration exposure as equities weakened. Because the front end moved more than the long end, the shift seems concentrated around rate-cut repricing rather than a full-blown flight-to-safety trade.
What I couldn't see in the data is also worth mentioning. Sector-level ETF flows for financials, tech, energy, utilities, healthcare, and industrials? Not available in any of the verified research for this window. So if you're hoping for a precise breakdown of where capital rotated sector by sector, I can't give you that.
But zoom out far enough and a pattern still emerges.
Equities were broadly lower. Treasury yields dropped. Oil stayed elevated. Volatility climbed. That specific combination of signals—stocks down, bonds up (well, yields down which means prices up), commodities firm, VIX higher—has a name. It's what defensiveness looks like.
You don't need sector flow data to see that. The cross-asset evidence tells the same story, just at a higher altitude.
Tactical Framework Traders May Monitor
One conditional framework centers on the 2-year Treasury yield.
If it stays near the 3.50%-3.60% range into next week, that would suggest the market continues pricing earlier Fed easing. In that environment, traders might start watching whether rate-sensitive sectors—utilities, REITs, long-duration tech names—begin attracting relative inflows.
Confirmation of broader de-risking could show up if SPY closes the week below the previous session's range low near 680-682, especially on higher-than-average volume. That kind of move would suggest institutional participation rather than just a short-term reaction to the 8:30 AM data. Final volume and closing data weren't fully recorded in the research window at writing, so treat that level as a reference area, not a validated threshold.
There's also the geopolitical wild card. If the Iran-related oil narrative shifts—say, a diplomatic signal that reduces the energy risk premium—the combined catalyst behind today's de-risking could partially unwind. In that scenario, equity losses tied to the dual narrative of labor weakness and energy pressure might see some stabilization.
All frameworks here are conditional. No probabilities assigned.
Structural Context
The current flow pattern feels like a tactical response to a macro surprise layered on top of an existing structural stress environment.
That distinction actually matters. Structural reallocations usually involve multi-session ETF outflows, sustained Treasury inflows, and portfolio adjustments measured across weeks, not hours. What we're seeing in this session is a single-day reaction to new information. Not a confirmed regime shift.
Before the payroll report, markets were already trading within a geopolitical energy framework. Oil near $90 per barrel has supported energy sector revenues even as broader equity indices weakened. That divergence—energy strength alongside index declines—represented positioning that existed before the labor data landed.
What changed Friday was the addition of a second concern. The payroll data introduces the possibility that labor market softening could start affecting forward consumption and earnings expectations. If that interpretation gains traction, the valuation multiple applied to the broader market may adjust independently of whatever the Fed does.
The key question heading into next week: Do markets treat these pressures—geopolitical oil risk and labor deterioration—as separate concerns, or as a combined stagflationary signal?
Technical Reference
SPY: Intraday commentary places the prior closing range near 680-682. The exact closing level for the current session wasn't fully captured within the research window.
QQQ: The last confirmed close prior to the jobs release was March 5 at 605.11, down 0.92% on that session. Updated closing data for Friday wasn't available in the historical table during our window.
VIX: Separate session research referenced the volatility index near 24.5 following roughly a 12% intraday increase after the payroll release. That level suggests elevated hedging demand—not a panic-driven spike.
Consider these reference areas only. They weren't independently validated through chart analysis during the research window.
What Friday's tape shows is a market grappling with two narratives at once: geopolitical oil risk on one side, a softening labor market on the other.
Which story dominates next week depends on whether investors see them as separate concerns—or a combined stagflationary signal. The 2-year yield says rate cuts are coming. The VIX says hedge. And the equity indices, all down more than 1%, say risk-off.
For now, the tape says "defensive." That's worth watching.
*Published: March 7, 2026 | BreakoutBulletin Flow Tape Column | Educational commentary only. Not investment advice. Sector ETF flow dollar figures were not available in verified research for this session and are explicitly noted as absent. All other figures sourced from CNBC, WSJ live blog, and Schwab market commentary. Past capital flow patterns are not indicative of future positioning outcomes.