
Updated: April 13, 2026 | Reading Time: 15 min | Level: Intermediate / Advanced
The Market Is Not Random. It Is Structured.
The S&P 500 forecast for 2026 has become one of the most debated questions on trading desks and retail forums alike. Since the early 2025 peak near 6,100, the index has declined sharply, bounced, stalled, and left most participants unsure whether the SPX outlook is bullish recovery or deeper correction. If you have been asking whether the stock market is going up or down right now - this analysis gives you a structural answer, not a guess.
The problem is not a lack of information. It is a lack of structure. Elliott Wave analysis provides that structure. Not as a prediction tool - but as a framework for identifying where the market sits within its natural cycle, and what that position implies for positioning, risk, and timing.
This is not a random selloff. It is the corrective phase that always follows a completed impulse.
When applied to the current S&P 500 Elliott Wave structure, the message is specific: the market has completed a five-wave motive advance and is now working through a corrective sequence that is not yet finished. This article breaks that down in full - the index structure, sector rotation, individual wave counts for Apple, Microsoft, and Nvidia, and a concrete decision framework for what traders should actually do right now.
If you are building your Elliott Wave foundation alongside this analysis, start with the complete Elliott Wave trading guide before going further.
Current S&P 500 Structure: A Completed Impulse and an Active Correction
The Five-Wave Advance: 2022 to 2025
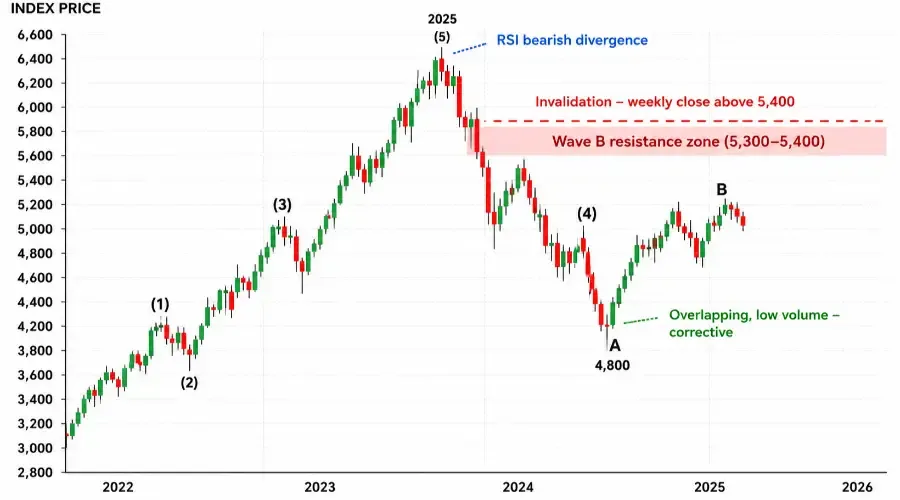
From the October 2022 lows near 3,500 to the early 2025 peak near 6,100, the S&P 500 traced a textbook five-wave motive sequence. Understanding each wave is not just historical context - it is the foundation for reading what comes next.
Wave 1 (Oct 2022 – Feb 2023) was the initial recovery from the bear market low, driven by early accumulation. Breadth was modest and scepticism remained high - exactly the conditions that define a Wave 1.
Wave 2 (Feb 2023 – Mar 2023) was the sharp retest of conviction. It retraced approximately 50–61.8% of Wave 1, briefly revived fear, and shook out weak hands — exactly as Wave 2 is supposed to behave.
Wave 3 (Mar 2023 – Jul 2024) was the dominant expansion leg - the longest, strongest move in the sequence. It broke above prior highs with force, extended to roughly 2.618x Wave 1, and generated broad participation. To understand how to identify and trade this phase, refer to the Wave 3 strategy and target framework.
Wave 4 (Jul 2024 – Nov 2024) was the controlled consolidation phase - choppy, overlapping, and range-bound. Crucially, it held above prior Wave 1 territory, keeping the first Elliott Wave rule intact.
Wave 5 (Nov 2024 – Feb 2025) was the final advance to 6,100. The RSI showed bearish divergence at the peak - momentum made a lower high while price made a higher high. That is the single most reliable Wave 5 exhaustion signal, and it appeared precisely at the top.
A completed five-wave sequence is not bullish continuation. It is the setup for correction.
Wave A Decline: 6,100 to 4,800
The decline from the 2025 highs carries the defining characteristics of a Wave A move within a larger (A)-(B)-(C) corrective sequence. The internal structure showed five impulsive sub-waves to the downside. Selling was broad-based with no sector acting as a safe haven. The macro catalysts - tariff announcements and earnings downgrades - acted as the trigger, not the underlying cause. Momentum reached deeply oversold levels consistent with Wave A termination, not a mid-cycle correction.
The low near 4,800 is the probable Wave A endpoint. To understand how to project Wave C targets from here, the full breakdown is in the corrective wave patterns guide.
Where We Are Now: A Wave- B Rally
The current recovery from the 4,800 low is a Wave B rally. This is the single most important structural call in this market right now. A five-wave recovery from 4,800 would signal a new motive advance. What the current structure is showing instead is three-wave subdivisions, overlapping price action, and declining momentum on each successive swing high. That is corrective behaviour, not impulsive expansion. This type of structure often leads to complex corrections like WXY patterns - understand it in the X-Wave trap strategy.
What is Wave B?
- Counter-trend rally — a move against the dominant corrective direction, not a new trend
- Weak internal momentum — overlapping price action, declining volume, inconsistent breadth
- High failure probability — typically reverses within the 38.2-61.8% retracement zone before Wave C resumes
Key structural levels defining the current environment:
- 5,300 - 5,400 - Primary Wave B target zone (0.618 retracement of Wave A) and the level that must be sustained on a weekly close to invalidate the corrective thesis. Weekly close = Friday's 4:00 PM ET closing price on the S&P 500.
- 5,050 - Early warning level. A daily close below 5,050 signals Wave B may have ended and Wave C is beginning.
- 4,500 - 4,650 - Primary Wave C target, representing the 0.618–0.786 retracement of the full 2022–2025 advance - these Fibonacci relationships are derived from standard Elliott Wave target frameworks
The dominant scenario: the S&P 500 completes Wave B in the 5,300–5,400 zone, reverses, and begins Wave C toward 4,500–4,650. That scenario remains active until the index reclaims 5,400 on a weekly close with expanding volume and breadth. To understand the three inviolable rules that govern whether this wave count stays valid, review the Elliott Wave rules and guidelines.
S&P 500 MARKET DECISION FRAMEWORK
▲ ABOVE 5,400 (weekly close): Bull resumption. Corrective thesis invalidated. Strategy shifts to Wave 2 pullback accumulation for Wave 3 positioning.
→ 5,050–5,400 (current zone): Wave B trap zone. Counter-trend rally in progress. Reduce longs, avoid chasing breakouts, watch for divergence at resistance.
▼ BELOW 5,050 (daily close): Wave C in progress. Target 4,500–4,650. Capital preservation mode. No broad index longs.
Sector Rotation: What Capital Flow Is Telling Us
Sector behaviour is not separate from wave analysis - it validates or challenges it. Right now, the rotation picture confirms the corrective interpretation on the index.
Technology (XLK) led the prior motive advance and is now showing relative weakness against the broader index. Sector leaders in Wave 3 expansions typically become the primary source of selling pressure in Wave A corrections as institutional players unwind overweight positions. XLK's decline was sharper and faster than the S&P 500 - a distribution signature, not mere rotation.
Healthcare and Consumer Staples are stabilising and outperforming on a relative basis. Capital does not flow into defensive sectors at the start of a new bull trend. It flows there when institutional participants are reducing risk and waiting for the corrective structure to exhaust before redeploying.
Energy and Financials showed relative resilience in the initial decline but have not broken to new highs — which they would be expected to do if a genuine new motive advance were underway.
Defensive outperformance is not a bullish signal. It is an institutional risk-off signal.
Until technology leadership returns with conviction - meaning XLK reclaims $200 on a weekly close with volume confirmation - the broader index structure remains corrective.
Apple (AAPL) Elliott Wave Analysis
Current Wave Position
Apple completed a five-wave motive advance from the 2022 lows, with Wave 5 terminating near $235–$240 in early 2025. The RSI showed clear bearish divergence at that peak - a reliable Wave 5 exhaustion signal that appeared weeks before the price turned.
The decline from $235–$240 shows a five-wave internal structure, characteristic of a Wave (A) move. AAPL is now testing the $170–$175 zone - both the 0.618 Fibonacci retracement of the full 2022–2025 advance and the prior Wave 4 support territory. These levels coinciding is not a coincidence. It is a structural cluster.
Fibonacci Zones to Watch
The 0.382 retracement at $195–$200 is the first supply zone on any Wave B bounce - where sellers are likely to re-emerge.
The 0.500 retracement at $185–$190 is the maximum shallow Wave B target if the bounce lacks momentum.
The 0.618 retracement at $170–$175 is the current test zone and the primary Wave A/C support target - the most critical level on the AAPL chart right now.
The 0.786 retracement at $155–$158 is the extended Wave C target if the corrective structure deepens beyond the primary scenario.
Momentum and Divergence Signals
Weekly RSI is approaching the 30–35 range. At this level, bullish divergence would be the first signal that Wave (A) is nearing completion. As of the most recent weekly close, that divergence has not yet confirmed - RSI is declining alongside price, not leading it.
Price at a Fibonacci level is a watch signal. Price at a Fibonacci level with RSI divergence is an entry signal.
The divergence strategy framework explains exactly how to sequence this confirmation before acting on a support zone.
What Traders Should Watch
Scenario A: AAPL holds $170–$175 and RSI turns up from below 35 on a weekly close → Wave (A) likely complete. Wave (B) rally targeting $195–$200 is the high-probability path. Tradeable counter-trend move - not a new trend.
Scenario B: AAPL breaks below $170 on a weekly close → Wave C extension toward $155–$158 becomes the primary target. Do not add long exposure below this level without fresh divergence confirmation.
Microsoft (MSFT) Elliott Wave Analysis
Current Wave Position
Microsoft's wave structure from the 2022 lows is the cleanest setup among the three mega-caps. Wave 3 ran from approximately $220 to $420 - a 1.618 Fibonacci extension of Wave 1, textbook proportionality. Wave 4 corrected into the $370–$380 zone and held. Wave 5 extended to approximately $465–$470 before reversing.
The decline from $465–$470 has the structure of a five-wave Wave (A) move. MSFT is now positioned in the 50–61.8% retracement zone between approximately $340 and $360. This zone also overlaps with prior Wave 4 support - one of the most reliable corrective support clusters in Elliott Wave analysis.
Fibonacci Zones to Watch
0.382 retracement at $385–$395 — Wave B resistance zone, the first supply level on a counter-trend rally.
0.500 retracement at $365–$375 — Primary Wave B target and structural midpoint.
0.618 retracement at $340–$350 — High-probability Wave A low - this is where MSFT is being tested right now.
Prior Wave 4 low at $370–$380 — Structural overlap support and a key reference for the wave count's validity.
Momentum and Divergence Signals
MSFT's weekly MACD showed negative divergence throughout the Wave 5 advance - the histogram was declining as price made new highs, a momentum exhaustion pattern that preceded the reversal by several weeks. At the current $340–$360 test zone, the MACD histogram is deeply negative but beginning to show early signs of flattening - a prerequisite for a bullish signal, not the signal itself.
Confirmation requires the histogram to begin curling upward while price holds above $340 for at least two consecutive weekly closes.
What Traders Should Watch
Scenario A: Weekly close above $340 sustained for two weeks, with RSI turning up from below 40 → Wave B rally toward $385–$395 is the high-probability path.
Scenario B: Break below $340 on a weekly close → Wave C extension toward $310–$320 becomes active, aligning with the 0.786 retracement.
MSFT offers the most structurally well-defined risk parameters of the three mega-caps right now.
Nvidia (NVDA) Elliott Wave Analysis
Current Wave Position
Nvidia's structure is more complex than AAPL or MSFT because of the extraordinary extension of Wave 3 during the AI-driven advance. From the 2022 low near $108 (post-split adjusted), Wave 3 extended to approximately $140 - a 2.618 Fibonacci multiple of Wave 1, one of the most extended Wave 3 structures in recent mega-cap history.
Extended Wave 3s produce complex corrections. That is precisely what NVDA is delivering. The current structure carries a genuine ambiguity: NVDA may be in a Wave 4 of the prior impulse (allowing one final Wave 5 attempt) or in an (A)-(B)-(C) corrective decline at the intermediate degree. These often evolve into multi-leg structures like WXY - a detailed breakdown is covered in the X-Wave trap strategy. The $80–$95 zone is the structural key that resolves this ambiguity.
Fibonacci Zones to Watch
0.382 retracement at $105–$110 — Shallow Wave 4 target and current resistance zone on any bounce.
0.500 retracement at $90–$95 — Primary support zone and highest-probability area for a corrective low to form.
0.618 retracement at $75–$80 — Maximum Wave 4 depth. $80 is the upper bound of this support zone; a weekly close below $75 invalidates the entire bull count and signals a deeper corrective structure is in progress.
Prior Wave 1 high at $85–$90 — Structural reference. A sustained close below $85 increases the probability of the bearish interpretation.
Momentum and Divergence Signals
At the most recent swing lows, NVDA's weekly RSI has not formed bullish divergence — it has declined in line with price without any positive divergence pattern emerging. This is a meaningful caution flag: the low is likely not yet in place.
Volume patterns during the decline show sustained distribution rather than the exhaustion-type selling that marks corrective lows. Both signals point to elevated risk ahead of structural confirmation.
In extended wave structures, patience matters more than precision. Wait for confirmation.
What Traders Should Watch
Scenario A: Weekly close above $105 with volume expansion → First structural signal that a corrective low may be forming. Monitor RSI for divergence developing over the following 2–3 weeks before adding exposure.
Scenario B: Price holds $80–$95 with bullish RSI divergence confirmed on the weekly chart → Wave B rally toward $115–$120 becomes the primary target.
Scenario C: Break below $75 on a weekly close → The bear count at the intermediate degree takes precedence. No long exposure.
The Wave 3 entry strategy framework explains exactly why partial confirmation is insufficient for a stock with NVDA's volatility profile - and what full confirmation actually requires.
What Should Traders Do Now?
Scenario 1: Wave B Continues Toward 5,300–5,400 (Primary Scenario)
If the S&P 500 grinds toward the 5,300–5,400 resistance zone over the next 2-4 weeks without a decisive breakout, the playbook is clear.
Do not add broad index long exposure. A Wave B rally into resistance is not a trend - it is a counter-trend move designed to attract late buyers before reversing. This is precisely what makes Wave B environments dangerous. For a deep dive on why Wave B rallies are structurally deceptive and how to avoid being trapped, see the B-Wave trap and false breakout guide.
- Focus on individual names at Fibonacci support - MSFT $340–$360 and AAPL $170–$175 where setups have structurally defined risk.
- Define your exit before your entry. A weekly close below MSFT $340 or AAPL $170 is your stop. Know it before you act.
- Watch for bearish RSI divergence at 5,300–5,400 on the S&P 500 - that divergence signal is the early warning that Wave B is exhausting.
Scenario 2: Wave C Begins Earlier Than Expected
If the S&P 500 rolls over from below 5,300 and breaks below 5,050 on a daily close, Wave C toward 4,500-4,650 is the primary target.
- Reduce equity exposure. Defensive sectors - Healthcare and Consumer Staples - outperform in this environment.
- Do not add long exposure to AAPL, MSFT, or NVDA until each reaches its respective 0.618-0.786 Fibonacci zone with divergence confirmation.
- Cash is a valid position. Preserving capital through a Wave C to buy at structurally confirmed lows is better execution than being early and absorbing the full drawdown.
Scenario 3: Invalidation - S&P 500 Reclaims 5,400 with Conviction
If the S&P 500 delivers a weekly close above 5,400 with expanding volume and breadth, the corrective interpretation is invalidated. The structure shifts toward a new motive advance - likely Wave 1 of a fresh five-wave sequence.
- Do not chase the breakout. Wait for the first Wave 2 pullback (38.2–50% retracement of Wave 1). That pullback is the entry.
- This scenario requires a full reassessment of all positions. The strategy that worked in the correction does not automatically work in the new trend.
Three Rules That Apply in Every Scenario
- Confirmation before size. The current environment punishes early entries. Wait for the weekly close that confirms the structure.
- Fibonacci levels define risk, not just targets. Every trade needs a Fibonacci-based stop level. The levels in this article are the invalidation points for each scenario.
- Divergence is the entry trigger. Price at a Fibonacci level is a watch signal. Price at a Fibonacci level with RSI or MACD divergence is an entry signal.
Q&A: The Questions Traders Are Asking Right Now
What does a Wave B market mean for my existing positions?
A Wave B environment rewards defensive positioning, not aggressive expansion. If you are holding long positions entered during the Wave 3 phase at lower prices, this is a zone to trim - not to add. If you entered during the Wave A decline thinking a bottom was in, the structure suggests you are holding into a counter-trend rally. The risk-reward for adding here is unfavourable.
How do I know if this is really Wave B and not a new bull market?
The answer is in the internal structure, not the price level. A genuine new bull market from 4,800 would show five-wave impulsive sub-structure on the 4-hour and daily charts - clean, non-overlapping waves with expanding breadth and volume. The current structure shows overlapping price action, inconsistent momentum, and selective participation. That is the corrective fingerprint. If you're unsure how to validate this structurally, revisit the Elliott Wave rules and guidelines.
If Wave C comes, where is the real buying opportunity?
The 4,500–4,650 zone on the S&P 500 represents the primary Wave C target - the 0.618 - 0.786 retracement of the full 2022–2025 advance. These Fibonacci zones are not random - they are derived from standard wave relationships explained in the Fibonacci targets framework. Corrective lows at this Fibonacci depth historically represent the highest-quality re-entry zones.The setup at that level - divergence, volume exhaustion, and five completed sub-waves - is the signal. Not the price zone alone.
Should I be shorting this market?
For most intermediate traders, the answer is no - at least not directly. Wave B moves can extend further and last longer than expected, making timing critical. A more practical approach is reducing long exposure and holding cash rather than actively shorting.
What happens to tech stocks if Wave C reaches 4,500–4,650?
Tech leadership stocks would likely experience proportional or greater declines given their corrective structures. AAPL's Wave C target of $155–$158, MSFT's $310–$320, and NVDA's bear count below $75 are all consistent with an S&P 500 correction of that magnitude.
How long does a Wave B typically last?
Wave B duration varies. In typical (A)-(B)-(C) zigzag corrections, Wave B retraces 38.2–61.8% of Wave A in both price and time. The current structure suggests the bounce is limited in both price and time (weeks, not months).
Conclusion
The S&P 500 Elliott Wave structure is not ambiguous at the macro level. A completed five-wave advance from 2022 to 2025 has transitioned into an (A)-(B)-(C) corrective sequence. Wave A is complete near 4,800. The current recovery is a Wave B counter-trend rally, likely targeting 5,300–5,400 before Wave C resumes toward 4,500–4,650.
Apple is testing the 0.618 retracement at $170–$175. Microsoft is at the 50–61.8% retracement zone with the cleanest setup of the three. Nvidia carries the most complexity and requires the most confirmation before any long-side exposure is appropriate.
The traders who navigate this correctly are not the ones who call the bottom earliest. They are the ones who wait for structure to confirm.
The 5,050–5,400 zone is where the next directional decision is being made. Watch it with discipline.
Next Step in the Framework
If this analysis raised questions about the underlying wave mechanics, the complete system is in one place. The Complete Elliott Wave Trading Guide covers every component referenced above — motive and corrective wave structure, Fibonacci retracement and extension targets, the three cardinal Elliott Wave rules, momentum divergence entry signals, and the Wave 3 entry strategy - in a sequenced, practical format built for intermediate traders.
Use this analysis page as your live market reference. Use the complete guide as your structural foundation. Together, they form a working S&P 500 Elliott Wave analysis framework you can return to every week.
The analysis presented here is observational and educational in nature. It reflects the application of Elliott Wave and technical analysis frameworks to publicly available price data. This content does not constitute investment advice or a recommendation to buy or sell any security. All trading involves risk. Past wave patterns do not guarantee future outcomes. Readers should conduct their own research and consult a registered financial advisor before making investment decisions.