
JPMorgan warns of a 10% pullback. Yardeni raises meltdown odds to 35%. Here is what these institutional signals actually mean—and what they don't.
BreakoutBulletin | Macro Intelligence
Published: March 9, 2026
Educational commentary only. Not investment advice.
The Hook
When oil moves above $100 per barrel and equity futures fall more than 1 percent, the dominant market story is written through price action and cross-asset flows.
But another signal often follows within hours: how major institutional voices recalibrate their downside scenarios in response.
That secondary reassessment emerged on March 9, 2026. JPMorgan warned that the S&P 500 could face a 10 percent correction if war risks continue to intensify. At nearly the same moment, Yardeni Research raised its market meltdown probability to 35 percent from 20 percent.
These are not trading signals. They are structured probability frameworks from two widely followed institutional voices.
Understanding what they mean-and what they do not mean-is the purpose of this analysis.
In practical terms, the institutional risk conversation has shifted from routine volatility to evaluating whether the oil shock and geopolitical escalation could alter the macro environment for equities.
Signal 1 - JPMorgan Warns of a 10% S&P 500 Correction
What Was Said
JPMorgan warned that the S&P 500 could experience a 10 percent correction as war risks tied to Iran escalate. The call appeared in Bloomberg coverage on March 9, coinciding with oil's break above $100 and a broad equity decline.
The bank cited unprepared trader positioning as a key vulnerability if the oil surge proves persistent.
What a 10% Correction Means Structurally
A 10 percent correction represents a recalibration rather than a crisis.
The S&P 500 closed Friday near 5,750. A 10 percent decline would target approximately 5,175. That range is important because it would likely intersect with the 200-day moving average, a level closely monitored by systematic strategies.
If breached, that level could trigger additional de-risking from trend-following funds, volatility-targeting portfolios, and momentum strategies.
Historically, corrections of 10 to 15 percent occur roughly once per year in the S&P 500. Since 1950, the index has experienced a 10 percent or greater correction approximately once every 1.5 years on average. The frequency is normal.
What makes the call notable is the mechanism JPMorgan highlights: oil shock combined with unprepared positioning during a geopolitical escalation. This would be the first correction driven by a stagflationary oil shock since the 1970s.
What "Unprepared Positioning" Means
Unprepared positioning typically includes low put protection, high equity exposure, and crowded momentum trades. When these unwind, selling can accelerate regardless of fundamentals.
Options market data shows put-call ratios near multi-month lows entering this week, suggesting traders were not hedged for a sharp downside move. That vulnerability amplifies the risk of a cascading selloff if institutional selling picks up.
What Retail Traders Should Understand
JPMorgan's call represents scenario analysis, not a forecast.
Large banks continuously publish downside scenarios that may or may not materialize. The educational value lies in understanding which technical levels become structurally important if selling pressure continues.
In practical terms, when a major bank publicly raises a downside scenario, it often reflects risk discussions already occurring inside institutional portfolios. The published research is typically a trailing reflection of those discussions, not the moment they begin.
Signal 2 - Yardeni Raises Meltdown Probability to 35%
What Was Said
Ed Yardeni of Yardeni Research raised his market meltdown probability to 35 percent from 20 percent on March 9. The change was attributed primarily to escalating Iran conflict risks combined with rising oil prices.
Yardeni also noted that slower economic growth paired with rising energy costs could constrain Federal Reserve flexibility, producing a stagflation-adjacent environment.
What "Meltdown" Means in Yardeni's Framework
In Yardeni's framework, a meltdown typically refers to a decline exceeding 20 percent accompanied by credit market stress and liquidity deterioration. This is a scenario distinct from a routine correction.
A meltdown would involve forced selling, margin calls, and a breakdown in market functioning-conditions last seen during the 2008 financial crisis and the 2020 COVID crash.
Why Yardeni's Probability Framework Matters
Ed Yardeni is one of Wall Street's longest-serving strategists. His research often relies on structured probability frameworks rather than directional forecasts.
A shift from 20 percent to 35 percent meltdown odds represents a meaningful reassessment inside that framework. It indicates that the risk scenario has become materially more plausible in his analysis.
Yardeni's meltdown probability has only exceeded 35 percent during periods of genuine systemic stress. The current level signals that the oil shock has moved the needle in his risk models.
What 35% Probability Actually Means
A 35 percent meltdown probability implies roughly a one-in-three chance of a severe market decline accompanied by credit stress and liquidity deterioration.
It also implies a 65 percent probability that such a scenario does not occur.
This distinction is important. Institutional probability statements are often misunderstood as predictions. In reality, they are risk-weighting exercises designed to guide portfolio preparation rather than market timing.
The informative signal is not simply the number itself but the direction of the probability shift.
What the Two Signals Together Indicate
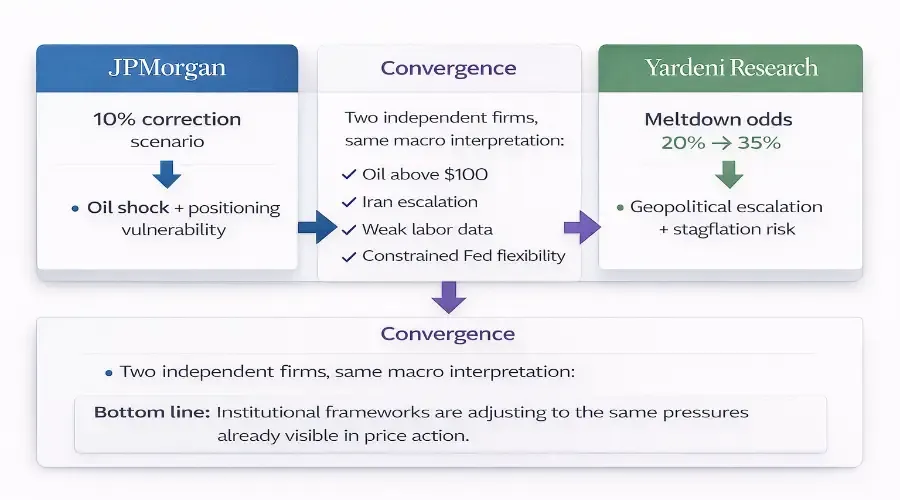
JPMorgan and Yardeni are not coordinating their analysis. Yet both arrived at similar conclusions within hours of each other.
That convergence reflects a shared interpretation of the same macro setup:
-
Oil above $100 per barrel
-
Geopolitical escalation involving Iran
-
Weaker labor market signals from last week's payrolls report
-
Reduced Federal Reserve flexibility as inflation concerns resurface
Together, these forces create the possibility of a stagflation-like environment that was not fully reflected in equity valuations entering the week.
Both JPMorgan and Yardeni would likely revise their downside scenarios lower if any of the following occur:
-
Iran de-escalation through diplomatic channels
-
Oil falls back below $90 per barrel
-
The Fed signals it will cut rates despite inflation concerns
None of these are currently visible.
The combined signal: Institutional frameworks are adjusting to the same macro pressures already visible in price action.
How Retail Traders Can Interpret Institutional Scenarios
Institutional scenario calls serve a different purpose for retail traders than for the firms issuing them.
Several principles help interpret them effectively.
Do not trade the headline.
A correction scenario published midday is not a real-time trading instruction. Institutional research reflects conversations that often began well before the public release. By the time you read it, the initial move may already be priced.
Use scenarios as level-awareness tools.
When banks discuss a potential correction, they are implicitly highlighting levels that could become structurally significant if selling persists. The 5,175 area on the S&P 500 and the 200-day moving average are now on your radar. That is valuable.
Track probability direction rather than absolute numbers.
Yardeni's move from 20 percent to 35 percent is more informative than the number itself because it signals that institutional risk perception is rising. The direction of the shift matters more than the destination.
Separate scenarios from forecasts.
Most downside scenarios discussed by major banks do not materialize. The ones that do are usually accompanied by visible deterioration in market breadth and technical structure before the research note appears.
Focus on positioning rather than commentary.
Institutional positioning indicators-fund flows, options market structure, and credit spreads-often provide clearer signals than public commentary. Put-call ratios, VIX futures curves, and high-yield spreads are worth watching.
Align with your time horizon.
Institutional scenarios often describe possibilities over 6 to 12 months, not days or weeks. A short-term trader's response to a 35 percent meltdown probability should differ from a long-term investor's. Know your horizon.
The Timing Question
Neither JPMorgan nor Yardeni specified a timeline for their downside scenarios.
In institutional analysis, "correction risk" can mean next week, next month, or next quarter. The signal is about vulnerability, not immediacy.
The Fed's blackout period, which runs until the March 20 FOMC meeting, adds uncertainty. No official commentary means markets must interpret the oil shock without policy guidance-a factor that may be amplifying the institutional reassessment.
If the oil shock persists through the blackout period, the first opportunity for Fed clarification comes with the dot plot release on March 20. Until then, markets are flying blind.
Other Institutional Voices
While JPMorgan and Yardeni have been most explicit in their public commentary, other firms have quietly adjusted their risk frameworks internally.
Goldman Sachs and Morgan Stanley have both signaled increased caution in private client conversations, though neither has published formal downside scenarios. Public commentary often lags internal positioning by days or weeks.
The convergence of multiple firms arriving at similar conclusions-even if only one has published-reinforces the signal.
Structural Close
The JPMorgan and Yardeni updates reinforce what the market had already begun to signal through price action.
The current oil shock has prompted a more serious institutional discussion about downside risks than a standard geopolitical volatility episode would normally trigger.
The mechanisms are understood. Oil drives inflation expectations. Inflation constrains the Fed. Reduced Fed flexibility pressures equity valuations. And unprepared positioning amplifies the move.
The uncertainty lies in the timing and magnitude of resolution.
For retail traders, the most productive response to rising institutional caution is not to replicate it mechanically but to understand the broader environment:
-
Which levels are structurally important
-
Which macro assumptions have changed
-
Which developments could alter the risk framework
The macro backdrop now contains genuine tension. Institutional strategists are acknowledging it, and markets are reflecting it.
Understanding that shift-regardless of which scenario ultimately unfolds-is the most valuable takeaway from the current cluster of institutional commentary.
Trader Takeaways
For investors navigating this environment, several conclusions emerge.
First, recognize what the signals mean. JPMorgan and Yardeni are not predicting a crash. They are recalibrating risk frameworks. That is different.
Second, know the levels. The S&P 500 near 5,175 and the 200-day moving average are now structurally important. Monitor price action around these zones.
Third, watch what could reverse the reassessment. Iran de-escalation, oil below $90, or Fed signals would change the institutional conversation.
Fourth, align your response with your time horizon. A 35 percent meltdown probability over 12 months does not require selling everything today.
Fifth, focus on positioning data. Put-call ratios, VIX futures, and credit spreads will tell you whether institutional caution is translating into actual de-risking.
The Bottom Line
JPMorgan warned of a 10 percent correction. Yardeni raised meltdown odds to 35 percent.
These are not trading signals. They are structured probability frameworks.
What they tell us is that institutional risk perception has shifted. The combination of oil above $100, Iran escalation, weak labor data, and constrained Fed flexibility has moved the needle for serious market strategists.
Whether the correction materializes depends on events that cannot be predicted—diplomacy, supply chains, and central bank responses.
What matters for investors is understanding that the conversation has changed.
Institutional frameworks are adjusting to the same macro pressures already visible in price action.
That is the signal. The rest is noise.
Educational Resources
Readers seeking to understand the frameworks discussed in this analysis can reference the following BreakoutBulletin guides:
-
The Stagflation Playbook - How Markets Behave When Growth Slows and Inflation Rises
-
Oil Shock Sector Map - Complete Guide to Winners and Losers When Crude Spikes
-
How to Interpret Institutional Research - Reading Bank Commentary Without Getting Burned
-
The Fed Put Explained - Why Institutions Trade Policy, Not Price
-
Options Market Structure - What Put-Call Ratios Tell You About Positioning
-
Technical Levels That Matter - The 200-Day Moving Average and Institutional Algorithms
Disclaimer
This analysis is published by BreakoutBulletin for educational and informational purposes only. It does not constitute financial advice, investment recommendations, or a solicitation to buy or sell any security or financial instrument.
All references to JPMorgan, Yardeni Research, and other institutional voices are based on publicly available information as of the publication date. Institutional scenarios and probability statements are analytical frameworks, not forecasts. Past performance is not indicative of future results.
Trading and investing involve substantial risk of loss. Readers should conduct their own independent research and consult with a qualified financial advisor before making any investment decisions. BreakoutBulletin is an educational content platform and is not a registered investment advisor, broker-dealer, or financial institution.
© 2026 BreakoutBulletin | breakoutbulletin.com | All rights reserved.