
BreakoutBulletin | Options Flow Tracker | Friday, March 7, 2026
*Educational commentary only. Not investment advice. Options involve significant risk and are not suitable for all investors. This column describes market flow patterns for educational purposes only. All data sourced from CBOE, Barchart, and YCharts as of March 7, 2026. Contract-level unusual options activity was not available through public data sources for this session-analysis relies on aggregate indicators including VIX, put/call ratios, and volatility term structure.*
Friday was one of those sessions where the options market had a lot to say. You just had to know where to look.
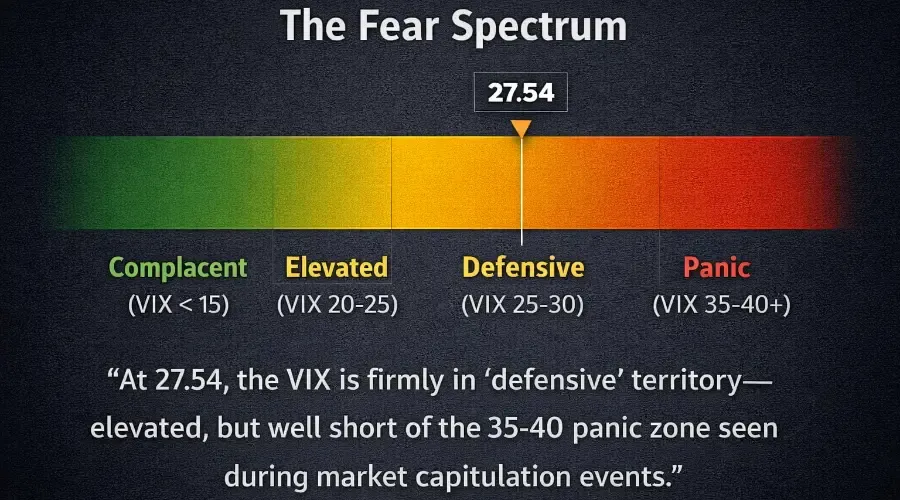
The VIX closed at 27.54, up nearly 16% on the day. The index put/call ratio hit 1.06-meaning more puts than calls on products like SPX and SPY. And the volatility term structure flipped into something traders call backwardation, where near-term options price more uncertainty than longer-dated ones.
Put those three signals together and a picture emerges. Not a panic-at least not yet-but a clear, unmistakable shift toward defensive positioning.
Here's what the options tape actually showed.
Volatility Regime Check
VIX at 27.54: What Fear Looks Like - And What It Doesn't
The VIX closed at 27.54, up 3.79 points. That's a 15.96% move in a single session-one of the largest spikes this year. To put it in perspective, the 20-day VIX average has been hovering around 21.0, with one-month futures recently trading in the 19–20 range.
The gap between 27.54 and that 19–21 baseline? That's the signal.
When volatility jumps this abruptly, it's not a gradual increase in defensive positioning. It's a repricing. Something happened—in this case, the -92,000 payroll print and oil creeping toward $90 on Iran headlines-and the options market reacted by marking up the cost of protection.
Worth noting: VIX spiked immediately after the 8:30 AM data release, touching intraday highs near 28 before settling back to 27.54 by the close. So the move was sharp, then stabilized.
Term structure: flat to slightly inverted.
March 2026 VIX futures recently traded near 25.81. That's below spot at 27.54. In options language, that condition is called backwardation-near-term volatility priced higher than volatility further out.
What backwardation usually means: the market sees peak uncertainty right now. Not building gradually, but concentrated in the present.
One more piece of context. A VIX at 27.54 is elevated, sure. But it's not a panic threshold. Historically, the kind of volatility you see during broad market capitulation tends to cluster around 35–40. This is fear, not fear itself.
Put/Call Ratio Analysis
Three Numbers, One Positioning Picture
CBOE put/call ratios tell a consistent story, just from different angles.
| Ratio | Today | One Year Ago | What It Tells You |
|---|---|---|---|
| Total P/C Ratio | 0.90 | 0.76 | Overall options activity tilted more defensive than last year |
| Index P/C Ratio | 1.06 | - | Index puts actually exceeded calls—unusual |
| Equity-Only P/C Ratio | 0.60 | 0.54 | Single-stock options stayed relatively balanced |
The index ratio is the one that jumps out. A reading above 1.00 means more put contracts than call contracts were traded on products like SPX, SPY, and QQQ. That's not something you see every day.
Here's why it matters. Institutional investors managing large equity portfolios don't usually hedge stock by stock. They use index options. So when index put/call ratios spike while single-stock ratios stay moderate, it's a pretty good sign that what you're seeing is portfolio-level hedging—not traders making directional bets against specific companies.
The divergence between 1.06 on indexes and 0.60 on single stocks? That's the fingerprint of macro hedging.
A quick teaching note: put/call ratios are sentiment indicators, not predictors. They tell you that participants are paying for protection. They don't tell you whether that protection will actually be needed. High readings can persist for weeks and resolve through time decay just as easily as through market moves.
What the Aggregate Signals Tell Us
Contract-level unusual options activity—specific strikes, expiries, trade sizes—wasn't available through public data for this session. Barchart shows alerts exist for QQQ and other major ETFs, but the details are gated behind subscription access.
So today's analysis works with what we can see: VIX, put/call ratios, term structure.
Taken together, those signals describe a market responding defensively to a macro shock. The 16% VIX spike, the index put/call ratio above 1.00, the flat-to-inverted term structure—all of it points in the same direction. Reactive hedging.
The catalysts are clear enough: a payroll print that surprised to the downside, oil holding near $90 on geopolitical headlines. When those two things happen at once, institutions typically increase portfolio protection. And they do it with index puts.
That's what the aggregate data shows.
Hedging vs. directional positioning
The distinction matters. Hedging usually means buying out-of-the-money index puts to protect an existing equity portfolio. Directional trading, by contrast, involves near-the-money or in-the-money options where profitability depends on a significant move in the underlying.
Based on the signals available, Friday's activity looks more like hedging than directional speculation. The index put/call ratio says so. The VIX spike says so. The term structure says so.
Can I confirm it definitively without contract-level data? No. But the weight of the evidence points that way.
Index & ETF Flow
The Portfolio Hedge Layer
Unusual options activity alerts exist for QQQ, according to Barchart. Similar monitoring dashboards track SPY, IWM, GLD, and TLT. The specifics weren't public, but the pattern is clear enough.
Index and ETF options are the primary tools institutions use to hedge macro exposure. When index put/call ratios rise while single-stock ratios stay moderate, the defensive positioning is happening at the portfolio level—not stock by stock.
Nasdaq-focused portfolios often use QQQ options for this. In periods of elevated volatility, managers increase index protection rather than altering individual stock positions. The presence of unusual activity alerts in QQQ aligns with that broader pattern.
OPEX Mechanics — Context for the Coming Weeks
March 20 Monthly OPEX
The March 2026 monthly options expiration is Friday, March 20. That puts today's session about two weeks out.
Because today isn't an expiration session, the mechanical effects associated with OPEX—gamma hedging, strike pinning—probably weren't driving Friday's moves. But here's what matters going forward.
Elevated volatility combined with increased index put buying can lead to significant open interest building in the current expiration cycle. As March 20 approaches, dealer hedging tied to that open interest may start influencing price behavior around key strikes.
Max pain levels and aggregate gamma exposure? Those require specialized dashboards that weren't accessible in public data. Worth noting, though: OPEX isn't some mystical force that determines where markets go. It's just the mechanical consequence of how market makers hedge their books. Useful to understand, but not a crystal ball.
Implied Volatility Education
What a VIX of 27.54 Actually Means
A VIX reading of 27.54 tells you that options traders are collectively pricing in bigger swings than usual. The VIX isn't some abstract fear gauge—it's calculated from real SPX options prices. So when it jumps, it means the people actually trading these contracts expect more turbulence ahead.
When implied volatility rises significantly above its recent average—like it did Friday—options become more expensive. The premium required to buy protection increases. That affects both hedgers paying for insurance and traders looking for directional exposure.
The term structure adds another layer. Near-term options are pricing more uncertainty than longer-dated ones, which is what backwardation means. That tells you the market views the current environment as event-driven rather than structurally unstable.
In plain English: options traders think the next few weeks might be bumpy. They're less certain about whether that bumpiness persists into the summer.
Bottom Line
Put it all together and the picture is consistent.
Institutions hedged Friday. They used index puts—not single-stock options—which tells you this was about protecting portfolios from macro risk, not betting against specific companies. The VIX spiked 16% and settled in backwardation, meaning the market sees peak uncertainty right now rather than building stress over time.
Is 27.54 a panic level? No. Panic is 35–40. But it's a clear signal that defensive positioning is real and that options traders are paying up for protection.
Whether that protection gets used or expires worthless depends on what headlines do between now and the March 20 OPEX. The payroll data landed. Oil's still elevated. Iran isn't going away. And the Fed has to figure out what to say at next week's meeting.
For now, the options tape says "hedged." That's worth watching.
Published: March 7, 2026 | BreakoutBulletin Options Flow Tracker
*Educational commentary only. Not investment advice. Options involve significant risk and are not suitable for all investors. Contract-level unusual options activity was not available through public data sources for this session. All data sourced from CBOE, Barchart, and YCharts as of March 7, 2026. Past flow patterns are not indicative of future outcomes.*