
The S&P 500 gets referenced more than any other index in financial coverage. Most adults investing for retirement have significant exposure to it, often without understanding what it actually contains. For anyone starting to invest, it's worth understanding in detail.
What It Tracks
The S&P 500 monitors 500 large U.S. companies selected by a committee at S&P Dow Jones Indices. Selection criteria include market capitalization above $14.5 billion, positive earnings over the prior four quarters, a float-adjusted market cap of at least 50% of total shares outstanding, and a minimum monthly trading volume. Companies that no longer meet the criteria are removed and replaced.
The index covers approximately 80% of total U.S. stock market value by capitalization. It spans 11 sectors: information technology, healthcare, financials, consumer discretionary, communication services, industrials, consumer staples, energy, utilities, real estate, and materials.
How Weighting Works
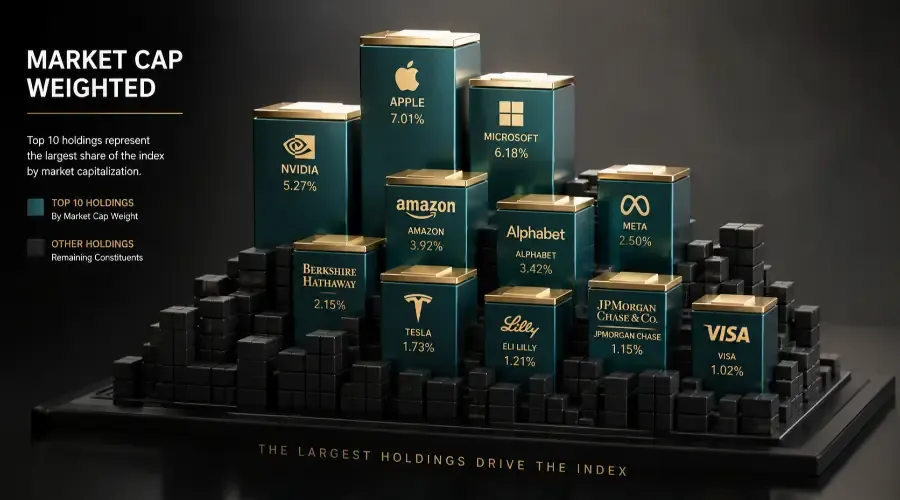
The S&P 500 is market-cap weighted. A company's share of the index corresponds to its market capitalization relative to the total market cap of all 500 constituents.
As of 2024-25, the top 10 holdings – Apple, Microsoft, Amazon, Nvidia, Alphabet, Meta, Berkshire Hathaway, Tesla, Eli Lilly, and Broadcom – represent roughly 35% of the entire index. This means when Apple or Microsoft moves sharply, the index moves with it. The remaining 490 companies divide the other 65%.
Technology and technology-adjacent sectors dominate, comprising approximately 30% of the index's total weight. That concentration has contributed to the index's strong returns during technology-driven bull markets and also amplified its declines during tech-sector contractions.
The Long-Term Return Record
Since 1928, the S&P 500 has returned approximately 10% per year on average, including dividends reinvested. That figure spans the Great Depression, multiple recessions, the 2000 dot-com collapse, the 2008 financial crisis, and the 2020 pandemic crash.
The 10% figure is an average. Individual years swing widely – gains of 25% or more in strong years, declines of 30% or more in bear markets. The long-term average only materializes for investors who stay invested through those swings rather than selling during downturns.
In 2022, the index fell roughly 18%. By the end of 2023, it had recovered those losses and reached new highs. Investors who sold in mid-2022 and waited for conditions to improve locked in a loss and missed the recovery.
How to Invest in the S&P 500
You can't buy the index directly. You buy a fund that tracks it. Three major ETFs replicate the S&P 500:
-
VOO (Vanguard S&P 500 ETF) – expense ratio approximately 0.03%
-
SPY (SPDR S&P 500 ETF Trust) – expense ratio approximately 0.095%
-
IVV (iShares Core S&P 500 ETF) – expense ratio approximately 0.03%
All three hold the same underlying stocks in the same proportions and track the index closely. The primary difference is cost and trading volume. At these fee levels, expense ratios are functionally negligible – a $10,000 investment in VOO costs about $3 per year.
Most major brokerages allow fractional share purchases, so a $25 or $50 investment buys a proportional slice of VOO regardless of the current per-share price.
What You Own When You Buy a S&P 500 Fund
One share of VOO gives you proportional exposure to all 500 companies in the index. That includes Apple and Microsoft at the top end, and smaller constituents like Etsy or Norwegian Cruise Line at the lower end. Your return tracks the collective performance of those 500 businesses, weighted by their market caps.
This is the mechanism behind "diversification through a single purchase" – you're not betting on one company's outcome but on the aggregate performance of 500.
The Case for Using It as a Core Holding
Over long periods, the majority of actively managed funds – those run by professional stock pickers – have underperformed the S&P 500 after fees. This is a documented, persistent pattern tracked by S&P's SPIVA scorecard. The index outperforms roughly 85 to 90% of actively managed large-cap funds over 15-year periods.
For an investor without the time, tools, or interest in analyzing individual companies, a S&P 500 index fund represents exposure to U.S. economic growth at minimal cost. Many investors use it as the core of their portfolio and add individual stock positions around the edges.
This content is for educational purposes only and does not constitute investment, legal, or tax advice. Investing in securities involves risk, including possible loss of principal. Always conduct your own research and consult a licensed financial professional before making investment decisions.
The S&P 500 is the most important single benchmark in U.S. investing. Once you understand what it tracks and how to access it, the natural next question is how it compares to the other major indices.
→ Stock Market Indices Explained → The full comparison of S&P 500, Dow Jones, and NASDAQ - www.breakoutbulletin.com/article/how-stock-markets-function-exchanges-liquidity
→ What Are Stock Market Indices? → The concept behind indices and how to use them as benchmarks - www.breakoutbulletin.com/article/stock-market-indices-for-teens
→ NASDAQ Composite Explained → Why it moves more than the S&P 500 and what concentration risk looks like - www.breakoutbulletin.com/article/nasdaq-composite-for-teens