
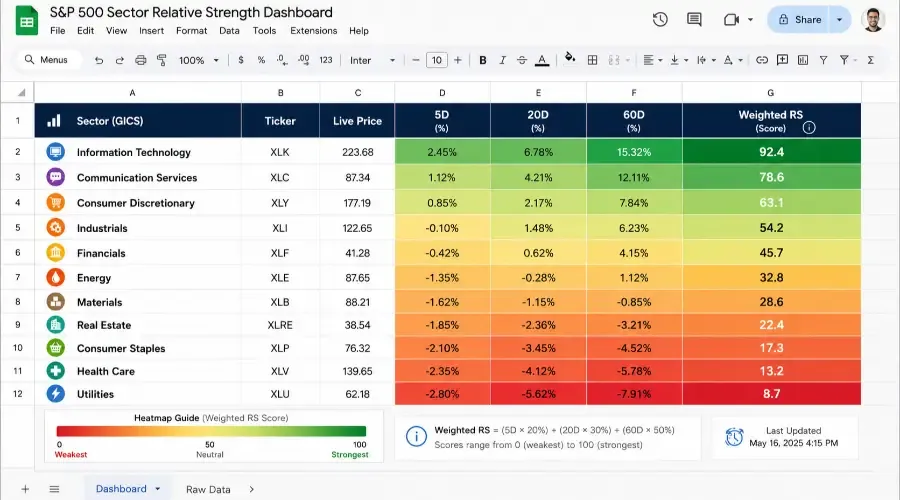
Quantitative relative strength models sound complex, but you don’t need an expensive institutional terminal or advanced programming skills to run them. You can build a fully automated, self-updating S&P 500 Sector Rotation Matrix right inside Google Sheets using built-in native formulas.
This dashboard automatically pulls market data, calculates multi-timeframe weighted relative strength scores, and ranks the leading sectors every single week.
1. The Core Dashboard Architecture
To keep your dashboard clean, we will build a single page matrix layout. Set up your spreadsheet columns exactly like this starting on Row 3:
Enter the rest of the 11 GICS sector tickers (XLF, XLY, XLC, XLI, XLB, XLE, XLV, XLP, XLU, XLRE) down Column B.
| Column A (Sector) | Column B (ETF) | Column C (Live Price) | Column D (5D Close) | Column E (20D Close) | Column F (60D Close) | Column G (Weighted RS) |
|---|---|---|---|---|---|---|
| Technology | XLK | [Formula] | [Formula] | [Formula] | [Formula] | [Formula] |
Enter the rest of the 11 GICS sector tickers down Column B in this exact order: XLF, XLY, XLC, XLI, XLB, XLE, XLV, XLP, XLU, XLRE.
Critical Anchor: On Row 15, add the S&P 500 benchmark index. Write S&P 500 in cell A15, and SPY in cell B15. The formulas below rely on referencing this exact row to compute relative performance.
2. Step-by-Step Dashboard Implementation
Step 1: Pull Live Market Data (Column C)
In cell C4 (next to XLK), input the native live price calculation formula:
=GOOGLEFINANCE(B4, "price")Drag this formula down through cell C15 to populate live pricing for all 11 sectors and the SPY benchmark.
Note: GOOGLEFINANCE real-time pricing can be delayed by up to 20 minutes depending on exchange protocols. This is perfectly normal and more than sufficient for weekly trend tracking.
Step 2: Automate Historical Lookbacks with Holiday Fallbacks (Columns D, E, F)
To extract closing prices from 5, 20, and 60 days ago, we use the WORKDAY function.
Crucial Caveat: The WORKDAY function calculates calendar weekdays, not official market trading days. This means it does not automatically account for official market holidays (such as MLK Day or Thanksgiving).
If a lookback date lands on a market holiday, a basic formula will return an error. Furthermore, simply subtracting a calendar day as a fallback fails on Monday holidays because it rolls the date back to a Sunday (which also has no data). To solve this, we nest a secondary WORKDAY function inside an IFERROR block. If the target day was a holiday, the formula safely rolls back to the previous active trading day (Friday).
Cell D4 (5 Days Ago Close):
=IFERROR(INDEX(GOOGLEFINANCE($B4, "price", WORKDAY(TODAY(), -5), WORKDAY(TODAY(), -5)), 2, 2), INDEX(GOOGLEFINANCE($B4, "price", WORKDAY(WORKDAY(TODAY(), -5), -1), WORKDAY(WORKDAY(TODAY(), -5), -1)), 2, 2))Cell E4 (20 Days Ago Close):
=IFERROR(INDEX(GOOGLEFINANCE($B4, "price", WORKDAY(TODAY(), -20), WORKDAY(TODAY(), -20)), 2, 2), INDEX(GOOGLEFINANCE($B4, "price", WORKDAY(WORKDAY(TODAY(), -20), -1), WORKDAY(WORKDAY(TODAY(), -20), -1)), 2, 2))Cell F4 (60 Days Ago Close):
=IFERROR(INDEX(GOOGLEFINANCE($B4, "price", WORKDAY(TODAY(), -60), WORKDAY(TODAY(), -60)), 2, 2), INDEX(GOOGLEFINANCE($B4, "price", WORKDAY(WORKDAY(TODAY(), -60), -1), WORKDAY(WORKDAY(TODAY(), -60), -1)), 2, 2))Highlight all three cells and drag them down to Row 15.
Step 3: Inject the Weighted Matrix Math (Column G)
Now we calculate the rate of change of each sector’s relative performance against SPY (Row 15).
We use a specific weighting strategy to score these trends: 15% on the short-term trend (5D), 35% on the medium-term trend (20D), and 50% on the long-term trend (60D). By anchoring half of the score to the 60-day horizon, we ensure the matrix filters out temporary weekly noise and focuses heavily on persistent, structural trends.
Enter this formula into cell G4:
=(0.15 * (((C4/$C$15)/(D4/$D$15))-1)) + (0.35 * (((C4/$C$15)/(E4/$E$15))-1)) + (0.50 * (((C4/$C$15)/(F4/$F$15))-1))Drag this down through cell G14. Format Column G as a Percentage (%) with two decimal places.
Why stop at G14? We exclude the SPY benchmark row (Row 15) because calculating SPY's relative strength against itself will mathematically resolve to a flat 0.00% across all timeframes. Excluding it keeps our final sector rankings accurate.
Step 4: Add the Ranking Column (Column H)
Rather than manually eyeballing the scores, we will use a native ranking formula to instantly order our sectors from 1 to 11.
Enter this formula into cell H4:
=RANK(G4, $G$4:$G$14)Drag this formula down through cell H14.
Step 5: Apply Conditional Formatting (Visual UI Heatmap)
To turn this data into a scannable heatmap:
Select your quantitative data range from G4:G14.
Right-click, choose Conditional Formatting, and select Color Scale.
Set the minimum value (negative scores) to a soft red, the midpoint (0.00%) to a neutral white, and the maximum value (positive scores) to a soft green.
3. How to Interpret the Matrix Live
Your matrix is now fully dynamic. Every time you open the spreadsheet, the data refreshes automatically. Use this tiered structural ranking to guide your weekly capital allocation:
- 🟩 Ranks 1–3 (Leading Sectors): These sectors possess dominant multi-timeframe relative strength, consistent with areas where major institutional capital may be positioning. Focus your long trade setups here.
- ⬜ Ranks 4–7 (Neutral / Rotation Watch): These sectors are performing in line with the broader market. Existing core positions can generally be held, but new aggressive exposure is not favored.
- 🟥 Ranks 8–11 (The Laggards): Even if these sectors look cheap on an absolute basis, their low scores suggest relative underperformance against the benchmark. Avoid initiating new long positions in these sectors until the matrix signals a structural shift.
Want to skip the setup? Email us at BreakoutBulletin@gmail.com and we'll send you the ready-made Google Sheet template - free.
Disclaimer: This content is for educational and informational purposes only and does not constitute investment or financial advice. The Sector Rotation Matrix is based on publicly available market data and quantitative calculations, which may be delayed, incomplete, or inaccurate at times. Past performance and relative strength rankings do not guarantee future results. Always conduct your own research and consult a qualified financial professional before making any investment decisions.