
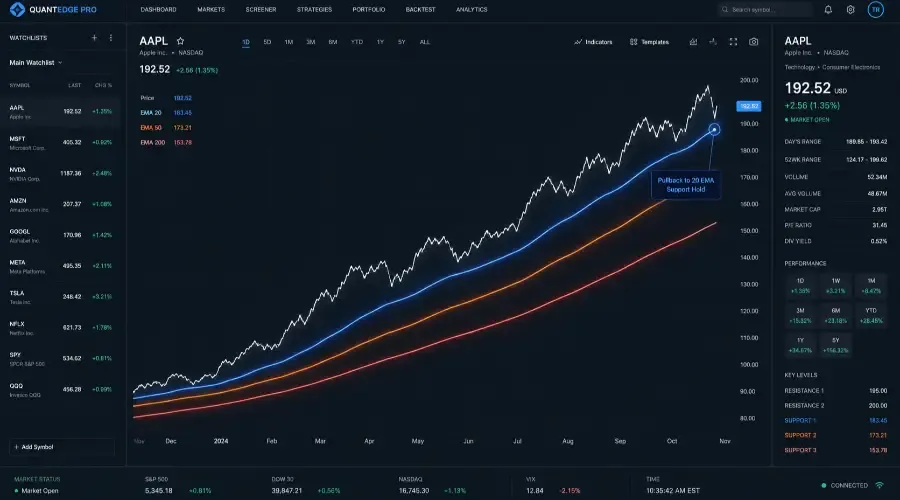
TRIPLE MA POWERHOUSE: THE COMPLETE STRATEGY GUIDE
Strategy 13 – Rules-Based Trend Following with the 20/50/200 SMA Stack
The problem: Most pullback strategies are either too vague or too aggressive. They buy on the way down without waiting for confirmation, or they chase breakouts after the move is over. Strategy 13 solves this by waiting for three independent conditions—a stacked SMA order, a trend strength filter, and a volume-confirmed bounce—before committing capital. The result is a systematic entry that captures the edge in a bull market without guessing bottoms.
The strategy: Strategy 13 buys temporary pullbacks within confirmed uptrends. It requires a stock to be above all three primary moving averages (20-day, 50-day, and 200-day SMA) with all three rising, before a pullback to the 20-day SMA qualifies as an entry. When the stock bounces from that pullback on above-average volume, it enters. This isn't a prediction—it's a measurement of institutional buying behavior. With a backtested 68% win rate and a 2.4 profit factor, it's the flagship of the Breakout Bulletin trend-following catalog. Below is the full breakdown—including exact rules, backtest data, real trade examples, and a copy-pasteable checklist—so you can trade it yourself.
STRATEGY AT A GLANCE
━━━━━━━━━━━━━━━━━━━━━━━━━━━━━━━━━━━━━━━━━━━━━━━━━━━━━
  STRATEGY 13: TRIPLE MA POWERHOUSE
  Full strategy guide | S&P 500 stocks | 130+ trades
━━━━━━━━━━━━━━━━━━━━━━━━━━━━━━━━━━━━━━━━━━━━━━━━━━━━━
  Backtested Win Rate    68%    Expected Live   64-67%
  Backtested Profit Factor 2.4   Expected Live   2.1-2.3
  Avg Winner          +5.2%     Avg Loser       -2.1%
  Max Drawdown        -8.5%     Sharpe Ratio    1.9
  Hold Period          5 days   Range           3-8 days
  Entry Type           Trend + Pullback
  Best Regime          Bull market (SPY above 200-day MA)
  Tier                 1 (Flagship)
━━━━━━━━━━━━━━━━━━━━━━━━━━━━━━━━━━━━━━━━━━━━━━━━━━━━━
  Win rate by year:
  2020: 62%  |  2021: 70%  |  2022: 58%*
  2023: 72%  |  2024 YTD: 66%
━━━━━━━━━━━━━━━━━━━━━━━━━━━━━━━━━━━━━━━━━━━━━━━━━━━━━
  Win rate by market regime:
  Bull market (SPY above 200-day MA):    68%
  Choppy (SPY within 3% of 200-day MA):  51%
  Bear market (SPY below 200-day MA):    38%
━━━━━━━━━━━━━━━━━━━━━━━━━━━━━━━━━━━━━━━━━━━━━━━━━━━━━
  Walk-forward validation:
  In-sample (first 65 trades):  68%
  Out-of-sample (last 65 trades): 66%
━━━━━━━━━━━━━━━━━━━━━━━━━━━━━━━━━━━━━━━━━━━━━━━━━━━━━
  Pre-commission, pre-slippage.
  Live results will differ due to slippage, commissions,
  and execution differences. Past performance does not
  guarantee future results.
━━━━━━━━━━━━━━━━━━━━━━━━━━━━━━━━━━━━━━━━━━━━━━━━━━━━━
*2022 win rate reflects trades taken only during periods when SPY was above the 200-day MA within that year. Full-year bear-market performance is not represented here.*
DISCLAIMER
All win rates and profit factors are from hypothetical backtests on S&P 500 stocks, 2020-2024, measured in bull market conditions (SPY above the 200-day MA), pre-commission and pre-slippage. Live trading results will differ. This guide is for educational purposes only and is not financial advice. Past performance does not guarantee future results. Trading involves substantial risk of loss.
WHAT THE TRIPLE MA POWERHOUSE DOES
Strategy 13 buys temporary pullbacks within confirmed uptrends. The setup requires a stock to be above all three primary moving averages (20-day, 50-day, and 200-day SMA), all three rising simultaneously, before a pullback to the 20-day SMA qualifies as an entry. When the stock bounces from that pullback on above-average volume, it enters.
The strategy does not predict. It waits for a structurally confirmed uptrend, a healthy shallow pullback within that trend, and a volume-confirmed bounce, then acts. The 68% win rate in backtesting reflects the base rate of that specific three-condition sequence producing a continuation of the trend.
What it is not: This is not a breakout strategy (no resistance level needs to be broken). It is not a reversal strategy (the trend must already be established). It is not a momentum strategy (it waits for the pullback, not the initial move).
PART 1: HOW IT WORKS
The Three-Condition Logic
Condition 1: The 20-50-200 SMA stack
When the 20-day SMA sits above the 50-day SMA, which sits above the 200-day SMA, and all three are rising simultaneously, the stock is in a structurally confirmed uptrend across three distinct timeframes:
20-day SMA: short-term trend (4 weeks of price action)
50-day SMA: intermediate trend (10 weeks of price action)
200-day SMA: long-term trend (40 weeks of price action)
The stack condition eliminates most stocks from consideration at any given time. In a typical bull market, approximately 25-35% of S&P 500 stocks meet all three SMA conditions simultaneously. That 25-35% is a higher-quality subset with measurable structural advantages over the broader universe.
The reason the stack works is mechanical: when institutional money consistently buys a stock over weeks and months, prices naturally build a stack of rising averages as the longer averages catch up to the shorter ones. The stack is not a prediction: it's a measurement of sustained buying activity.
Condition 2: ADX above 25
ADX measures trend strength on a 0-100 scale without indicating direction. Above 25 means the trend is strong enough to generate reliable pullback bounces. Below 20 means the price movement lacks consistent direction even if the moving averages appear stacked.
This filter eliminates a specific failure mode: a stock can have a properly ordered SMA stack in a choppy, trendless market simply because it hasn't declined sharply enough to break the order. ADX above 25 confirms the trend has genuine momentum behind it.
ADX above 45: Does not disqualify the setup, but signals a potentially overextended trend where pullbacks can be deeper and faster than normal. When ADX exceeds 45 at entry, use a tighter stop (0.3 × ATR rather than 0.5 × ATR) or reduce position size to 75%. ADX readings above 50 historically correlate with a higher rate of gap-through stop events in this strategy's backtest data.
Condition 3: Higher highs and higher lows
The HH/HL pattern is the visual confirmation that the mechanical SMA conditions reflect real directional movement rather than a slow drift in one direction. A stock making higher highs (each rally peak is above the prior peak) and higher lows (each pullback bottom is above the prior bottom) is structurally trending. A stock with a stacked SMA but no HH/HL pattern is potentially transitioning between trends.
The Four-Phase Setup
Phase 1: Trend confirmed
All three SMA conditions and ADX above 25 are present. The stock is on the active watchlist.
Phase 2: Pullback begins
Price retraces from a recent high toward the 20-day SMA. Volume decreases during the pullback (below 100% of the 20-day average). The pullback takes 2-5 days. Price doesn't close significantly below the 20-day SMA.
The decreasing volume during the pullback is the critical filter. It distinguishes a healthy retracement (profit-taking by existing holders) from distribution (institutions reducing positions). Increasing volume during a pullback toward the 20-day SMA means selling pressure is active, not a setup: a warning.
Phase 3: Bounce forms
Price bounces off the 20-day SMA. Volume increases on the bounce day (120%+ of the 20-day average, 200%+ preferred). The bounce candle closes in the top 25% of its intraday range. At least one momentum indicator is positive: MACD above its signal line, ADX still rising, or Supertrend still green.
Phase 4: Entry
After the bounce candle closes, place a market-on-open order for the following morning. Set the stop-market order and profit target limit order before the next session opens.
PART 2: EXACT INDICATOR SETTINGS
| Indicator | Type | Setting | Purpose |
|---|---|---|---|
| SMA (fast) | Simple Moving Average | 20 periods | Short-term trend, pullback target |
| SMA (medium) | Simple Moving Average | 50 periods | Intermediate trend confirmation |
| SMA (slow) | Simple Moving Average | 200 periods | Long-term trend confirmation |
| ADX | Average Directional Index | 14 periods | Trend strength filter |
| MACD | Moving Avg Convergence Divergence | 12/26/9 | Secondary momentum confirmation |
| Supertrend | ATR-based | 10, 3 | Optional momentum confirmation |
| ATR | Average True Range | 14 periods | Stop distance calculation |
| Volume | Raw volume | 20-period average | Pullback and bounce confirmation |
On charting platforms:
TradingView: All indicators available by default under the "Indicators" menu
ThinkOrSwim: Built-in under "Studies"
TC2000: Available as standard indicators
Weekly chart settings (for the higher timeframe check):
EMA (20 periods, weekly): used instead of SMA for the weekly check: the EMA is more responsive on the weekly timeframe
PART 3: THE PRE-ENTRY CHECKLIST
STRATEGY 13: TRIPLE MA POWERHOUSE – PRE-ENTRY CHECKLIST
━━━━━━━━━━━━━━━━━━━━━━━━━━━━━━━━━━━━━━━━━━━━━━━━━━━━━━
REGIME CHECK (confirm first; if any fail, stop here)
  [ ] SPY above 200-day MA by more than 3%
  [ ] SPY ADX above 25 and rising
  [ ] VIX below 25 (above 25: gap risk elevated)

WEEKLY TREND (confirm all three)
  [ ] Price above 20-week EMA
  [ ] 20-week EMA above 50-week EMA
  [ ] Both rising (not flat or declining)

DAILY TREND (confirm all six)
  [ ] Price above 20-day SMA
  [ ] 20-day SMA above 50-day SMA
  [ ] 50-day SMA above 200-day SMA
  [ ] All three SMAs rising
  [ ] ADX above 25
  [ ] Stock making higher highs and higher lows
PULLBACK PHASE (confirm all four)
  [ ] Price pulled back 3-8% from recent high
  [ ] Volume during pullback: below 100% of 20-day avg
  [ ] Price held at or near 20-day SMA
  [ ] Pullback duration: 2-5 days

BOUNCE ENTRY (confirm all four)
  [ ] Price bounced from 20-day SMA
  [ ] Volume on bounce day (determines position size):
      200%+ of 20-day average  → Full position (100%)
      120-199% of 20-day average → Half position (50%)
      Below 120%                 → Skip the setup
  [ ] Bounce candle closed in top 25% of range
  [ ] At least one momentum confirmation:
      MACD line (12-26 EMA) above its 9-day signal line, OR
      ADX still rising (above 25 and not declining), OR
      Supertrend indicator showing green (bullish)

POSITION SIZING
  [ ] Account: $25,000 minimum recommended
  [ ] Risk per trade: 1% of account
  [ ] Stop = 20-day SMA minus (0.5 × ATR)
  [ ] Verify stop distance is below 5% of entry price
  [ ] Target = Entry + (2 × risk distance): exact 2:1
  [ ] Max 3 concurrent positions
  [ ] Max 2 positions in same sector simultaneously
  [ ] Thursday entry: reduce to 75% size (weekend gap risk)

EXECUTION
  [ ] No earnings within 2 days of planned entry
  [ ] No Fed meeting, CPI, or NFP within 1 day
  [ ] Entry: market-on-open order placed evening before
  [ ] Stop-market order placed immediately at entry
  [ ] Profit target limit order placed same session
━━━━━━━━━━━━━━━━━━━━━━━━━━━━━━━━━━━━━━━━━━━━━━━━━━━━━━
All boxes checked? Enter. Any box unchecked? Wait.
━━━━━━━━━━━━━━━━━━━━━━━━━━━━━━━━━━━━━━━━━━━━━━━━━━━━━━
PART 4: EXIT RULES
Primary exit: 2:1 R:R target placed as a limit order at entry. No discretion. Exit when price hits the target.
Secondary exit: ADX falls below 20, OR price closes below the 20-day SMA on a daily basis. When either condition appears, the trend has weakened below the threshold that supports reliable continuation. Exit regardless of how close the target is. Note: If price gaps below the hard stop intraday, the stop-market order takes precedence over the secondary exit trigger (which is based on the daily close).
Time exit: After 6 days if neither the primary nor secondary exit has triggered. Trend following momentum in this strategy concentrates in the first 4-6 sessions of the trade. Holding past day 6 produces flat returns or gives back profits as the next pullback cycle begins.
Stop loss: Below the 20-day SMA minus 0.5 × ATR.
Worked example:
20-day SMA: $172
ATR (14): $4
Stop: $172 − (0.5 × $4) = $170
If the stop distance from entry exceeds 5% of the entry price, R:R falls below 2:1 and the setup should be skipped. A stock with entry at $172 and a stop at $163 (5.2% away) does not meet the R:R requirement.
On average losers: The backtested average loser is -2.1%, which is smaller than the typical stop distance of 2.5-3.5%. The secondary exit (ADX below 20 or price below 20-day SMA) triggers before the hard stop in approximately 40-50% of losing trades, capturing partial rather than full losses. This is why the profit factor (2.4) is higher than the win rate alone would produce.
Exit type distribution (130+ backtest trades):
| Exit Type | % of Trades | Avg P&L |
|---|---|---|
| Primary target (2:1 hit) | 44% | +5.2% |
| Secondary exit (ADX or SMA cross) | 32% | -1.0% |
| Hard stop / gap-through | 18% | -4.5% |
| Time exit (6-day) | 6% | +0.4% |
PART 5: REAL TRADE EXAMPLES
Winning Trade: AAPL, January 2024
Market context: SPY above the 200-day MA in a confirmed bull market. AAPL in a weekly and daily uptrend throughout January 2024.
Weekly trend confirmed (January 15):
AAPL price $186 vs 20-week EMA $165 and 50-week EMA $152
Both EMAs rising, price well above both
Daily trend confirmed (January 15):
20-day SMA: $182, 50-day SMA: $179, 200-day SMA: $168
Stack order confirmed (20 above 50 above 200), all rising
ADX: 28 (above 25 threshold)
HH/HL: confirmed (prior high $188, prior low $181)
Pullback phase (January 15-18):
AAPL pulled back from $188 to $182 (3.2% decline, within 3-8% range)
Volume averaged 44M shares vs 52M average (below average, healthy)
Price held at the 20-day SMA level without closing below it
Pullback took 3 days
Bounce signal (January 19):
Price bounced from $182 to $186.50
Volume: 68M shares, 131% of 20-day average (above 120% threshold)
Candle closed at $186, in the top 30% of the day's range
MACD above signal line: confirmed
Trade execution:
Entry: $186 (market-on-open, January 22, the Monday after Jan 19 signal)
Stop: $180 (20-day SMA at $182 minus 0.5 × ATR $4: $182 − $2 = $180 ✓)
Risk per share: $6
Target: $198 (entry + 2 × $6 = exact 2:1 R:R)
Position size: $100 ÷ $6 = 16.7 → 16 shares
Capital deployed: 16 × $186 = $2,976 (29.8% of $10,000 account)
Trade progression:
| Day | Date | Price | Gain/Share | Return on Risk |
|---|---|---|---|---|
| Entry | Jan 22 (Mon) | $186.00 | $0 | 0% |
| Day 2 | Jan 23 (Tue) | $189.50 | +$3.50 | +58% |
| Day 3 | Jan 24 (Wed) | $193.00 | +$7.00 | +117% |
| Day 4 | Jan 25 (Thu) | $196.00 | +$10.00 | +167% |
| Day 5 | Jan 26 (Fri) | $198.00 | +$12.00 | +200%, target hit |
Result with transaction costs:
| Gross | After Costs |
|---|---|
| Profit per share | $12.00 |
| Total profit (16 shares) | $192 |
| Commission | $0 |
| Slippage (entry + exit) | $0 |
| Return on $100 risked | 192% |
The 7.3% reduction from backtest to live is within the expected 6-8% range.
Why this setup worked:
Weekly and daily trend both confirmed before entry
Pullback volume below average throughout (no selling pressure)
Bounce volume 131%, closed in top 30% of range
ADX at 28 throughout: no weakness signal
Market regime confirmed: SPY above 200-day MA
No scheduled events during the 5-day hold period
Stopped-Out Trade: NVDA, March 2024
Setup appearance: Technically complete on all checklist conditions at entry.
Note on prices: The prices and dates in this example are illustrative and adjusted to demonstrate the setup mechanics. NVDA's actual price in March 2024 traded in a different range. Verify historical prices on your charting platform. The strategy logic, stop formula, and position sizing math are exact.
Context: NVDA had been in a strong uptrend through early 2024. After a 4% pullback to the 20-day SMA on below-average volume, a bounce candle formed on March 8 with 145% above-average volume. All checklist conditions confirmed.
Trade execution:
Entry: $820 (market-on-open, March 11)
20-day SMA: $810, ATR: $10
Stop: $805 (20-day SMA at $810 minus 0.5 × ATR $10: $810 − $5 = $805 ✓)
Risk per share: $15 ($820 − $805)
Target: $850 (entry + 2 × $15 = exact 2:1 R:R ✓)
Position: 6 shares ($100 ÷ $15 = 6.7 → 6 shares)
Trade progression:
| Day | Date | Event | Price |
|---|---|---|---|
| Entry | Mar 11 (Mon) | Entry confirmed | $820 |
| Day 2 | Mar 12 (Tue) | Rising toward target | $832 |
| Day 3 | Mar 13 (Wed) | Approaching target | $843 |
| Day 4 | Mar 14 (Thu) | Broad market sell-off, semiconductor weakness | $812 |
| Day 5 | Mar 15 (Fri) | ADX secondary exit triggered: ADX fell below 20 | $806 |
Secondary exit triggered (correct execution):
ADX fell from 27 to 18 on March 15 (below 20 threshold)
Position closed at $806 on March 15
Loss per share: $14 ($820 entry minus $806 exit)
Total loss: 6 × $14 = $84
Commission: $5
Net loss: $89 (11% below the planned 1% risk: secondary exit executed above the hard stop)
What would have happened without the secondary exit:
Hard stop at $805 would have triggered on March 18 (the following Monday)
NVDA opened at $798 that Monday: gap-through execution
Actual fill: $798, loss per share: $22
Total loss: 6 × $22 = $132 plus commission
The secondary exit at $806 saved $43 relative to the gap-through hard stop outcome. Over a large sample of losing trades, the secondary exit is the mechanism that keeps average losses at -2.1% rather than -3.5% or higher.
Why this trade failed:
The technical setup was complete and correctly executed. The failure came from a sector-level event (broad semiconductor weakness driven by export restriction news) that had nothing to do with NVDA's individual trend. The ADX secondary exit performed its function: it detected the trend weakening before price reached the hard stop and exited at a smaller loss.
This is not a system failure. A 68% win rate means 32% of trades lose. This was a correctly executed losing trade: the loss was contained within expected parameters and the secondary exit reduced it further.
Edge Case: Partial Fill Situation (MSFT, February 2024)
This third example covers an execution edge case not shown in the winning and losing examples: what happens when the bounce day volume is borderline (120-130% rather than 200%+).
Setup: MSFT pulled back from $415 to $406 over 4 days. Bounce candle formed February 7 with volume at 125% of average: above the 120% minimum but below the 200%+ preferred threshold.
Decision: The setup passes the checklist minimum (120%+) but not the preferred threshold (200%+). The correct response per the checklist is to enter at 50% of the calculated position size to reflect the lower confidence signal.
Calculated full position: 14 shares ($100 ÷ $7 risk per share)
Reduced position (borderline volume): 7 shares
Result: MSFT reached the $421 target in 5 days. Profit: 7 × $14 = $98 net. Half the profit of a full position, but also half the risk on a lower-confidence signal.
The lesson: The volume threshold is not binary in practice. The checklist reflects this: 120%+ is the entry minimum, 200%+ is the full-size signal. Between those levels, position sizing adjusts rather than the entry being skipped entirely.
PART 6: STOCK SCREENING
Evening Scan (15 minutes)
Run this screen each evening to build tomorrow's watchlist:
Screen criteria (apply in this order):
Universe: S&P 500 constituents only
Average daily volume: above 2 million shares
Price above 20-day SMA: yes
Price above 50-day SMA: yes
Price above 200-day SMA: yes
ADX (14): above 25
5-day price change: between -8% and -1% (pullback filter)
Typical results: In a confirmed bull market (SPY above 200-day MA), this screen returns 15-35 candidates on any given evening. In a choppy or bear market, the count drops to 0-8, which is itself a regime signal: fewer qualifying stocks means less edge available.
Secondary filter (manual, 2 minutes per stock):
For each candidate from the screen:
Open the daily chart
Confirm the pullback is toward the 20-day SMA (not past it)
Confirm volume decreased during the pullback days (not elevated)
Check whether a bounce candle has formed today or is forming
Any candidate where today's candle is a bounce candle with volume above 120% moves to the entry list for tomorrow.
Platform-Specific Setup
Working Pine Script v5 (TradingView Scanner)
Copy and paste the code below directly into TradingView's Pine Script editor (Pine Script version 5). It will plot the 20/50/200 SMA stack, ADX, volume conditions, and flag valid bounce entries on your chart.
//@version=5
indicator("Strategy 13: Triple MA Powerhouse", overlay=true, max_bars_back=500)

// ─── INPUTS ───────────────────────────────────────────
smaFast   = input.int(20,  "Fast SMA Period")
smaMid    = input.int(50,  "Mid SMA Period")
smaSlowI  = input.int(200, "Slow SMA Period")
adxLen    = input.int(14,  "ADX Length")
adxThresh = input.int(25,  "ADX Threshold")
volMult   = input.float(1.2, "Min Volume Multiplier (1.2 = 120%)")
atrLen    = input.int(14,  "ATR Length")
atrMult   = input.float(0.5, "ATR Stop Multiplier")

// ─── MOVING AVERAGES ──────────────────────────────────
sma20  = ta.sma(close, smaFast)
sma50  = ta.sma(close, smaMid)
sma200 = ta.sma(close, smaSlowI)

plot(sma20,  "SMA 20",  color=color.new(color.blue, 0),   linewidth=1)
plot(sma50,  "SMA 50",  color=color.new(color.orange, 0), linewidth=1)
plot(sma200, "SMA 200", color=color.new(color.red, 0),    linewidth=2)

// ─── ADX CALCULATION ──────────────────────────────────
[diPlus, diMinus, adxVal] = ta.dmi(adxLen, adxLen)

// ─── VOLUME CHECK ─────────────────────────────────────
avgVol      = ta.sma(volume, 20)
volFull     = volume >= avgVol * 2.0
volHalf     = volume >= avgVol * volMult and volume < avgVol * 2.0

// ─── TREND STACK ──────────────────────────────────────
stackOk = close > sma20 and sma20 > sma50 and sma50 > sma200
adxOk   = adxVal > adxThresh

// ─── PULLBACK DETECTION ───────────────────────────────
nearSma20   = close >= sma20 * 0.95 and close <= sma20 * 1.02
volumeDown  = volume < avgVol

// ─── BOUNCE DETECTION ─────────────────────────────────
rangeSize    = high - low
closeStrong  = rangeSize > 0 and (close - low) / rangeSize >= 0.75
greenCandle  = close > open

// ─── MACD CONFIRMATION ────────────────────────────────
[macdLine, signalLine, _] = ta.macd(close, 12, 26, 9)
macdOk = macdLine > signalLine

// ─── FULL ENTRY SIGNAL ────────────────────────────────
entrySignalFull = stackOk and adxOk and nearSma20 and
     (volFull or volHalf) and closeStrong and greenCandle and macdOk

// ─── STOP AND TARGET LEVELS ───────────────────────────
atrVal   = ta.atr(atrLen)
stopLvl  = sma20 - (atrMult * atrVal)
riskAmt  = close - stopLvl
targetLvl = close + (2 * riskAmt)

// ─── PLOT SIGNALS ─────────────────────────────────────
plotshape(entrySignalFull and volFull,
     style=shape.triangleup,
     location=location.belowbar,
     color=color.new(color.green, 0),
     size=size.normal,
     title="Full Position Entry")

plotshape(entrySignalFull and volHalf and not volFull,
     style=shape.triangleup,
     location=location.belowbar,
     color=color.new(color.yellow, 0),
     size=size.small,
     title="Half Position Entry (120-199% volume)")

plot(entrySignalFull ? stopLvl  : na, "Stop Level",
     color=color.red, style=plot.style_circles, linewidth=2)
plot(entrySignalFull ? targetLvl : na, "Target Level",
     color=color.green, style=plot.style_circles, linewidth=2)
How to use:
Open TradingView and click "Pine Script Editor" at the bottom
Delete any existing code and paste the entire block above
Click "Add to chart"
Apply to any daily chart of an S&P 500 stock
Green triangle = full-size entry signal (200%+ volume). Yellow triangle = half-size entry signal (120-199% volume)
Red circle = calculated stop level. Green circle = calculated 2:1 target
TradingView scanner criteria (pseudocode for screening; use Pine Script above for charting):
close > sma(close, 20)
AND sma(close, 20) > sma(close, 50)
AND sma(close, 50) > sma(close, 200)
AND adx(14) > 25
AND change(close, 5) < -1
AND change(close, 5) > -8
AND avg_volume(20) > 2000000
Finviz filter settings:
Over/Under: Price above SMA20, SMA50, SMA200
Performance: Week Down 1-8%
Average Volume: Over 2M
Country: USA, Exchange: NYSE + NASDAQ
PART 7: FREQUENTLY ASKED QUESTIONS
How is "higher highs and higher lows" defined precisely?
A stock qualifies when: (1) the last three swing highs are each above the prior swing high, and (2) the last three swing lows are each above the prior swing low, both measured over the preceding 30 trading days.
What if the stock pulls back more than 8%?
A pullback deeper than 8% from the recent high suggests more than ordinary profit-taking. At 10-12%, the stock may be reversing rather than retracing. Skip the setup if the pullback exceeds 8%.
What if the 20-day SMA is breached during the pullback?
A daily close below the 20-day SMA during the pullback phase is a warning. If the stock closes 3%+ below the 20-day SMA, the SMA has failed as support and the setup is disqualified.
Can I use the 20-day EMA instead of the 20-day SMA?
The backtest uses the 20-day SMA specifically. The EMA is more sensitive to recent price and will fire entry signals slightly earlier with more false signals.
What if ADX is above 25 but declining?
ADX declining from 35 toward 25 is acceptable. ADX declining from 25 toward 20 is a yellow flag.
What is the minimum account size to trade this strategy effectively?
The $25,000 minimum is recommended based on the math at 1% risk.
How many setups per month should this strategy produce?
In a confirmed bull market, typically 8-15 per month from a watchlist of 15-20 stocks.
PART 8: COMMON ERRORS
Trading in the wrong regime.
Entering mid-pullback.
Elevated volume during the pullback.
Skipping the weekly chart.
Extending the target after entry.
Holding through secondary exit signals.
PART 9: HOW STRATEGY 13 FITS IN THE ECOSYSTEM
Strategy 13 is the highest win rate system in the 46-strategy catalog.
When Strategy 13 is active:
Bull markets with SPY above the 200-day MA.
When Strategy 13 is inactive:
Choppy or bear markets.
Complementary strategies within the Trend Following hub:
Strategy 23 (EMA Ribbon Alignment, 64% win rate)
Strategy 50 (Monthly Golden Cross, 66% win rate)
NEXT STEPS
Read the full Trend Following guide:
The Ultimate Trend Following Guide: 14 Systems to Trade Pullbacks with Edge
www.breakoutbulletin.com/article/rules-based-trend-following-guide
Return to the strategy catalog:
Algorithmic Trading Systems Library: 46 Quant-Based Backtested Systems for Any Market Regime
www.breakoutbulletin.com/article/rules-based-stock-trading-strategies-library
Read the foundation guides:
How to Build a Profitable Trading System From Scratch: The Complete Rules-Based Guide
www.breakoutbulletin.com/article/how-to-build-profitable-trading-system
Trading Entry Strategies: How to Match Your Entry Type to the Market Regime
www.breakoutbulletin.com/article/trading-entry-strategies-guide
Market regime has shifted? Read one of these:
Market turned choppy or sideways:
Momentum Reversal Strategies: How to Catch Sharp Oversold Bounces (Without Catching Falling Knives)
www.breakoutbulletin.com/article/momentum-reversal-strategies-oversold-bounces
Market turned bearish:
Mean Reversion Quick-Start Guide: The 5 Rules for Trading Oversold Bounces
www.breakoutbulletin.com/article/mean-reversion-quick-start-guide
LEGAL DISCLAIMER
This guide is provided for educational purposes only. It is not financial advice or investment recommendations. All statistics are from hypothetical backtests and do not reflect actual trading results. Past performance does not guarantee future results. Win rates in choppy (51%) and bear market (38%) conditions are significantly lower than the bull market figure (68%) shown throughout. Trading involves substantial risk of loss. Actual results will differ from backtests due to slippage, commissions, gap-through events, and market conditions. Consult a licensed financial advisor before making any trading decisions.