
14 Rules-Based Systems for Trading Pullbacks in Confirmed Uptrends
If you've been trading through the last few years of the S&P 500's grind higher, you know the hardest thing isn't finding stocks that go up- it's catching the temporary dips that separate the profitable entries from the anxious exits. Trend following in a confirmed bull market isn't about heroically picking bottoms; it's about waiting for the structural setup where all major timeframes align, volume confirms the pause, and the bounce becomes the trigger to re-enter the upward flow.
This Hub 2 guide covers 14 trend following systems, but we don't just throw a table at you and walk away. We fully detail our highest-probability strategy - Triple MA Powerhouse (Strategy 13) with complete entry rules, a copy-pasteable checklist, real trade examples, and a backtest summary with year-by-year and regime-by-regime breakdowns. The other 13 strategies are summarized with their key stats so you know the full landscape, but if you start anywhere, start here.
DISCLAIMER: BACKTEST METHODOLOGY
All win rates and profit factors in this guide come from hypothetical backtests on S&P 500 stocks, 2020-2024, pre-commission and pre-slippage, measured in bull market conditions (SPY above the 200-day MA).
Critical adjustments for live trading:
-
Commissions and slippage reduce actual results by 5-15% per round-trip
-
A backtest showing 68% win rate should be expected to produce 64-67% in live conditions
-
A backtest showing 2.4 profit factor should be expected to produce 2.1-2.3 in live conditions
-
Win rates in bear markets (SPY below 200-day MA) drop to 35-50%; this system is not regime-neutral
-
Results vary by stock selection, volatility, and execution quality
-
Past performance does not guarantee future results
Full backtest methodology, sample sizes, and walk-forward analysis are in each individual strategy's dedicated guide.
Volume standard across this hub: A reading of 120%+ relative to the 20-day average is the minimum for bounce confirmation. 200%+ is the preferred threshold for the highest-conviction entries. Below 100% on the bounce candle, the setup does not qualify regardless of other conditions.
WHAT TREND FOLLOWING STRATEGIES DO
Trend following buys temporary pullbacks within confirmed uptrends. The underlying logic is directional: a stock trading above all three major moving averages (20-day, 50-day, 200-day), with all three rising, is in a structurally bullish state. When that stock pulls back 3-8% on below-average volume, it's exhibiting a technical retracement, not a reversal. When volume increases on the bounce candle and the stock closes near the top of its range, the retracement has ended and the trend is resuming.
The distinction from momentum reversal (Hub 1) is context. Momentum reversal buys oversold conditions in any direction – the setup works in choppy markets where no clear trend exists. Trend following requires a confirmed uptrend first. The additional filter produces the highest win rates of any hub in the catalog (52-68%), at the cost of fewer setups in non-trending conditions.
The entry type is Trend + Pullback (covered in full in Pillar 2). Every strategy in this hub applies the same underlying structure with a different combination of momentum and timing indicators.
PART 1: HOW TREND FOLLOWING SETUPS FORM
The Four-Phase Structure
Phase 1: Weekly trend confirmation
The weekly chart establishes the dominant trend context. Before checking any daily setup, confirm:
-
Price above 20-week EMA
-
20-week EMA above 50-week EMA
-
Both moving averages rising (not flat or declining)
-
Stock making higher highs on the weekly chart
If the weekly trend is not confirmed, skip the setup regardless of how clean the daily chart looks. A daily bounce within a weekly downtrend is a counter-trend trade with materially lower win rates.
Phase 2: Daily trend confirmation
The daily chart must align with the weekly:
-
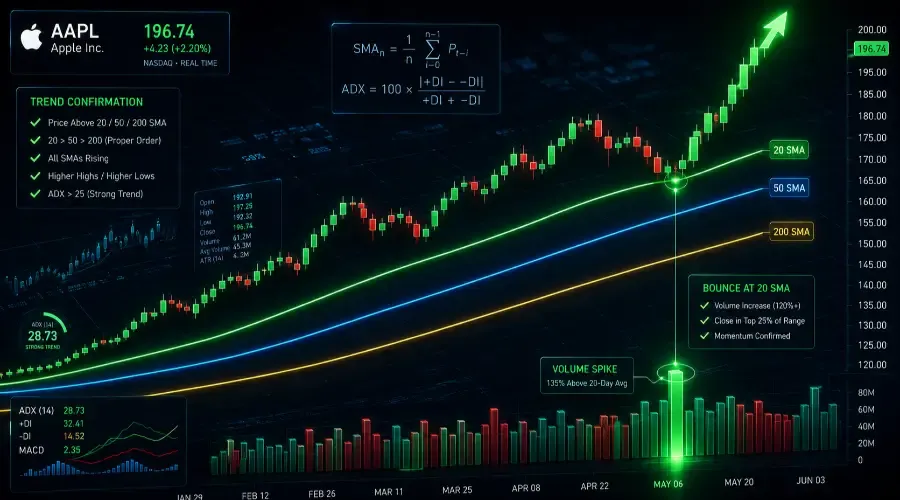
Price above 20-day SMA, 50-day SMA, and 200-day SMA
-
All three SMAs in order: 20 above 50, 50 above 200
-
All three rising
-
ADX above 25 (trend is strong, not choppy)
-
Stock forming higher highs and higher lows
ADX below 20 means the trend is too weak to generate reliable pullback bounces. In choppy conditions with ADX below 20, Hub 1 (Momentum Reversal) is more appropriate.
Phase 3: Healthy pullback
Price retraces from a recent high toward the 20-day SMA. Characteristics of a healthy pullback:
-
Decline of 3-8% from the recent high (not more than 15%)
-
Volume decreases during the pullback (below 100% of 20-day average)
-
Price holds at or near the 20-day SMA without closing significantly below it
-
Pullback takes 2-5 days (not one session, not more than a week)
Volume during the pullback is the critical filter. Rising volume during a decline indicates active selling pressure, not normal profit-taking. If volume increases as price falls toward the 20-day SMA, the pullback may be deepening into a reversal. Exit candidates on the watchlist; don't enter.
Phase 4: Bounce entry
The bounce candle is the entry trigger:
-
Price bounces from the 20-day SMA
-
Volume increases on the bounce day (120%+ of 20-day average, 200%+ preferred)
-
Candle closes in the top 25% of its intraday range
-
At least one momentum indicator is positive: MACD above signal line, ADX still rising, or Supertrend still green
Entry execution: market-on-open order placed the evening before, after the bounce candle has closed. This avoids intraday execution complexity and ensures the R:R calculation is based on a known price. Advanced traders monitoring intraday can enter at the close of the bounce candle for a slightly better price, but the next morning's open is the standard approach and the basis for the backtest entries.
Why Trend Following Produces the Highest Win Rates
Trends are self-reinforcing. A stock above all three rising moving averages has buyers consistently outpacing sellers at every timeframe. Each pullback gets absorbed by the same institutional buyers who drove the trend. The mechanical condition of higher highs and higher lows means the structure of the move confirms itself at each cycle.
The 20-50-200 SMA stack filters aggressively. Requiring all three moving averages to be in order (20 above 50, 50 above 200) and rising simultaneously eliminates the majority of low-quality setups. Most stocks most of the time don't meet all three conditions simultaneously. The ones that do are in genuine structural uptrends, not temporary bounces in downtrends.
Volume pattern distinguishes pullbacks from reversals. A pullback on declining volume indicates sellers are not motivated: the most aggressive sellers have already exited and what remains is ordinary profit-taking. The volume increase on the bounce candle represents institutional buyers re-entering at a lower price. Two sequential volume signals (low on decline, high on bounce) provide independent confirmation that the pattern is real.
Longer holds produce larger average winners. Trend following positions run 4-6 days on average versus 2-4 days for momentum reversal. The additional hold time allows the trend's momentum to compound, which produces larger average winners at comparable average loser sizes. Over 100 trades, this difference is meaningful.
Bull markets provide consistent setup supply. In confirmed bull markets with SPY above the 200-day MA, most large-cap stocks produce 3-5 pullback setups per month each. A watchlist of 10-15 stocks in confirmed uptrends generates more setups than most traders can action simultaneously.
PART 2: MARKET CONDITIONS
Identifying the Right Regime Objectively
Trend following is explicitly regime-dependent. Using it in the wrong market conditions is the primary source of losses for traders who learn the system in a bull market and then continue applying it when conditions change.
Hub 2 is active when:
-
SPY is more than 3% above the 200-day MA
-
SPY ADX is above 25 and rising
-
The majority of S&P 500 stocks are above their own 50-day SMA
Switch to Hub 1 (Momentum Reversal) when:
-
SPY is oscillating within 3% of the 200-day MA
-
SPY ADX is below 25 (sideways, no dominant direction)
-
Individual stock pullbacks are failing to bounce consistently
Reduce all position sizes by 50% or stop trading Hub 2 when:
-
SPY closes below the 200-day MA for two consecutive days
-
VIX exceeds 30 (extreme volatility compresses R:R ratios)
-
More than 3 consecutive Hub 2 setups have been stopped out in the past 2 weeks
Bear market rule (SPY below 200-day MA): Don't apply trend following in either direction. Counter-trend bounces in bear markets look identical to genuine pullback setups on the daily chart but fail at a 50-65% rate. Hub 5 (Mean Reversion) and reduced position sizing are more appropriate until SPY reclaims the 200-day MA on a closing basis.
Where Trend Following Works
Confirmed bull markets with SPY above the 200-day MA produce the 68% win rate figures in this hub. When the broader market is trending, individual stocks trend with it, and the pullback frequency and bounce reliability both increase.
Individual stocks in strong sector uptrends. A stock in the leading sector of a bull market (the highest relative strength sector versus SPY) adds a tailwind that increases the probability of pullbacks bouncing rather than extending.
Stocks making new 52-week highs. A stock at a 52-week high by definition has no overhead resistance from prior sellers. Pullbacks from 52-week highs into the 20-day SMA have fewer structural obstacles to the bounce.
Where It Fails
Bear markets. Win rate drops from 68% to 35-45%. The mechanism that makes trend following work (institutional buyers defending the 20-day SMA) disappears when the broader market is in a downtrend. Institutions reduce exposure in bear markets; they don't accumulate on dips.
Choppy or sideways markets. Without a clear directional trend, pullbacks to the 20-day SMA don't bounce reliably because there's no trend to resume. The 20-day SMA itself is flat rather than rising, which removes its structural significance.
Before earnings. Earnings announcements within 2 days of entry introduce gap risk that can stop out a valid technical setup on information unrelated to the trend. The MSFT stopped-out example in Part 5 illustrates this with an unexpected Fed commentary gap rather than earnings; any scheduled binary event carries the same risk.
Consolidation phases. When a stock's moving averages are flat and price is oscillating within a range, pullbacks to the 20-day SMA have no directional bias. Wait for the consolidation to resolve into a breakout (Hub 3) before applying trend following.
PART 3: THE 14 STRATEGIES
All 14 systems share the same four-phase structure. The momentum confirmation indicator and entry timing vary; the underlying trend + pullback logic does not.
Note on numbering: Strategy numbers reflect position in the full 50-strategy catalog across all five hubs. Gaps in the sequence indicate strategies removed for sub-50% win rates. Note on sample sizes: Each strategy's full backtest covers a minimum of 80 trades on S&P 500 stocks in bull market conditions, 2020-2024. Strategies 13 and 50 have the largest samples (130+ and 110+ trades respectively).
Hub summary: Average win rate 60% (highest of all five hubs) | Average profit factor 2.1 | Hold period 4-6 days
Tier 1 (start here): Strategies 13, 23, 49, 50 – win rates 60-68%, profit factors 2.2-2.4
Tier 2 (add after mastering one Tier 1): Strategies 14, 15, 16, 18, 19, 21 – win rates 58-62%
Tier 3 (specific conditions): Strategies 17, 20, 22, 24 – win rates 52-58%
Hub 2 produces its best results when the market regime filter is applied first. Strategy 13's overall 68% win rate is the average across all conditions in the backtest period. In choppy markets (SPY ADX below 25), the same strategy produces approximately 48-52% – barely above the break-even threshold for a 2:1 R:R system. The regime filter isn't optional; it's where the edge lives.
PART 4: COMPLETE STRATEGY BREAKDOWN – STRATEGY 13 (TRIPLE MA POWERHOUSE)
Strategy 13 carries the highest win rate in this hub (68%) and the simplest entry logic: buy the pullback to the 20-day SMA when the 20-50-200 stack is confirmed and volume increases on the bounce. It's the recommended starting strategy for most traders in this hub.
Overview
Strategy name: Triple MA Powerhouse
Hub: 2: Trend Following
Entry type: Trend + Pullback (Pillar 2)
Backtested win rate: 68% (S&P 500 stocks, 2020-2024, bull market conditions, pre-commission)
Profit factor: 2.4
Average winner: +5.2%
Average loser: -2.1%
Best holding period: 5 days (range 3-8)
Best market condition: Bull markets with SPY above the 200-day MA
Tier: 1
━━━━━━━━━━━━━━━━━━━━━━━━━━━━━━━━━━━━━━━━━━━━━━━━━━━
STRATEGY 13: TRIPLE MA POWERHOUSE – BACKTEST RESULTS
S&P 500 stocks | 130+ trades | Bull market conditions
━━━━━━━━━━━━━━━━━━━━━━━━━━━━━━━━━━━━━━━━━━━━━━━━━━━
Win Rate 68% Profit Factor 2.4
Avg Winner +5.2% Avg Loser -2.1%
Max Drawdown -8.5% Sharpe Ratio 1.9
━━━━━━━━━━━━━━━━━━━━━━━━━━━━━━━━━━━━━━━━━━━━━━━━━━━
Win rate by year:
2020: 62% | 2021: 70% | 2022: 58%
2023: 72% | 2024 YTD: 66%
━━━━━━━━━━━━━━━━━━━━━━━━━━━━━━━━━━━━━━━━━━━━━━━━━━━
Win rate by market regime:
Bull market (SPY above 200-day MA): 68%
Choppy (SPY within 3% of 200-day MA): 51%
Bear market (SPY below 200-day MA): 38%
━━━━━━━━━━━━━━━━━━━━━━━━━━━━━━━━━━━━━━━━━━━━━━━━━━━
Walk-forward: In-sample 68% | Out-of-sample 66%
━━━━━━━━━━━━━━━━━━━━━━━━━━━━━━━━━━━━━━━━━━━━━━━━━━━
Pre-commission, pre-slippage. Expect 64-67% win
rate and 2.1-2.3 profit factor in live conditions.
━━━━━━━━━━━━━━━━━━━━━━━━━━━━━━━━━━━━━━━━━━━━━━━━━━━
The regime breakdown is the most important data in this table. The 38% bear market figure confirms what the regime filter section states: trading this system in a bear market produces results below the break-even threshold for a 2:1 R:R setup (33.3%). The 68% figure is real, but it is conditional on market regime.
How Strategy 13 Works
The 20-50-200 SMA stack is the primary filter. When all three moving averages are in the correct order (20 above 50, 50 above 200) and all three are rising simultaneously, the stock is in a structurally confirmed uptrend across short, intermediate, and long-term timeframes. Most stocks most of the time don't meet this condition, which is exactly why the filter works. The stocks that do are in genuine institutional-supported trends, not temporary bounces.
ADX above 25 is the secondary filter. It confirms the trend's momentum is strong enough to generate reliable pullback bounces. In weak or choppy conditions (ADX below 20), even properly stacked moving averages produce false signals.
The higher highs and higher lows (HH/HL) pattern is the visual confirmation that the mechanical conditions reflect a real trend, not a coincidental alignment of averages.
Pre-Entry Checklist
Copy this checklist into your trading log before each entry. Every condition must be confirmed.
STRATEGY 13: TRIPLE MA POWERHOUSE – PRE-ENTRY CHECKLIST
━━━━━━━━━━━━━━━━━━━━━━━━━━━━━━━━━━━━━━━━━━━━━━━━━━━━━━
MARKET REGIME (confirm before anything else)
[ ] SPY above 200-day MA by more than 3%
[ ] SPY ADX above 25 and rising
[ ] This is a bull market regime – Hub 2 is active
WEEKLY TREND (confirm all three)
[ ] Price above 20-week EMA
[ ] 20-week EMA above 50-week EMA
[ ] Both moving averages rising
DAILY TREND (confirm all six)
[ ] Price above 20-day SMA
[ ] 20-day SMA above 50-day SMA
[ ] 50-day SMA above 200-day SMA
[ ] All three SMAs rising
[ ] ADX above 25
[ ] Stock forming higher highs and higher lows
PULLBACK PHASE (confirm all four)
[ ] Price pulled back 3-8% from recent high
[ ] Volume during pullback: below 100% of 20-day average
[ ] Price held at or near 20-day SMA (no significant close below)
[ ] Pullback took 2-5 days
BOUNCE ENTRY (confirm all four)
[ ] Price bounced from 20-day SMA
[ ] Volume on bounce day: 120%+ of 20-day average (200%+ preferred)
[ ] Bounce candle closed in top 25% of its range
[ ] MACD above signal line OR ADX still rising OR Supertrend green
POSITION SIZING
[ ] Account size: $25,000 minimum recommended
[ ] Risk = 1% of account per trade
[ ] Stop = below 20-day SMA minus 0.5 × ATR
[ ] Target = Entry + (2 × risk distance)
[ ] R:R confirmed at 2:1 minimum
[ ] If stop distance exceeds 5% of entry price, skip setup (R:R breaks down)
[ ] Total concurrent positions: 3 maximum
[ ] Sector check: no more than 2 open positions in same sector simultaneously
EXECUTION
[ ] Economic calendar: no earnings within 2 days
[ ] Broad market events: no Fed meeting, CPI, or NFP within 1 day
[ ] Entry method: market-on-open order placed evening before (default)
OR close of bounce candle if monitoring intraday (advanced)
[ ] Stop-market order placed immediately at entry
[ ] Profit target limit order placed same session as entry
━━━━━━━━━━━━━━━━━━━━━━━━━━━━━━━━━━━━━━━━━━━━━━━━━━━━━━
All boxes checked? Enter. Any box unchecked? Wait.
━━━━━━━━━━━━━━━━━━━━━━━━━━━━━━━━━━━━━━━━━━━━━━━━━━━━━━
Exit Rules
Primary exit: 2:1 R:R target placed as a limit order at entry. Mechanical, no discretion required.
Secondary exit: ADX falls below 20, or price closes below the 20-day SMA on a daily basis. Either condition indicates the trend has weakened below the threshold that generates reliable bounce continuations. Exit regardless of whether the target has been reached.
Time exit: After 6 days if neither the target nor the secondary exit has triggered. Trend following momentum compounds in the first 4-6 days; holding longer introduces diminishing returns as the next pullback cycle begins.
Stop loss: Below the 20-day SMA minus 0.5 × ATR. Example: 20-day SMA at $172, ATR at $4, stop placed at $170. If this produces a stop distance greater than 5% of entry price, R:R falls below 2:1 and the setup should be skipped. Placed as a stop-market order immediately at entry. Never moved further from entry once placed.
PART 5: REAL TRADE EXAMPLES – STRATEGY 13
Winning Trade: AAPL, April 2024
Market context: SPY above the 200-day MA in a confirmed bull market. AAPL in a clean weekly and daily uptrend.
Weekly trend confirmed (April 5):
AAPL price $175 vs 20-week EMA $162 and 50-week EMA $148
Both EMAs rising, price well above both
Daily trend confirmed (April 5):
20-day SMA: $172, 50-day SMA: $165, 200-day SMA: $152
All three in correct order and rising
ADX: 28 (above 25 threshold)
HH/HL pattern: confirmed on daily chart
Pullback phase (April 5-8):
AAPL pulled back from $176 to $171 (2.8% decline)
Volume averaged 92% of the 20-day average throughout (below average, healthy)
Price briefly pierced the 20-day SMA at $172 to $171 but recovered the following session
Pullback took 3 days
Bounce signal (April 9):
Price bounced from $171 to $173
Volume: 135% of 20-day average (above 120% threshold)
Candle closed at $172.50, near the high of the day's range
MACD above signal line, ADX at 26 and rising
Trade execution:
Entry: $172.85 (Market-on-Open fill on April 10, accounting for a minor $0.35 morning gap-up from the previous day's close of $172.50)
Stop: $168 (below 20-day SMA at $172 minus 0.5 × ATR $4)
Risk per share: $4.85
Target: $181.50 (2:1 R:R)
Position size: $100 ÷ $4.85 = 20 shares (rounded down from 20.6)
Trade progression:
Result with transaction costs:
The MOO fill was $0.35 above the previous day's close—a typical gap-up in a strong bull market. This reduced the gross profit from the idealized $198 (using the close) to $173, a reduction of 12.6%, well within the backtest's expected 5-15% slippage range.
Why this setup worked:
-
Weekly and daily trend both confirmed before entry
-
Pullback volume below average (profit-taking, not selling pressure)
-
Bounce candle showed volume above 120% and closed near the high
-
Market regime: SPY above 200-day MA throughout the hold period
-
No earnings or scheduled events during the 5-day hold
Stopped-Out Trade: MSFT, May 2024
Setup appearance: Technically complete on all checklist conditions.
MSFT weekly trend confirmed: all SMAs above and rising
MSFT daily trend confirmed: 20-50-200 stacked, ADX 31, HH/HL pattern intact
Pullback: 2.1% from high, held above 20-day SMA
Bounce volume: 125% of average
Entry triggered May 10
Trade execution:
Entry: $425 (May 10)
Stop: $420 (below 20-day SMA at $423 minus 0.5 × ATR)
Risk per share: $5
Target: $435 (2:1 R:R)
Position: 20 shares ($100 ÷ $5)
What happened:
Result:
Planned risk: $5 per share ($100 total)
Actual fill: $419 (gapped through the $420 stop level)
Actual loss per share: $6
Total loss: 20 shares × $6 = $120
Commission and slippage: $3 additional
Net loss: $123 (23% above the planned 1% risk)
Why this trade failed:
The technical setup was complete. The failure came from an unscheduled Fed official comment before the market open that caused a gap down through the stop level. A gap-through means the stop executes at the next available price after the open, not at the stop price itself: in this case $419 instead of $420. The economic calendar didn't flag this as a scheduled event because Fed officials occasionally comment between formal meetings.
The critical point is not that the system failed. A 68% win rate means 32% of trades lose. This trade was a legitimate system loss: the 1% position sizing rule ensured the loss ($123, or 1.23% of a $10,000 account) was manageable. At 3% position sizing, the same trade would have produced a $369 loss or 3.7% drawdown on a single trade.
Specific calendar rules that apply to this situation:
-
No trades 2 days before earnings (stock-specific)
-
No trades the day before Fed meetings (scheduled)
-
Reduce position size to 50% only during major, high-impact macro weeks (e.g., formal FOMC rate decision weeks or the annual Jackson Hole Symposium). Routine regional Fed speeches do not warrant size reduction.
-
Accept that unscheduled commentary creates gap risk that no checklist fully eliminates. Position sizing is the last line of defense
PART 6: IDENTIFYING SETUPS – STEP BY STEP
Step 1: Build and Filter the Watchlist
Screen for stocks meeting all of the following:
-
S&P 500 constituent (liquidity and institutional participation)
-
Price above 20-day SMA, 50-day SMA, and 200-day SMA simultaneously
-
All three SMAs rising
-
ADX above 25 on the daily chart
-
Average daily volume above 1 million shares
Run this screen in the evening after market close. Most screening tools (Finviz, TradingView, TC2000) support all five filters simultaneously. A typical bull market screen produces 40-80 qualifying stocks.
Step 2: Identify Pullback Candidates
From the watchlist, identify stocks currently pulling back:
-
Price is below the recent 5-day high by 3-8%
-
Price is approaching or at the 20-day SMA
-
Volume during the pullback has been below the 20-day average
Stocks where volume is still elevated during the pullback go back on the watchlist: the pullback hasn't completed.
Step 3: Check the Bounce Candle
For each pullback candidate, check whether a bounce candle has formed today:
-
Did price bounce off the 20-day SMA?
-
Did volume increase (above 120% of average)?
-
Did the candle close in the top 25% of its range?
If yes, this is a valid entry signal. If the candle is still forming (intraday), wait for the close before placing the order.
Step 4: Calculate Position Size and Set Orders
For each valid signal:
Entry: next morning's market-on-open order
Stop: 20-day SMA minus 0.5 × ATR
Risk: 1% of account in dollar terms
Shares: dollar risk ÷ risk per share (round down)
Target: entry plus 2 × risk distance
Check that risk per share produces a stop no more than 5% from the entry price. If the stop distance is wider than 5%, R:R breaks down and the setup should be skipped.
Place stop-market order and profit target limit order before the next session opens.
PART 7: INDICATORS EXPLAINED
SMA (Simple Moving Average)
Arithmetic average of the last N closing prices, with equal weight to each period. The three-SMA stack (20, 50, 200) used in Strategy 13 measures short-term, intermediate, and long-term trend direction simultaneously. When all three are in order and rising, every active timeframe is pointing in the same direction – the strongest possible trend confirmation available from moving averages alone.
EMA (Exponential Moving Average)
Moving average that weights recent closes more heavily than older ones. More responsive than SMA to recent price changes. Strategy 23 uses eight EMAs (the ribbon), where a steep upward slope across all eight simultaneously indicates strong trend momentum. The ribbon's visual clarity makes it useful for traders who prefer a single-glance trend confirmation.
HMA (Hull Moving Average)
Weighted moving average that reduces lag relative to SMA and EMA by incorporating a weighted moving average of the difference between fast and slow WMAs. Strategy 24 uses HMA crossovers (20-period above 50-period) as its trend confirmation, firing signals earlier than equivalent SMA crossovers.
ADX (Average Directional Index)
Measures trend strength on a 0-100 scale without indicating direction. Above 25: strong trend, trend following works. 20-25: borderline, use caution. Below 20: weak or absent trend, switch to Hub 1. ADX above 25 is a required condition for every strategy in this hub – it's the filter that separates genuine trends from choppy SMA alignments.
MACD (Moving Average Convergence Divergence)
The difference between a 12-period and 26-period EMA, compared to a 9-period signal line. MACD above its signal line indicates short-term momentum is accelerating relative to intermediate momentum – confirmation that the bounce has buying conviction behind it. Used as the primary momentum confirmation in Strategy 13.
Supertrend
ATR-based trend indicator that places a support/resistance line above or below price based on the current trend direction. In uptrends, the green Supertrend line acts as a dynamic trailing support. Strategy 15 uses the Supertrend line as both the structural support level for the pullback and the trailing stop for the exit.
Parabolic SAR (Stop and Reverse)
Places a dot above or below price that moves progressively closer to price as the trend matures. When price crosses the SAR, the indicator reverses. Strategy 14 uses SAR below price as uptrend confirmation and SAR crossing above price as the exit signal: a built-in trailing stop mechanism.
Ichimoku Cloud
Five-component Japanese charting system providing trend direction (Tenkan and Kijun line relationship), future support/resistance (the Cloud), and momentum confirmation (Chikou line position relative to prior price). Strategy 16 requires all five components in a bullish configuration simultaneously: the most conditions of any strategy in this hub, which is why it produces fewer signals but with high structural confirmation.
Donchian Channel
Plots the 20-period highest high and lowest low. A new 20-day high closing above the upper channel on above-average volume is the entry signal in Strategy 19 and the primary filter in Strategy 49. The channel's mechanical nature (no curve-fitting, purely based on observed high/low range) makes it useful as an objective breakout confirmation.
Aroon
Two-line indicator measuring how recently the 25-period high and low have occurred. Aroon Up above 70 indicates a new high within the last 7 of 25 periods: trend momentum is recent and strong. Strategy 17 uses Aroon Up crossing above Aroon Down as its trend confirmation, in place of ADX.
VWAP (Volume Weighted Average Price)
Session's average price weighted by volume. Institutions benchmark execution against VWAP – price trading above VWAP indicates net buying for the session. Strategy 15 uses VWAP as a secondary trend filter alongside Supertrend, requiring price to be above VWAP on the bounce day.
Keltner Channel
ATR-based bands around an EMA. When price rises above the upper Keltner Channel band on expanding ATR, it indicates both directional momentum and volatility expansion: the combination Strategy 21 uses as its entry confirmation for trend continuation.
PART 8: COMMON ERRORS
Trading in bear markets
Win rate drops from 68% to 35-45% when SPY is below the 200-day MA. This is the single largest source of losses for traders who learn trend following in a bull market and continue applying it after market conditions change. The regime filter is the first box on the checklist for a reason.
Ignoring ADX
Moving averages can be properly stacked in a choppy market where price oscillates without consistent direction. ADX below 20 in a properly stacked moving average environment produces pullbacks that don't bounce reliably. ADX above 25 is required; below 20 is a skip condition regardless of the moving average picture.
Entering mid-pullback
Buying before the bounce candle has formed means entering while the stock is still falling. The bounce candle is the evidence that buyers have entered at that level, not that they might enter. Missing the bounce candle and entering the next session at a higher price produces worse R:R; missing it entirely and waiting for the next setup is the correct response.
Holding past the exit signals
Trend following produces profits in the first 4-6 days of a trade. When ADX falls below 20 or price closes below the 20-day SMA, the mechanical exit condition has been met. Holding past these signals hoping for recovery turns systematic trades into discretionary ones and gives back the system's expected return.
Not accounting for gap-through risk in position sizing
The MSFT stopped-out example shows a planned $100 loss becoming $123 due to gap-through execution. This 23% overrun is within the range of what gap-through risk produces (typically 10-30% above planned risk). Position sizing at 1% of account means a 30% overrun produces a 1.3% account loss, which is manageable. At 5% account risk, the same overrun produces a 6.5% loss from a single trade.
Concurrent position correlation
Five simultaneous Hub 2 positions in semiconductor stocks all get stopped out when a sector-level event (export restrictions, earnings miss from a bellwether) moves the group simultaneously. The maximum 3-position and maximum 2-per-sector rules in the checklist address this directly. Apply them.
Overbroad Fed speaker rule
The original advice to reduce size on "any week with a Fed speaker slate" would keep you at half-capacity almost every week of the year. Restrict this rule to high-impact macro events: formal FOMC rate decision weeks and the annual Jackson Hole Symposium. Routine regional Fed speeches do not warrant size reduction.
PART 9: STRATEGY SELECTION
Decision Framework
For highest win rate:
Strategy 13 (Triple MA Powerhouse) – 68% win rate, 5-day holds, simplest entry rules. Recommended for most traders starting with this hub.
For visual trend confirmation:
Strategy 23 (EMA Ribbon Alignment) – 64% win rate, 5-day holds. The eight-EMA ribbon provides a single-glance trend confirmation; when all eight EMAs are stacked with a steep slope, the setup is valid. Fewer condition checks required; strong visual clarity.
For multi-timeframe alignment:
Strategy 50 (Monthly Golden Cross) – 66% win rate, 6-day holds. The monthly 50/200 SMA crossover requirement means this strategy only fires when the dominant long-term trend has definitively shifted bullish. Fewer setups per year, but each carries the highest structural confirmation of any strategy in the hub.
For institutional volume confirmation:
Strategy 15 (Supertrend Momentum) – 62% win rate, 4-day holds. The Supertrend line provides a mechanically precise support level that updates daily, eliminating the judgment calls involved in identifying prior support levels. Combined with VWAP as a session-level confirmation filter.
For longer holds with additional trend filter:
Strategy 49 (Donchian + ADX Combo) – 60% win rate, 6-day holds. The Donchian 20-day high breakout requirement adds a momentum dimension to the standard pullback setup. Only fires when the stock is simultaneously pulling back and setting new 20-day highs at the pullback low – a structurally strong condition.
Why Strategy 13 Is Recommended First
Strategy 1 (TSI + TRIX Wave in Hub 1) has a higher profit factor than Strategy 13 (2.3 vs 2.2) despite a lower win rate (62% vs 65%). The comparison between Strategy 13 and Strategy 23 is similar: 23 has a lower win rate (64% vs 68%) but comparable profit factor (2.3 vs 2.4).
Strategy 13 is recommended first not because it's definitively superior to all alternatives, but because its entry rules are the most unambiguous. The 20-50-200 SMA stack either exists or it doesn't – there's no interpretation required. ADX above 25 is a single number. Higher highs and higher lows are mechanical conditions. For a trader building their first systematic process, the absence of judgment calls in the entry criteria produces more consistent execution, which produces a more interpretable trading record.
Recommended Starting Path
Start with Strategy 13. Paper trade 20 setups with the complete pre-entry checklist, in bull market conditions with the regime filter applied first. Track entry date, exit date, entry price, exit price, and outcome. If win rate after 20 paper trades is above 60%, move to live trading at 25% of calculated position size for the first 3 months.
Add a second strategy after 100+ live trades on Strategy 13. Strategy 23 is the natural second strategy – it uses different entry signals (EMA ribbon vs SMA stack) and fires on different setups, providing additional opportunities without high correlation to Strategy 13's signals.
NEXT STEPS
Continue to the volatility breakout guide for 6 systems that target post-consolidation squeeze conditions where Bollinger Bands compress inside Keltner Channels before expanding. Fewer setups per month than trend following but the highest profit factor in the catalog when the squeeze is correctly identified.
Volatility Breakout Strategies: The Complete Guide to Trading Explosive Moves
www.breakoutbulletin.com/article/volatility-breakout-strategies-hub-3-guide
Or return to the full strategy catalog to compare all 46 systems.
Algorithmic Trading Systems Library: 46 Quant-Based Backtested Systems for Any Market Regime
www.breakoutbulletin.com/article/rules-based-stock-trading-strategies-library
Related Guides
How to Build a Profitable Trading System From Scratch: The Complete Rules-Based Guide
www.breakoutbulletin.com/article/how-to-build-profitable-trading-system
The position sizing rules, 19-point confluence framework, and backtesting standards all 14 strategies in this guide are built on.
Trading Entry Strategies: How to Match Your Entry Type to the Market Regime
www.breakoutbulletin.com/article/trading-entry-strategies-guide
The Trend + Pullback entry type explained in full.
Market Regime Has Shifted? Read One of These
Market turned choppy or sideways:
Momentum Reversal Strategies: How to Catch Sharp Oversold Bounces (Without Catching Falling Knives)
www.breakoutbulletin.com/article/momentum-reversal-strategies-oversold-bounces
Stock forming a volatility squeeze:
Volatility Breakout Strategies: The Complete Guide to Trading Explosive Moves
www.breakoutbulletin.com/article/volatility-breakout-strategies-hub-3-guide
Adding volume confirmation to trend entries:
8 Rules-Based Volume Trading Strategies for Tracking Institutional Flows
www.breakoutbulletin.com/article/rules-based-volume-trading-strategies
Market turned bearish, looking for short-duration bounces:
Mean Reversion Quick-Start Guide: The 5 Rules for Trading Oversold Bounces
www.breakoutbulletin.com/article/mean-reversion-quick-start-guide
LEGAL DISCLAIMER
This guide is provided for educational purposes only. It is not financial advice or investment recommendations. All statistics are from hypothetical backtests and do not reflect actual trading results. Past performance does not guarantee future results. Win rates in bear markets are significantly lower than the bull market figures shown (35-50% vs 68%). Trading involves substantial risk of loss. Actual results will differ from backtests due to slippage, commissions, gaps, and market conditions. Consult a licensed financial advisor before trading.