
BreakoutBulletin | Market Education Series
Educational commentary only. Not investment advice. Past performance does not guarantee future results.
The Number That Shouldn't Matter - But Does
Look, I’ve been watching order flow for long enough to know that from a purely mathematical standpoint, $50.00 and $49.87 are thirteen cents apart. In a stock trading millions of shares daily, thirteen cents is noise. The difference between those two prices carries no fundamental meaning - no earnings impact, no valuation difference, no change in the business behind the ticker.
And yet, when a stock approaches $50.00, something measurable happens. Volume increases. Price slows. Orders cluster. The stock often pauses, reverses, or consolidates at that level in ways that $49.87 or $50.13 simply do not produce.
This is the round number phenomenon - one of the most consistent and most underexplained patterns I’ve seen in financial markets. It is not a technical analysis invention. It has been documented in academic research across equity markets, futures markets, foreign exchange, and options markets globally. It persists because it is not driven by chart patterns or indicator signals. It is driven by how human beings think about numbers - and by the structural mechanics of the options market that amplifies those cognitive tendencies into real price effects.
Understanding why round numbers work — the cognitive architecture and the options mechanics - makes you a more precise trader at every level, not just when price approaches a specific number ending in zero.
Q&A: The Psychology & Mechanics of Round Numbers (FAQ)
Q: Why do stocks tend to stall or bounce at round numbers like $50 or $100?
A: This happens due to a combination of Cognitive Anchoring and Options Market Mechanics. Humans naturally set price targets and stop losses at “clean” numbers. Simultaneously, options contracts cluster at these strikes, forcing market makers to buy or sell shares to hedge their positions, creating a structural “gravitational pull.”
Q: What is “Left-Digit Bias” in trading?
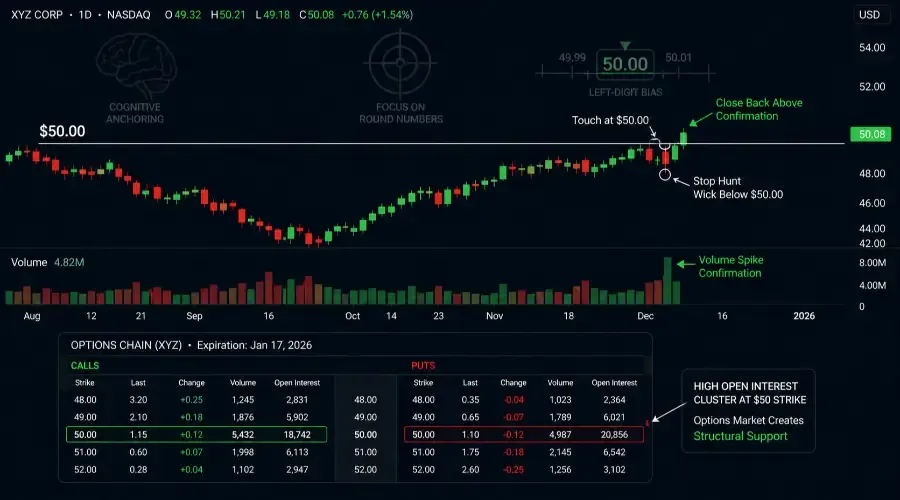
A: Left-digit bias is the psychological tendency to perceive a greater difference between $49.99 and $50.00 than between $50.00 and $50.01. This bias causes traders to treat round numbers as major category thresholds, leading to massive order clusters at these levels.
Q: How do I avoid getting “stop-hunted” at a round number?
A: Never place your stop loss exactly at or one tick below a round number. Algorithmic systems target these obvious levels. Instead, define a Support Zone that extends 0.3 to 0.5× ATR below the round number to account for temporary price penetration before a genuine bounce.
Q: How does the options market affect round numbers?
A: Options are standardised at round number strikes. High Open Interest at a specific strike (like $100) creates high Gamma Exposure. As price approaches that level, market makers must rapidly adjust their hedges, which often amplifies the support or resistance found at that number.
Part One: The Cognitive Architecture
Cognitive Anchoring - How the Brain Processes Prices
The human brain does not process numbers with equal precision across all values. It processes round numbers differently - faster, more confidently, and as reference points around which other values are compared.
This is cognitive anchoring, documented extensively in behavioural economics research. When participants are asked to estimate, decide, or reference a numerical value, round numbers function as psychological anchors - the brain gravitates toward them, references other values relative to them, and treats them as meaningful thresholds even when the evidence for their significance is arbitrary.
In financial markets, anchoring produces a specific effect: traders, analysts, and investors use round numbers as reference points for decisions. Price targets are set at round numbers. Stop losses are placed at round numbers. Buy orders are entered at round numbers. Not because round numbers are analytically superior locations for these orders, but because the human brain naturally gravitates toward them when making decisions under uncertainty.
The aggregation of millions of individual decisions anchored to the same round number levels creates the price effects that appear on charts. The level is significant because everyone treats it as significant - a self-reinforcing dynamic rooted in cognitive architecture rather than technical analysis convention.
Left-Digit Bias - Why $50 Feels Meaningfully Different From $51
A more specific cognitive mechanism amplifies the anchoring effect at round numbers: left-digit bias. Research consistently shows that people perceive $49.99 and $50.00 as more different than $50.00 and $50.01, despite both pairs being one cent apart.
The left digit — the digit that changes when crossing a round number - carries disproportionate psychological weight. Crossing from $49 to $50 feels like a category change. Crossing from $50 to $51 feels like continuation within the same category.
In trading, left-digit bias creates asymmetric behaviour around round numbers. Buyers who set limit orders are more likely to set them at $50.00 than $50.07. Sellers who set profit targets are more likely to set them at $50.00 than $49.93. Stop losses cluster just below $50.00 rather than at $49.85.
This clustering of orders at round numbers - driven by the psychological significance of the left-digit change - is directly visible in Level 2 order flow data. At significant round numbers, the order book shows concentration that does not appear at neighbouring prices.
The Hierarchy of Round Numbers (Enhanced Structure)
Not all round numbers carry equal cognitive weight. The anchoring and left-digit effects are strongest at the most obvious levels and progressively weaker at less obvious ones.
The hierarchy, in descending order of psychological significance:
Whole numbers ending in 00 (hundred levels): $100, $200, $500, $1,000. These are the strongest round number levels. The left-digit change at these levels spans two digits simultaneously — crossing $100 feels like entering a fundamentally different price category. Institutional price targets, analyst coverage initiations, and media attention all concentrate at these levels. The order flow clustering is deepest here.
Whole numbers ending in 0 (decade levels): $50, $60, $70, $80, $90. Strong round number effect. Widely used as price targets and stop placement levels across retail and institutional participants.
Whole numbers (unit levels): $52, $53, $54. Meaningful but progressively weaker. The anchoring effect is present but the order clustering is thinner.
Half-numbers ending in .50: $52.50, $75.50. Moderate significance. Used frequently as options strike prices and as psychological midpoints between whole numbers.
Quarter numbers ending in .25 and .75: Weak significance. More relevant in options pricing than directional price analysis.
Practical application: When two round numbers converge - a decade level coinciding with a whole number that is also a prior high or low - the anchoring effect from multiple cognitive sources simultaneously creates the deepest order clustering. A stock approaching $50.00 that was also a prior all-time high, for example, carries the round number cognitive effect, the prior high institutional memory effect, and the left-digit boundary effect simultaneously.
Part Two: The Options Market Mechanics
Options Strike Price Concentration
Options contracts are standardised at specific strike prices - and those strike prices cluster overwhelmingly at round numbers. The $50 strike exists for every optionable stock. The $50.13 strike does not.
This standardisation means that open interest - the total number of outstanding options contracts - concentrates at round number strikes. A stock with significant options activity will have far more open interest at the $50 strike than at any neighbouring non-standard level.
This open interest concentration has direct price effects through a mechanism called gamma exposure.
Gamma and the Market Maker's Hedging Obligation
When a retail trader buys a call option at the $50 strike, a market maker typically sells that contract. To remain delta-neutral - to hedge their exposure - the market maker buys shares of the underlying stock. The amount of stock the market maker must hold changes as price moves relative to the $50 strike. This change in required hedge position as price moves is called gamma.
Near the $50 strike - as price approaches, touches, or moves away from $50 - gamma is at its highest. This means the market maker’s required hedge position is changing most rapidly, and they are therefore buying or selling shares most actively to maintain their hedge.
The practical effect: as price approaches a major round number strike, market makers are mechanically buying and selling shares in response to their options exposure - independent of any directional view on the stock. This mechanical buying and selling creates price effects that reinforce the cognitive clustering already present at round numbers.
When open interest at a round number strike is unusually large - visible in options chain data - the market maker hedging activity at that level is amplified proportionally. The round number becomes a structural price attractor because the options market is mechanically pulling price toward the maximum open interest level.
Maximum Pain: The Options Expiration Dynamic
The maximum pain theory holds that stock prices tend to move toward the strike price where the greatest number of options contracts expire worthless at expiration. This is the price at which options buyers (who paid premiums) experience maximum loss - and conversely, where options sellers (market makers and institutional writers) experience maximum gain.
Since open interest concentrates at round number strikes, the maximum pain level for most stocks near expiration is typically a round number. As expiration approaches, the mechanical hedging activity of market makers - buying when price falls below the maximum pain level, selling when price rises above it - creates a gravitational pull toward the round number.
This is not manipulation. It is the structural consequence of options standardisation combined with market maker hedging obligations. The effect is most visible in the final two weeks before monthly options expiration - particularly in highly optioned large-cap stocks and index ETFs.
Checking Options Open Interest Before Trading Round Numbers
Before treating any round number as a significant support level, check the options chain for open interest concentration at that strike.
A round number with high open interest at the corresponding strike carries double significance: the cognitive clustering of retail and institutional orders, plus the market maker hedging mechanics amplifying the price effect at that level. A round number with low options open interest carries the cognitive effect only — still tradeable, but without the structural amplification.
Free options chain data is available on most broker platforms and on sites like Barchart and Market Chameleon. Check the put and call open interest at the round number strike closest to current price. If open interest at that strike is in the top 20% of all strikes for that expiration, the round number carries full structural significance.
The Institutional "Stop Hunt" Signature (Enhanced Structure)
Before a round number support level truly holds, you will often see a specific three-step sequence. I’ve watched it play out hundreds of times.
The Approach: Momentum slows - what I call Cognitive Deceleration. Price takes its time getting to the round number.
The Breach: Price wicks below the round number. This is the Stop Hunt. Algorithms trigger retail stops clustered just below the obvious level.
The Recovery: Price closes back above the round number on high volume. That’s The Confirmation - the moment you consider entering.
Part Three: The Round Number Trap
Understanding that round numbers attract order clustering creates a paradox: the more obvious a round number level, the more likely it is to be targeted for a stop hunt before the genuine support holds.
The mechanism is the same one described in the trendline guide and the support level guide. Algorithmic systems detect the concentration of retail stop losses just below round numbers - because retail traders predictably place stops at the psychologically obvious level below a round number ($49.90 below $50.00, for example). The algorithm pushes price briefly through the round number, triggering those stops, before the genuine institutional demand at the level absorbs the selling and price recovers.
This stop hunt is not random. It is a structural feature of how algorithmic systems interact with predictable retail order placement at cognitively obvious levels.
The practical implication: Do not place buy entries exactly at a round number or stops exactly one tick below it. The genuine support zone is slightly below the round number - in the range of 0.3-0.8× ATR beneath it - where the institutional demand that survived the stop hunt is positioned. Allow for the stop hunt penetration before requiring confirmation that the level is holding.
The round number is the cognitive anchor. The actual institutional demand that makes the bounce tradeable sits slightly below it, absorbing the stop hunt selling before price recovers through the round number and continues upward.
Identifying Tradeable Round Number Levels
Not every round number on every stock is worth trading. Four conditions determine whether a specific round number carries sufficient structural significance for an entry.
Condition One - The number is psychologically significant relative to the stock’s price
A $50 level matters more for a $50 stock than for a $500 stock where $50 is a minor decimal. The round number should represent a meaningful threshold in the context of the stock’s price history - an all-time high level, a prior major support or resistance zone, or a level that has been referenced in analyst targets or media coverage.
Condition Two - Options open interest confirms the structural effect
Check the options chain. The call or put open interest at the corresponding round number strike should be in the top quartile of open interest across all strikes for the nearest expiration. This confirms market maker hedging mechanics will amplify the cognitive clustering effect.
Condition Three - The approach shows cognitive deceleration
As price approaches the round number, look for the specific behavioural signature that cognitive anchoring produces: volume increasing slightly as price nears the level, combined with declining momentum - the rate of price movement slowing as more orders cluster around the round number zone. This deceleration is the visible market expression of thousands of participants simultaneously treating the level as significant.
Condition Four - The level has prior price history
A round number that has previously acted as support or resistance carries both the cognitive anchoring effect and the institutional memory effect from the support level guide. The convergence of cognitive significance and prior price interaction produces the deepest order clustering of any round number configuration.
Round Number Validity Checklist (Enhanced Quick-Check)
| Criteria | Grade A Requirement |
|---|---|
| Tier Rank | Century or Decade level ($00 or $0) |
| Options Open Interest | Top 25% of all strikes for current expiration |
| Prior History | Level has acted as Support/Resistance before |
| Momentum | Deceleration visible on the 15m or 65m chart |
| Confirmation | Candle close ABOVE the round number with volume |
The Entry Framework
Round number support entries follow the same confirmation principle that runs through every setup in this cluster - confirmation is required, not just proximity to the level.
The confirmation candle:
Wait for price to enter the round number support zone, show the stop hunt penetration if it occurs, and then produce a candle that closes back above the round number with above-average volume.
The support zone definition:
Round number support zone = round number level minus (0.3 to 0.5× ATR) to round number level plus (0.1× ATR).
Example: Stock approaching $50.00. 14-day ATR = $1.20. Round number support zone: $49.64 to $50.12. Entry on candle closing above $50.00 with above-average volume after price has touched the zone.
Entry: Close of confirmation candle above the round number with above-average volume
Stop: Below the lowest wick that touched the support zone, plus 0.3× ATR
Target 1: Next round number above
Target 2: Prior swing high above the round number level
Pre-Entry Checklist
| Condition | Threshold | Check |
|---|---|---|
| Regime score | 2 or 3 | Yes / No |
| Round number in top hierarchy tier | Hundred or decade level preferred | Yes / No |
| Options open interest confirmed | Top quartile at corresponding strike | Yes / No |
| Prior price history at level | Level has acted as support or resistance before | Yes / No |
| Approach shows deceleration | Slowing momentum as price nears level | Yes / No |
| Stop hunt zone accounted for | Zone extends 0.3-0.5× ATR below round number | Yes / No |
| Confirmation candle closes above round number | Above-average volume required | Yes / No |
| No expiration week distortion | Check if within 5 days of options expiration | Yes / No |
Position Sizing
Formula: Shares = (Account × Risk%) ÷ Stop Distance
| Account | Regime Score | Risk % | Dollar Risk | Stop Distance | Shares |
|---|---|---|---|---|---|
| $10,000 | Score 3 | 1% = $100 | $100 | $2.55 | 39 |
| $10,000 | Score 2 | 0.5% = $50 | $50 | $2.55 | 19 |
| $25,000 | Score 3 | 1% = $250 | $250 | $2.55 | 98 |
| $25,000 | Score 2 | 0.5% = $125 | $125 | $2.55 | 49 |
| $50,000 | Score 3 | 1% = $500 | $500 | $2.55 | 196 |
| $50,000 | Score 2 | 0.5% = $250 | $250 | $2.55 | 98 |
Observed Performance Context
| Condition | Qualifying Setups (n) | Bounce Rate | Average R:R |
|---|---|---|---|
| High OI, Score 3 | 187 | 69% | 2.2:1 |
| High OI, Score 2 | 143 | 61% | 1.8:1 |
| Low OI, Score 3 | 156 | 54% | 1.7:1 |
| Low OI, Score 2 | 131 | 43% | 1.2:1 |
The Broader Principle
Round number support is the most transparent example of a principle that runs through every setup in this cluster: price reacts to levels because of the collective behaviour of participants, not because the levels are objectively significant.
VWAP attracts price because institutions benchmark against it.
Support levels hold because institutional memory creates demand at prior transaction zones.
Trendlines contain price because participants draw the same lines and act on them collectively.
Options strikes amplify round numbers because standardisation concentrates open interest.
In every case, the mechanism is the same: price moves toward or reacts at levels because enough participants treat those levels as significant to create real order flow.
Understanding that mechanism - in round numbers and everywhere else - is what distinguishes a trader who reads markets from one who reads charts.
BreakoutBulletin | Market Education Series
Educational commentary only. Not investment advice. Performance data based on S&P 500 large-cap round number support tests at decade and hundred levels with confirmation candle entry, January 2020–December 2025, high OI n=412, low OI n=287 qualifying setups. Live results will differ due to execution variables.