
Most technical education is built around trends. Higher highs, higher lows, momentum, breakouts – the implicit assumption is that the market is always moving somewhere with purpose. The reality is different. Markets spend a surprising amount of time going nowhere. They consolidate, chop, and grind sideways in a range before eventually making a directional decision.
Traders who only know how to read trending markets are perpetually confused during these phases. They see a potential uptrend forming on Monday and a potential downtrend on Wednesday, and the market ends the week exactly where it started. The problem is not the chart – it is the framework being applied to it. That’s where a solid range-bound trading strategy becomes essential.
This post covers sideways market structure: what a range is, how to identify it cleanly, how it behaves differently from trending markets, what typically ends a range, and how to approach it analytically. You’ll learn to recognize support and resistance zones, distinguish a false breakout vs genuine breakout, and understand market equilibrium price action in a way that stops you from getting chopped up. This is the third post in the BreakoutBulletin structure series. The first two posts cover higher highs and higher lows (uptrend structure) and lower highs and lower lows (downtrend structure). Together, these three posts complete the full picture of what a market can structurally be at any given time.
Disclosure: Nothing on this page constitutes a recommendation to take any position in any security.
What Is a Range-Bound Market?
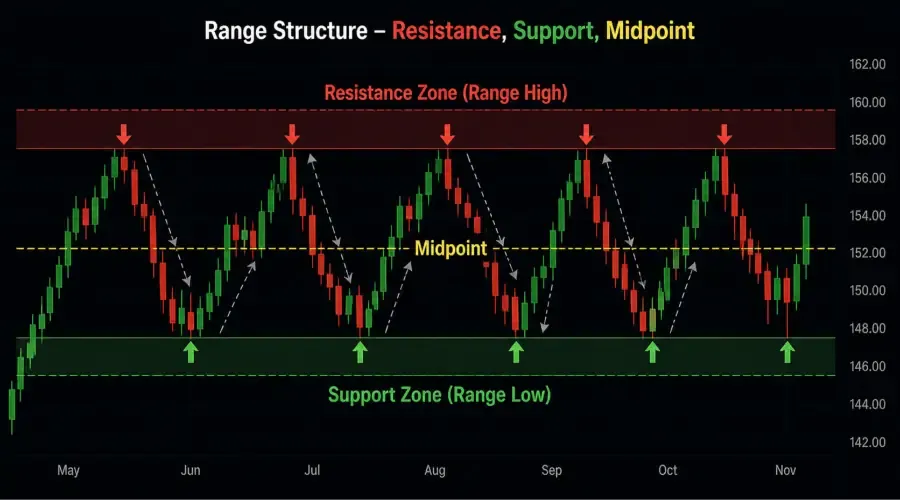
A range-bound market – also called a sideways market, consolidation, or ranging environment – is one in which price oscillates between a relatively consistent upper boundary (resistance) and a lower boundary (support) without making sustained progress in either direction.
In structural terms, a range is characterized by equal highs and equal lows – or more precisely, by the absence of a clear HH/HL or LH/LL sequence. Price reaches a certain level, gets rejected, falls back, finds support at a certain level, and then bounces again. This cycle repeats.
Unlike an uptrend or downtrend, a range does not have a directional bias built into its structure. It is a zone of equilibrium – a tug-of-war between participants on both sides that has not yet been resolved.
Why Ranges Form
Ranges do not form randomly. There are identifiable reasons why price pauses and consolidates rather than continuing in one direction.
After a significant move: Price rarely goes up or down in a straight line indefinitely. After a sharp trend, the market often pauses to "digest" the move – participants who drove the trend lock in gains, new participants assess value at the new price level, and the imbalance that drove the trend temporarily neutralizes. This is sometimes called a consolidation after an impulse move.
At major structural levels: When price reaches a historically significant support or resistance zone, supply and demand dynamics create equilibrium. Enough participants see value or risk at that level to create a natural boundary, and price oscillates around it until something changes.
During low-conviction environments: When there is genuine uncertainty about direction – ahead of major economic data, earnings seasons, or macro events – participants become less aggressive, volume dries up, and price movement narrows. The range in this case reflects indecision rather than a balance of strength.
Understanding why a range has formed helps contextualize how robust it is likely to be and what kind of resolution might follow.
Identifying a Range: The Structural Criteria
Not every sideways move qualifies as a true range. Here is how to distinguish a genuine range from random noise:
Criterion 1: At Least Two Defined Highs and Two Defined Lows
A range needs a minimum of two swing highs at approximately the same level (the resistance zone) and two swing lows at approximately the same level (the support zone). One test of each boundary is not enough to call it a range – price could still be in the pullback phase of a trend.
Criterion 2: Approximate Equality – Not Mathematical Precision
Range highs and lows do not need to be at exactly the same price to the rupee. Markets are not mechanical. What you are looking for is a zone – a band of price where the market has repeatedly reversed. If the swing highs cluster within a ₹10–₹15 band and the swing lows cluster within a similar band, that is a functional range.
Criterion 3: The Range Has Meaningful Width
A range needs to have enough distance between its support and resistance boundaries to be analytically useful. A very tight range – sometimes called compression or a squeeze – is a different structure that often precedes explosive directional moves rather than sustained oscillation.
As a rough reference, most traders consider a range tradable if its width is at least twice the average true range (ATR) of the instrument on that timeframe – or visibly larger than the typical daily noise. Very tight ranges (e.g., 0.5% on a stock) often behave like compression squeezes rather than oscillating ranges.
Criterion 4: Neither HH/HL Nor LH/LL Sequence Is Present
The defining structural characteristic of a range is the absence of sequential directional pattern. If you mark all the swing points and none of them are clearly making progressively higher or lower levels, you are looking at a range.
The Anatomy of a Range
A well-formed range has three components:
1. The Resistance Zone (Range High)
The upper boundary where price has been consistently rejected. In structural terms, this is where sellers have been more active than participants on the other side. The resistance zone is not a single line – it is a band, often defined by the wicks of swing highs on the upper end and the bodies of those candles on the lower end.
2. The Support Zone (Range Low)
The lower boundary where price has been consistently supported. This is the mirror image of resistance – a zone where the other side of the market has been more active. Similarly defined by the wicks and bodies of swing lows.
3. The Midpoint
Often overlooked, the midpoint of a range is a useful reference. Price within a range frequently pauses, reverses, or accelerates near the midpoint. It is not a perfect rule, but ranges often behave differently in their upper half versus their lower half – price nearing resistance tends to lose momentum, while price nearing support tends to find it.
In practice, traders use the midpoint as a line of equilibrium: moves from support that fail to cross the midpoint are weak, while moves that push cleanly through the midpoint often have enough momentum to test the opposite boundary.
How Price Behaves Inside a Range
Understanding the typical behavioral patterns inside a range prevents misreading routine range oscillation as a trend forming.
Compression toward breakout: Ranges do not always persist with uniform energy. As a range matures, the swings within it often become smaller – price compresses toward the center. This compression is often a precursor to a breakout, not a sign that the range will continue indefinitely.
False breakouts at boundaries: One of the most consistent behaviors in a range is the false breakout – price briefly pierces the support or resistance boundary, triggers reactions from participants positioned at that level, and then snaps back inside the range. False breakouts at range highs are extremely common. They can trap aggressive participants and accelerate the reversal back toward the opposite boundary.
Momentum within the range: Even in a non-trending market, short-term momentum exists within the range. A move from support toward resistance carries its own mini-trend structure. Understanding this helps avoid the error of interpreting range-internal structure as a broader directional move.
Volume behavior inside the range: Here’s a useful nuance. Volume typically declines as price moves toward the center of the range (the midpoint) and increases as price approaches the boundaries. That’s because the tug-of-war between buyers and sellers is most intense near support and resistance, while equilibrium sees less urgency.
Based on this behavior, there are two distinct analytical approaches: positioning for bounces off the boundaries (fading the range) or waiting for a confirmed breakout in either direction.
What Ends a Range?
Ranges end in one of two ways: a genuine breakout above resistance, or a genuine breakdown below support. Understanding the difference between a real breakout and a false one is one of the most useful analytical skills for trading ranges and consolidations.
Characteristics of a Genuine Breakout
Decisive close beyond the boundary: A single candle's wick piercing resistance means little. A full candle close clearly above the resistance zone is a more meaningful signal.
Volume expansion: A breakout accompanied by notably higher trading volume than the average volume within the range suggests genuine conviction behind the move.
Follow-through: A genuine breakout is typically followed by continued directional movement rather than an immediate reversal back into the range. The first candle after the breakout candle often confirms or denies the move.
The broken level changes role: In a genuine upside breakout, the resistance zone that previously held price down often transitions to a support zone on any subsequent pullback. This role reversal – resistance becoming support – is one of the cleaner structural confirmations of a real breakout.
The S/R Flip: One of the most reliable signs of a successful breakout is when the old "Range Top" (Resistance) is tested from above and acts as new Support. Watch for that test.
Characteristics of a False Breakout
Wick extension without a clean close: Price spikes above resistance but closes back inside the range.
No follow-through: The next candle immediately reverses the breakout move.
Volume contraction on the breakout: Low volume on a perceived breakout suggests limited conviction and increases the probability of failure.
The level holds: Price returns to and respects the boundary that was "broken," confirming it was not genuinely violated.
Range Analysis in Multi-Timeframe Context
A range on one timeframe is often a component of a larger trend on a higher timeframe. This is an important context to maintain.
A stock in a clear weekly uptrend (HH/HL structure on weekly) may form a multi-week range on the daily chart. That daily range is most accurately described as a consolidation within the broader uptrend – not an independent, neutral structure. The context of the higher timeframe trend informs how to interpret the eventual resolution of the daily range.
Conversely, a daily range that forms after a prolonged downtrend may represent the market losing bearish momentum – the early stage of a structural shift rather than simple consolidation. The companion post on Break of Structure vs. Change of Character covers exactly how to identify when a range following a downtrend is the beginning of a structural reversal.
The practical implication: always note what the higher-timeframe structure is before analyzing a range on a lower timeframe. The same range pattern means different things depending on whether it appears at the top of an uptrend, the bottom of a downtrend, or in the middle of a sustained consolidation phase.
Ranges and the Broader Structure Cluster
Range identification connects directly to several other posts in this series:
Equal highs and lows: Ranges are defined by equal highs and lows – which is why the companion post Higher Highs vs. Equal Highs: Trend Continuation or Fakeout? is directly relevant. Not every equal high is the top of a range; sometimes equal highs appear within an uptrend as a brief pause before continuation. Learning to distinguish between the two prevents misclassifying a short consolidation within a trend as a full range.
Swing points: The boundaries of any range are defined by swing highs and swing lows. The Swing Highs and Swing Lows: The Building Blocks post establishes how to identify these points with precision, which is the prerequisite skill for drawing range boundaries accurately.
Break of structure: When a range resolves – either upside or downside – the breakout represents a structural break. The Break of Structure vs. Change of Character post explains the mechanics of how these structural events are classified and what they suggest about the likely subsequent behavior of price.
Frequently Asked Questions
Q: How do I know if a market is ranging or starting a new trend?
A: A range is confirmed when you have at least two defined highs and two defined lows at approximately the same levels. If price fails to make a new Higher High or Lower Low and instead returns to a previous reversal zone, the market has entered a range.
Q: What is the most common mistake traders make in a range?
A: The biggest mistake is "buying the high" or "selling the low" because they expect a breakout too early. In a range, price is more likely to revert to the midpoint than to break out. Professional traders look for "false breakouts" (wicks above resistance) to signal a move back to the other side of the range.
Q: Why is the "Midpoint" of a range important?
A: The midpoint acts as a line of equilibrium. If price cannot cross the midpoint after bouncing off support, it shows weakness and a high probability that the support will be tested again or broken.
Q: How can I tell a fake breakout from a real one?
A: A genuine breakout requires a decisive candle close above the zone, ideally accompanied by an increase in volume. A fakeout usually features a long wick that pierces the level but closes back inside the range, often trapping aggressive traders.
The Full Structure Cluster
| Article | What It Covers |
|---|---|
| Higher highs and higher lows: market structure guide | Uptrend structure – HH and HL |
| Lower highs and lower lows: bearish structure explained | Downtrend structure – LH and LL |
| This post | Sideways structure – ranges, support, resistance, breakouts |
| Swing highs and swing lows explained | The raw building blocks for all structure analysis |
| Break of structure vs. change of character | How trends and ranges transition |
| Higher highs vs. equal highs: trend or fakeout? | Equal levels inside trends vs. genuine ranges |
Summary
A range-bound market is the third and often most underappreciated market state. Here is the framework condensed:
- A range forms when price oscillates between an upper resistance zone and a lower support zone without making directional progress
- Structural definition: absence of HH/HL or LH/LL sequence; presence of approximately equal swing highs and lows
- Ranges form after significant moves, at major structural levels, or during low-conviction environments
- The three key components of a range are the resistance zone, the support zone, and the midpoint
- False breakouts at range boundaries are common and predictable – a genuine breakout is characterized by decisive closes, volume expansion, follow-through, and role reversal at the broken level
- A range on one timeframe must always be interpreted in the context of the higher-timeframe trend structure
Reading a range correctly is as important as reading a trend. The market is always in one of three states – uptrend, downtrend, or range. Once you can identify all three with structural precision, your chart reading has a complete foundation.
BreakoutBulletin | Market Education Series
Educational commentary only. Not investment advice. Past performance does not guarantee future results.