
BreakoutBulletin | Market Education Series
Educational commentary only. Not investment advice. Past performance does not guarantee future results.
The Case for Buying Into Weakness
Every trader instinctively wants to buy strength. Price is moving up, momentum is building, the stock is in the news - the urge to enter is strongest precisely when the setup is weakest. By the time a move is obvious, the risk-reward has already degraded. The entry is crowded. The stop is wide. The upside is limited.
Pullback trading inverts that instinct deliberately. Instead of entering when price is moving away from value, you enter when price is temporarily returning to it - when a stock in an established uptrend pauses, retraces a measured portion of its prior move, and then resumes in the original direction. The entry is uncomfortable because price is declining when you buy. The risk-reward is superior because the stop is tight and the upside is the full resumption of the trend.
This is not countertrend trading. You are not buying falling stocks hoping they recover. You are buying temporarily discounted stocks within confirmed uptrends - waiting for the trend to pause, measuring how far it should reasonably retrace, and entering when it shows evidence of resuming. The Fibonacci retracement framework provides the mathematical structure for that measurement.
Q&A: The Logic of Buying the Dip
Why is buying a "pullback" safer than buying a breakout in 2026?
In the 2026 market, breakouts are frequently "hunted" by high-frequency algorithms, leading to false moves. By waiting for a pullback, you aren't chasing the crowd at the most expensive price. Instead, you are waiting for institutional profit-taking to provide you with a discounted entry. This allows for a tighter stop-loss and a significantly better Risk-to-Reward ratio. You aren't betting against the trend; you’re joining it at a better price.
How do I know if a pullback is a "discount" or the start of a "crash"?
We use the 61.8% Fibonacci Level as our "line in the sand." In a healthy trend, the price should hold above this level. If the stock retraces more than 78.6% of its prior move, the trend structure is likely broken, and the "pullback" has turned into a reversal. We also look for Declining Volume during the dip - if volume is high while the price falls, it's a sign of institutional selling (distribution), and we pass on the trade.
Does the "Selective Risk-Off" regime of April 2026 affect my Fibonacci targets?
Absolutely. In a "Full Risk-On" market, pullbacks are shallow (38.2%). However, as of April 2026, with the S&P 500 showing moderate participation and the VIX hovering near 19, we are in a Score 2 (Selective Risk-Off) environment. This means pullbacks are deeper and more volatile. You should target the 50% and 61.8% Fibonacci levels for entries right now, as shallow dips are more likely to fail under current macro pressure.
Why Fibonacci Retracements Work in Trending Markets
Fibonacci retracements are not mystical. They work because they are self-fulfilling at scale — enough institutional participants use the same retracement levels that the levels themselves attract order flow.
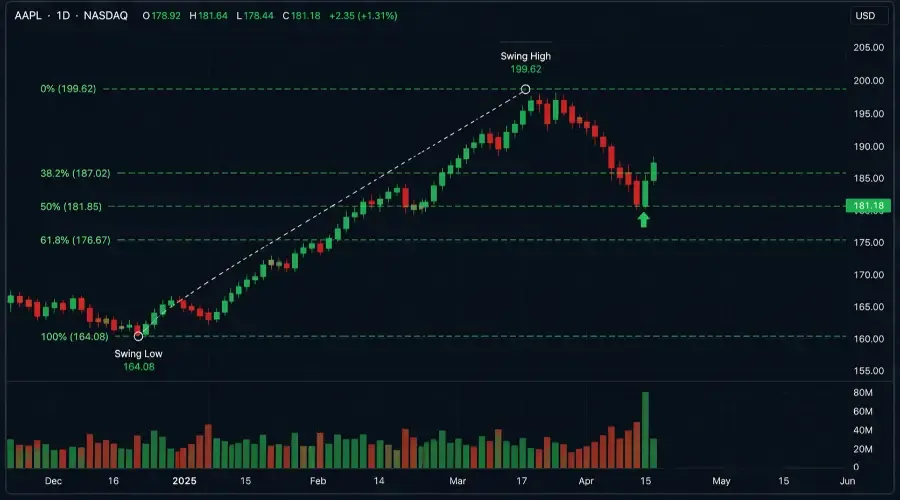
The three retracement levels that matter for pullback trading are the 38.2%, 50%, and 61.8% retracements of the prior swing move. Each reflects a different market psychology:
38.2% retracement – shallow pullback in a strong trend. Institutions confident in the trend direction re-enter aggressively. Occurs in strong momentum environments.
50% retracement – the most widely watched level, carrying the highest concentration of institutional orders. Represents a balanced pause. Most high-quality pullback entries occur here.
61.8% retracement – deep pullback that tests trend conviction. Higher risk but also higher reward (tighter stop, larger potential move).
Beyond 61.8% — toward 78.6% and beyond — the pullback is no longer a retracement within a trend. It is a potential trend change. Position sizing drops sharply, and additional confirmation is required.
Practical application: Draw the Fibonacci tool from the swing low to the swing high of the most recent confirmed move. The three horizontal levels at 38.2%, 50%, and 61.8% are your potential entry zones. Price entering one of these zones triggers setup monitoring — not entry. Entry requires confirmation evidence at the zone.
The Regime Scoring System
Before any pullback analysis, establish the macro environment. The same three-point scoring system applies across all BreakoutBulletin setups.
SPY trend positive: SPY above its 20-day SMA → +1 point
Volatility contained: VIX below 20 → +1 point
Breadth positive: NYSE A/D line not diverging from SPY → +1 point
Scoring rules:
Score 3 → Full intended position size
Score 2 → Half intended position size
Score 1 or 0 → Paper trade only
Regime-specific pullback depth adjustment:
Score 3 (full risk-on) → target shallow 38.2% retracements
Score 2 (selective risk-off, current April 2026) → target 50% and 61.8% retracements
Pullbacks are the most regime-versatile setup in the cluster — they carry positive expectancy at both score 2 and score 3. The key difference is which retracement depth to target.
Pullback Quality Grading System
| Grade | Trend Quality | Retracement Depth | Volume Pattern | Prior Swing | Max Size (Regime 3) | Max Size (Regime 2) |
|---|---|---|---|---|---|---|
| A | Strong - higher highs/lows on daily and weekly | 38.2-61.8% | Declining on pullback | Clean single swing, no overlap | Full 1% risk | 0.5% risk |
| B | Moderate - higher highs/lows on daily only | 50-61.8% | Mixed — some up-volume days | Prior swing has overlap | 0.75% risk | 0.4% risk |
| C | Weak - trend unclear on daily, only intraday | Beyond 61.8% | Rising volume on pullback | Multiple overlapping swings | No trade | No trade |
Quick Reference: What Each Grade Means
Grade A – cleanest trending environments, declining volume on pullback (weak selling). Full size at regime 3, half at regime 2.
Grade B – tradeable with reduced size and stricter confirmation. Trend on daily only, mixed volume.
Grade C – pass. Rising volume on pullback signals distribution, not profit-taking.
The Five Pullback Confirmation Signals
Signal One – Reversal Candle at Fibonacci Level
A candle whose body forms at or near a Fibonacci level and closes in the trend direction, above the prior candle's high. Volume above 20-period average.
Best for: Grade A and B, 15-minute, 1-hour, daily charts.
Signal Two – Fibonacci Confluence with Moving Average
When a Fibonacci level aligns within 1 ATR of a significant moving average (20-day, 50-day, or 200-day SMA), the confluence creates layered demand. Entry follows reversal candle rule.
Best for: Grade A setups.
Signal Three – Volume Dry-Up Followed by Expansion
Pullback volume declines progressively, then a single candle shows volume expansion (above 20-period average) as price stops declining. Institutional accumulation signature.
Best for: Daily timeframe Grade A swing setups.
Signal Four – Higher Low Formation
After reaching the Fibonacci zone, price makes a higher low within the zone. Entry on the break above the mini-consolidation high between the two lows. Produces the tightest stops.
Entry: Above the swing high between the two lows.
Stop: Below the second (higher) low, plus 0.3× ATR.
Best for: Grade A daily chart setups.
Signal Five – VWAP Reclaim Within Fibonacci Zone
For intraday pullbacks on liquid large-caps, when price pulls back to a Fibonacci level that also aligns with intraday VWAP, the reclaim of VWAP provides dual-framework confirmation.
Best for: Intraday traders on SPY, QQQ, large caps.
Trend Identification: The Non-Negotiable Foundation
The most expensive mistake in pullback trading is entering a pullback in a trend that is actually ending. Before drawing a single Fibonacci level, the trend must be confirmed on the timeframe above the one being traded.
Intraday pullbacks (15-minute execution): Daily chart must show established uptrend - higher highs, higher lows, price above both 20-day and 50-day SMA.
Swing pullbacks (daily execution): Weekly chart must show established uptrend - higher highs, higher lows on weekly, price above 20-week SMA.
Position trades (weekly execution): Monthly chart must show higher highs/lows over at least 12 months.
The trend on the timeframe above the execution timeframe is the governing constraint. It cannot be overridden by a compelling pattern on a lower timeframe.
Drawing Fibonacci Correctly: The Rules Most Traders Get Wrong
Use the most recent confirmed swing – swing high/low with at least three candles of reversal. Anchor on candle closes, not wicks.
Draw from low to high for uptrends – anchor at swing low, extend to swing high. Retracement levels appear between them.
The swing must be clean and impulsive – direct, high-momentum move. Choppy, overlapping moves produce weak Fibonacci levels.
Redraw with each new swing high – old levels lose significance. Always use the most recent swing.
Pre-Entry Checklist (Full)
| Condition | Threshold | Check |
|---|---|---|
| Regime score | 2 or 3 | Yes / No |
| Pullback grade | A or B only | Yes / No |
| Higher timeframe trend confirmed | Higher highs/lows on timeframe above execution | Yes / No |
| Price above 20 and 50-period MA on execution timeframe | Both rising or flat | Yes / No |
| Fibonacci drawn from clean impulsive swing | Candle close anchor points, not wicks | Yes / No |
| Retracement depth within 38.2-61.8% | Measured from tool | Yes / No |
| Pullback volume declining | Below average on counter-trend candles | Yes / No |
| Pullback duration appropriate | 3-15 candles on execution timeframe* | Yes / No |
| Confirmation signal identified | One of five signal types present | Yes / No |
| No major resistance within 1× ATR above entry | Prior highs, MAs checked | Yes / No |
| No binary catalyst within 5 sessions | Earnings, major macro event checked | Yes / No |
| Minimum 1.5:1 R:R to nearest resistance | Calculated before entry | Yes / No |
Position Sizing: Full Calculation With Fibonacci Stop Examples
| Account | Grade / Regime | Dollar Risk | Stop Distance | Shares |
|---|---|---|---|---|
| $10,000 | Grade A / Score 3 (1%) | $100 | $1.60 | 62 |
| $10,000 | Grade A / Score 2 (0.5%) | $50 | $1.60 | 31 |
| $25,000 | Grade A / Score 3 (1%) | $250 | $1.60 | 156 |
| $25,000 | Grade A / Score 2 (0.5%) | $125 | $1.60 | 78 |
| $50,000 | Grade A / Score 3 (1%) | $500 | $1.60 | 312 |
| $50,000 | Grade A / Score 2 (0.5%) | $250 | $1.60 | 156 |
Observed Performance Data
| Fibonacci Level | Regime Score | Grade A (n) | Grade A Success Rate | Grade A R:R | Grade B Success Rate |
|---|---|---|---|---|---|
| 38.2% | Score 3 | 187 | 71% | 2.4:1 | ~61% |
| 38.2% | Score 2 | 143 | 58% | 1.8:1 | ~48% |
| 50% | Score 3 | 224 | 67% | 2.1:1 | ~57% |
| 50% | Score 2 | 198 | 61% | 1.9:1 | ~51% |
| 61.8% | Score 3 | 156 | 62% | 2.6:1 | ~52% |
| 61.8% | Score 2 | 226 | 54% | 2.0:1 | ~44% |
Walk-Forward Analysis: 10 Consecutive Paper Trades
| Trade | Grade | Regime | Fib Level | Confirmation | Outcome | Notes |
|---|---|---|---|---|---|---|
| 1 | A | 3 | 50% | Reversal candle | +2.1R | Clean volume dry-up |
| 2 | A | 3 | 38.2% | Higher low | +1.8R | Shallow pullback |
| 3 | B | 2 | 50% | Reversal candle | +0.9R | Half size correct |
| 4 | A | 3 | 61.8% | Volume expansion | -1.0R | Valid loss – normal |
| 5 | C | 2 | 70% | N/A | Skipped | Beyond 61.8%, Grade C |
| 6 | A | 3 | 50% | VWAP confluence | +2.4R | Dual framework |
| 7 | A | 2 | 50% | Reversal candle | +1.0R | Current regime baseline |
| 8 | A | 3 | 38.2% | No signal – early | Skipped | Correct pass |
| 9 | A | 3 | 61.8% | Higher low | +2.7R | Tightest stop, best R:R |
| 10 | B | 2 | 61.8% | Reversal candle | -1.0R | Grade B, sized correctly at 0.4% |
The Professional Edge
In today’s market, pullbacks are not weakness - they are opportunity.
The edge lies in waiting for structured retracement, confirming institutional participation, and executing with discipline - not emotion.
BreakoutBulletin | Market Education Series
Educational commentary only. Not investment advice. Past performance does not guarantee future results.