
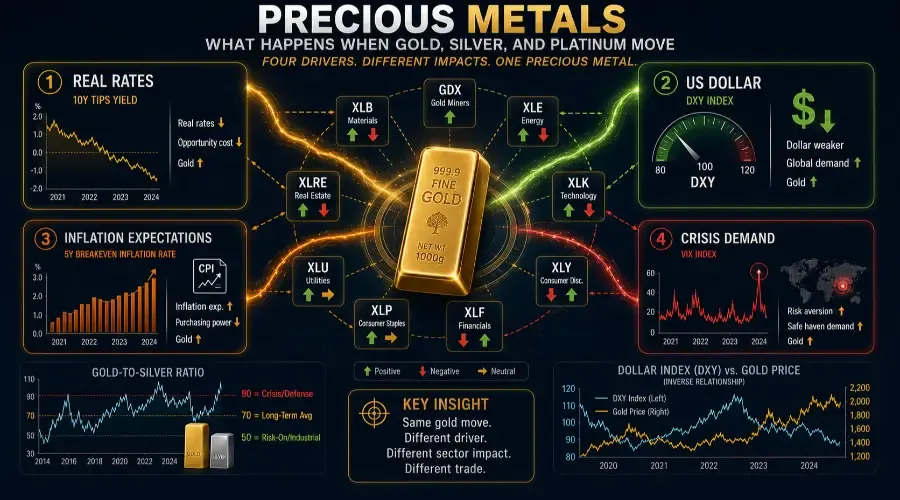
Gold spikes 5% in a week. Every finance headline calls it a safe haven rally. Every retail trader buys gold miners. And then – nothing plays out the way the narrative suggested. The dollar barely moves. Bond yields keep rising. Equities shrug.
This is the most common mistake traders make with precious metals: treating every gold move as if it has the same cause, the same meaning, and the same sector implications. It does not. Gold rising because inflation expectations are surging is a completely different trade from gold rising because a geopolitical crisis has erupted – and both are different again from gold rising because the dollar is weakening.
Precious metals are the only asset class in this series where identifying the driver matters more than identifying the direction. Get the driver wrong and the entire sector playbook reverses. This hub – your precious metals trading playbook – shows you how to identify the driver first, always. Once you understand how gold affects the stock market at that level, the trade becomes much less about guessing and much more about connecting the dots.
Why Precious Metals Are Different From Every Other Commodity
Every other commodity in this series has a primary use case that determines its price. Oil is burned for energy. Copper is wired into motors and buildings. Wheat is ground into flour. Their prices reflect the balance of supply and demand for that physical use – and that is what makes their market transmission predictable.
Precious metals – particularly gold – barely have an industrial use case relative to their price. Less than 10% of annual gold demand is industrial. The remaining 90% is jewelry, central bank reserves, and investment. Gold's price is not primarily set by supply and demand for a physical input. It is set by the global financial system's demand for a store of value, an inflation hedge, a crisis asset, and a dollar alternative – simultaneously.
This means gold is not a commodity in the traditional sense. It is a financial instrument with commodity form. And its market transmission reflects financial conditions – real interest rates, dollar direction, inflation expectations, and global risk sentiment – rather than production chains. In practice, that’s why gold price drivers explained properly make the difference between a sharp trade and a costly misread.
Silver occupies a middle position. Approximately 50% of silver demand is industrial – solar panels, electronics, medical applications – which means it responds to both financial conditions (following gold) and industrial cycle dynamics (following copper). This dual nature makes silver uniquely volatile: it amplifies gold moves on the upside and amplifies industrial cycle downturns on the downside.
Platinum sits closest to the industrial metals in this series. Its price is primarily driven by automotive demand (catalytic converters), hydrogen fuel cell development, and South African mining supply. Platinum is the precious metal where the industrial transmission mechanism described in Hub 2 applies most directly.
Understanding these three distinct profiles is the prerequisite for every precious metals trade.
The Four Drivers of Gold: Which One Is Active Right Now?
Every significant gold move is driven by one – or a combination – of four distinct forces. The sector implications depend entirely on identifying which driver is dominant. This is the analytical framework that separates informed precious metals trading from narrative-driven guessing.
Driver 1: Real Interest Rate Changes
This is the most powerful and most consistent driver of gold prices over multi-year periods. Real interest rates are the opportunity cost of holding gold – because gold pays no yield, every percentage point of real return available in Treasury bonds is a percentage point of yield that gold holders are forgoing.
When real rates fall (because inflation rises faster than nominal rates, or because the Fed cuts rates while inflation stays elevated), gold becomes relatively more attractive. Holding a zero-yield asset costs less when the alternative also yields little in real terms. This is the regime that drove gold from 1,200 in 2018 to 2,075 in August 2020 – real rates went deeply negative as the Fed held rates near zero while inflation expectations rose.
When real rates rise (because the Fed raises nominal rates faster than inflation falls), gold becomes relatively less attractive. This is what made 2022 confusing for traders who bought gold as an inflation hedge – gold was flat to down for most of 2022 despite CPI running at 40-year highs, because the Fed's aggressive rate hikes pushed real rates sharply positive. The inflation hedge narrative was correct; the real rate impact overwhelmed it.
Sector implication when real rates are the dominant driver: The gold move and the equity market move are inversely correlated with rate-sensitive sectors. Rising real rates hurt gold AND hurt XLRE and XLU (for the same underlying reason – duration sensitivity). Falling real rates help gold AND help XLRE and XLK growth stocks. A gold rally driven by falling real rates is a buy signal for rate-sensitive equity sectors, not a defensive signal.
Driver 2: US Dollar Direction
Gold is priced in US dollars globally. When the dollar strengthens, gold becomes more expensive in every other currency – which suppresses non-US demand and pushes the dollar price down. When the dollar weakens, gold becomes cheaper in every other currency – which stimulates global demand and pushes the dollar price up.
This inverse relationship holds consistently over multi-year periods, though it can decouple temporarily when other drivers (crisis, inflation) are dominant. The gold vs dollar relationship is one of the first correlations every macro trader learns, and for good reason.
Sector implication when dollar direction is the dominant driver: A gold rally driven by dollar weakness is simultaneously positive for commodities broadly (oil, copper, agricultural prices all rise in dollar terms as the dollar falls), positive for multinational earnings (revenue earned overseas translates back at higher rates), and positive for emerging market assets (their dollar-denominated debts become easier to service). This is the broadest positive signal gold can send.
Driver 3: Inflation Expectations
When the market believes future inflation will be higher than current pricing suggests, gold benefits – it is the oldest inflation hedge in existence. This driver is most relevant when inflation is accelerating from a low base or when a policy change (aggressive fiscal stimulus, supply chain disruption, commodity shock) is expected to change the inflation trajectory.
This driver is closely related to Driver 1 (real rates) but is not identical – the key difference is timing. Inflation expectations can rise before the Fed responds, creating a window where gold rallies and real rates are still falling. Once the Fed responds aggressively, Driver 1 can reverse the gold trade even as the underlying inflation concern that started it remains valid.
Sector implication when inflation expectations are the dominant driver: This is the traditional stagflation trade. Gold rallies alongside energy (XLE) and materials (XLB) – hard assets collectively outperform. Growth stocks (XLK) and bonds underperform. This is the regime most retail traders associate with gold, and it is correct – but only in this specific scenario.
Driver 4: Safe Haven / Crisis Demand
Geopolitical crises, financial system stress, and acute equity market selloffs all produce short-term gold demand spikes driven by pure fear. Investors buy gold because they are uncertain about everything else – not because of a considered view on real rates or inflation.
This is the most short-lived gold driver and the most dangerous one to trade directionally. Crisis-driven gold spikes are frequently fully reversed once the initial panic subsides. The 2020 COVID crash produced a brief gold selloff (forced liquidation) followed by a sharp rally – but the sustained multi-year gold bull market that followed was driven by Driver 1 (negative real rates), not ongoing crisis demand.
Sector implication when crisis demand is the dominant driver: Defensive rotation. XLV and XLP outperform. Volatility (VIX) rises. Credit spreads widen. This is the only gold rally scenario where equity markets are broadly negative simultaneously. Gold miners do not necessarily outperform – in a genuine financial crisis, gold mining stocks can fall alongside equities due to forced liquidation before recovering as physical gold demand persists.
Sector Reaction Map: Gold Spike vs. Gold Decline
Gold Miners (GDX/GDXJ) shows a ✅ Strong Positive impact during a gold spike, and a ❌ Strong Negative impact during a gold decline, with the key condition being Leverage to gold price.
Materials (XLB) shows a ✅ Moderate Positive impact during a gold spike, and a ❌ Moderate Negative impact during a gold decline, with the key condition being Mining sub-sector weight.
Energy (XLE) shows a ✅ Positive impact during a gold spike (if dollar-driven), and a ❌ Negative impact during a gold decline (if dollar-driven), with the key condition being Dollar correlation.
Utilities (XLU) shows a ✅ Positive impact during a gold spike (if crisis-driven), and a ➡️ Neutral impact during a gold decline, with the key condition being Safe haven co-movement.
Healthcare (XLV) shows a ✅ Positive impact during a gold spike (if crisis-driven), and a ➡️ Neutral impact during a gold decline, with the key condition being Defensive character.
Consumer Staples (XLP) shows a ✅ Positive impact during a gold spike (if crisis-driven), and a ➡️ Neutral impact during a gold decline, with the key condition being Defensive character.
Real Estate (XLRE) shows a ✅ Positive impact during a gold spike (if rate-driven ↓), and a ❌ Negative impact during a gold decline (if rate-driven ↑), with the key condition being Real rate sensitivity.
Technology (XLK) shows a ✅ Positive impact during a gold spike (if rate-driven ↓), and a ❌ Negative impact during a gold decline (if rate-driven ↑), with the key condition being Duration sensitivity.
Industrials (XLI) shows a ➡️ Neutral to Negative impact during a gold spike, and a ➡️ Neutral to Positive impact during a gold decline, with the key condition being Indirect.
Consumer Disc. (XLY) shows a ❌ Negative impact during a gold spike (if crisis), and a ✅ Positive impact during a gold decline (if growth return), with the key condition being Risk sentiment.
Financials (XLF) shows a ❌ Negative impact during a gold spike (if crisis), and a ✅ Positive impact during a gold decline (if rate rise), with the key condition being Rate and credit.
(✅ = Positive, ❌ = Negative, ➡️ = Neutral)
How to read this map: The "Key Condition" column is the critical column – it tells you which driver must be active for the directional impact to apply. This is why the precious metals sector map looks more complex than Hub 1 or Hub 2 – because the driver identification step must come before the sector positioning step. Always.
The Gold-to-Silver Ratio: The Most Underused Signal in Precious Metals
The gold-to-silver ratio measures how many ounces of silver are required to buy one ounce of gold. Over the past century, the ratio has averaged approximately 60–70. Extremes in the ratio are consistently meaningful:
Ratio above 90 (silver cheap relative to gold):
This level has historically appeared during crisis events – 2008 GFC, March 2020 COVID crash, 2020 pandemic peak. It signals that safe haven demand is overwhelming industrial demand for silver. When the ratio peaks and begins falling from above 90, it historically signals the transition from crisis defense to economic recovery – and silver dramatically outperforms gold during that transition. The 2020 case was extreme: the ratio hit 125 in March 2020, then fell to 65 within six months as recovery trade took hold.
Ratio below 50 (silver expensive relative to gold):
This level appears during late-cycle commodity booms when industrial demand for silver (primarily solar manufacturing) is accelerating alongside inflation. It signals that the industrial component of silver demand is dominant – and typically coincides with broad commodity strength across XLE and XLB.
The ratio's trading utility: It is a cross-asset signal, not just a precious metals signal. A falling gold-to-silver ratio (silver outperforming) is often one of the earliest signals of a broad risk-on rotation – particularly from crisis defense toward growth assets. It deserves a place on every macro trader's dashboard.
Key Historical Precious Metals Events and What They Produced
2018–2020: The Negative Real Rate Gold Bull Market
Gold rose from 1,178 in August 2018 to 2,075 in August 2020 – a 76% gain over two years. The primary driver was falling real interest rates, which went deeply negative as the Fed first cut rates in 2019 and then deployed emergency zero-rate policy in March 2020. XLRE and XLU both outperformed during 2019 (the same real rate dynamic that was lifting gold was lifting rate-sensitive equities). Growth stocks in XLK also performed strongly. This is the clearest modern case study for the real rate driver in gold – and the clearest illustration that a gold rally can coincide with a broad equity bull market when real rates are the driver.
2022: The Inflation Hedge That Did Not Work
CPI hit 9.1% in June 2022 – the highest reading since 1981. Gold was essentially flat for the year, closing 2022 down approximately 0.3% despite raging inflation. The explanation is Driver 1 overwhelming Driver 3: the Fed's aggressive rate hike cycle (from 0% to 4.25% in one year) pushed real rates sharply positive, dominating the inflation expectation tailwind. Traders who bought gold purely on the inflation narrative were holding a correctly diagnosed thesis with the wrong driver weighting. XLRE fell 29% and XLK fell 33% in the same year – confirming the rising real rate transmission was fully intact; it simply hit gold and rate-sensitive equities simultaneously.
**2011: The Eurozone Crisis and the 1,920 Peak Goldhit 1,920 per ounce in September 2011, driven by a combination of all four drivers simultaneously – European sovereign debt crisis (safe haven), negative US real rates (QE2 still in effect), dollar weakness, and elevated inflation expectations. The subsequent decline from 1,920 to 1,180 by 2013 was equally multi-driver: the Eurozone stabilized (crisis demand faded), the dollar recovered, and US real rates began rising as QE expectations shifted. The lesson: when multiple drivers converge positively for gold, the rally is powerful. When they diverge, the reversal can be equally sharp.
2007–2009: The GFC Paradox
Gold's behavior during the GFC is the most instructive – and most counterintuitive – case in the historical record. As financial panic peaked in September–October 2008, gold initially fell alongside equities – forced liquidation overwhelmed safe haven demand. Then, as the Fed cut rates to zero and began QE, gold surged – rising from700 in October 2008 to 1,920 by 2011. The lesson for traders: in an acute financial crisis, gold is NOT a reliable short-term hedge because forced liquidation can overwhelm fundamental demand. The durable trade is post-stabilization, when real rates go negative and QE begins.
How to Trade Precious Metals Catalyst Events: The Three-Phase Checklist
Use this checklist before, during, and after any major precious metals move. One practical note: gold can gap violently on crisis headlines, so position size for elevated volatility – especially when the VIX is already above 25.
Before a precious metals event:
Identify the active driver: check the 10-year TIPS yield (real rate), DXY index (dollar), 5-year breakeven inflation rate, and VIX (crisis level) – these four indicators collectively tell you which driver is dominant
Check the gold-to-silver ratio – is it elevated (crisis/defense) or compressed (risk-on/industrial)?
Assess gold mining stock behavior relative to gold itself – if GDX is lagging physical gold, the market does not believe the move is sustained
During the event:
Watch real rates (TIPS yields) in real time – if gold is spiking but TIPS yields are also rising, the move is crisis-driven and likely to be short-lived
Monitor DXY simultaneously – a gold rally with a rising dollar is almost always crisis demand, not a structural bull move
Check whether XLU and XLP are also rallying – simultaneous defensive sector outperformance confirms crisis as the dominant driver
After the event (the lagged trades):
If the gold move was real-rate-driven, set reminders to review XLRE and XLK positioning – the same force acting on gold is acting on these sectors with a longer duration
If the gold move was dollar-driven, review multinational earnings exposure – XLK, XLV, and XLP all have significant overseas revenue that translates better with a weaker dollar
If the gold move was crisis-driven and has stabilized, watch the gold-to-silver ratio for the recovery signal – silver beginning to outperform gold is the transition trade from defense to growth
Trading from outside the US? The same driver logic applies globally – just use local gold mining indices or commodity-linked ETFs; the transmission mechanism doesn't change
Three Precious Metals Events Covered in This Hub
→ What Happens When Gold Prices Spike (High priority – 1,500+ monthly searches)
The flagship post in this hub. Covers the four-driver identification framework in full, the sector rotation for each scenario, gold miner leverage dynamics (GDX/GDXJ), the TIPS yield as a real-time signal, and three historical case studies (2020 negative real rate bull market, 2011 Eurozone crisis peak, 2008 GFC paradox). The definitive retail trader guide to reading what a gold spike actually means. [link]
→ What Happens When Gold Prices Fall (High priority – 900+ monthly searches)
The mirror image analysis – but more complex than a simple reversal of the spike playbook. Covers why gold falls (rising real rates, dollar strength, crisis resolution, or risk-on rotation) and why each cause has different sector implications. The 2022 case study – gold flat despite 9% inflation – is the centrepiece. Also covers the portfolio rebalancing effect when institutional investors sell gold to fund equity positions. [link]
→ What Happens When Silver Prices Spike (Medium priority – 700+ monthly searches)
Silver's dual industrial-financial nature makes its spike scenarios more complex than gold's. Covers the gold-silver ratio as a leading indicator, the solar manufacturing demand driver (unique to silver), the 2020 Reddit-driven silver squeeze and what it revealed about physical vs. paper silver markets, and the sector implications of silver spikes driven by industrial demand versus safe haven demand. [link]
Continue Through the Catalyst Series
→ Pillar: The Complete Market Catalyst Framework
→ Hub 1: Energy Commodities – Oil, Gas, Uranium
→ Hub 2: Industrial & Base Metals – Copper, Steel, Lumber
→ Hub 4: Agricultural Commodities – Wheat, Corn, Soybeans
→ Hub 5: Macroeconomic Events – Fed, CPI, NFP, GDP
→ Hub 6: Central Bank & Policy – QE, Tapering, Tariffs, Tax
→ Hub 7: Geopolitical Events – Wars, Elections, OPEC, EM Crisis
Frequently Asked Questions
1. What drives gold prices the most?
Gold prices are primarily driven by four factors: real interest rates, US dollar direction, inflation expectations, and crisis demand. Among these, real interest rates are the most powerful long-term driver.
2. Why does gold rise when interest rates fall?
Gold rises when real interest rates fall because the opportunity cost of holding gold decreases. Since gold does not pay interest, lower real yields make it more attractive compared to bonds.
3. How does the US dollar affect gold prices?
Gold and the US dollar typically have an inverse relationship. When the dollar weakens, gold becomes cheaper globally, increasing demand and pushing prices higher.
4. Is gold a good inflation hedge?
Gold can act as an inflation hedge, but only when real interest rates are falling. If central banks raise rates aggressively, gold may underperform even during high inflation.
5. What happens to stocks when gold rises?
It depends on the driver:
If gold rises due to falling rates → growth stocks may also rise
If gold rises due to crisis → stocks usually fall
If gold rises due to inflation → commodities outperform
6. What is the gold-to-silver ratio?
The gold-to-silver ratio measures how many ounces of silver equal one ounce of gold. It is used to identify relative value and signal shifts between risk-off and risk-on market environments.
7. Which sectors benefit from rising gold prices?
Gold mining companies (GDX, GDXJ) benefit the most. Depending on the driver, sectors like real estate, technology, or defensive sectors may also gain.
8. Why did gold not rise during high inflation in 2022?
Despite high inflation, gold did not rise significantly in 2022 because real interest rates increased sharply due to aggressive Federal Reserve rate hikes, reducing gold’s attractiveness.
All content on BreakoutBulletin is for educational purposes only and does not constitute financial advice or a recommendation to buy or sell any security.