
Monday, August 3, 2026 | Before the U.S. Open
Published by BreakoutBulletin Pre-Market
Pre-Market Dashboard
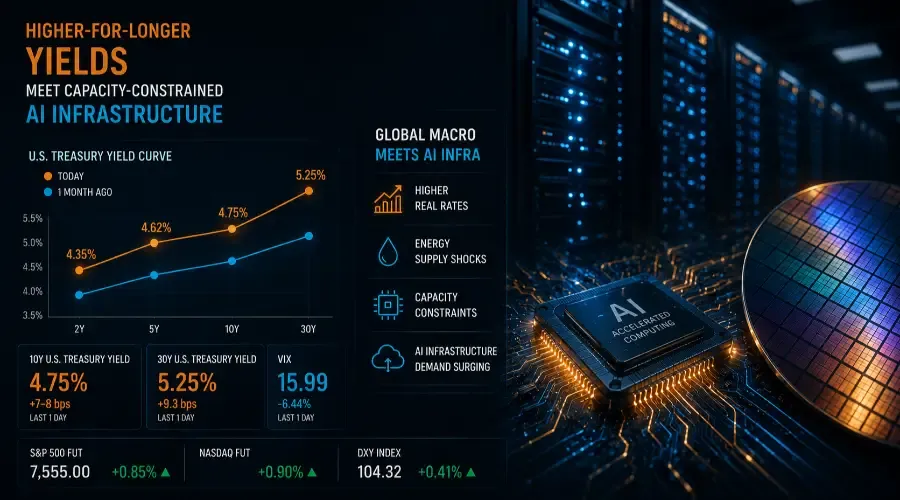
| Asset / Benchmark | Friday Close / Level | Pre-Market / Futures | Session Setup / Bias |
|---|---|---|---|
| S&P 500 | 7,489.72 (+0.70%) | ~7,555.00 (+0.85%) | Bullish Momentum (Led by Cloud/Hyperscalers) |
| Nasdaq Composite | 25,373.85 (+1.00%) | ~+0.90% | Outperforming (Diverging hardware vs. cloud) |
| 10-Year Treasury Yield | 4.75% (+7–8 bps) | 4.75% (Holding) | Tightening Constraint (Highest since early 2025) |
| 30-Year Treasury Yield | ~5.25% | 5.25% (Holding) | Bear-Steepener (Highest since mid-2007) |
| CBOE Volatility (VIX) | 15.99 (–6.44%) | ~15.80 | Subdued (Residual short dealer gamma) |
Today’s Macro Catalyst: ISM Manufacturing PMI Report at 10:00 AM ET (Watch for input price sub-indices and supply bottlenecks).
The Setup: Resolving Friday’s Cross-Asset Divergence
The market opens the week holding a tension it left unresolved on Friday. Equity indices surged into the weekend, driven by blockbuster cloud numbers while the rate complex refused to rally alongside them.
The 10-year Treasury yield closed Friday at 4.75%, while 30-year yields hit ~5.25%. Equities rallying into historic long-end yield highs is the defining fingerprint of a growth-with-higher-for-longer regime.
The single highest-conviction lead edge heading into Monday’s bell is the coexistence of a hawkish Federal Reserve terminal-rate path with confirmed multi-year physical capacity shortfalls in AI infrastructure.
1. The Rate Backdrop: A Hawkish Fed Hold
The anchor for the rate complex remains the July 29 FOMC decision:
Policy Target: Maintained at 3.50%–3.75%, but accompanied by a hawkish 9–3 dissent (Hammack, Kashkari, and Logan voted for an immediate +25 bp hike), as detailed in the official FOMC Policy Statement.
Fed Stance: Chair Warsh used the Federal Reserve Press Conference to explicitly reject forward guidance and soft inflation targets, stating: "This Fed will not waver."
Policy Statement: Verbatim text confirmed that inflation remains elevated, "in part reflecting supply shocks that have driven price increases in certain sectors, including energy."
Market Pricing: Money markets now price in a ~64% probability of a 25 bp rate hike in September, shifting the burden of proof entirely onto incoming labor and inflation data to justify easing.
2. Micro Earnings Signal: Capacity Shortfalls Reframe Capex
Q2 mega-cap reports shifted the narrative from "Are hyperscalers overspending on AI?" to "Is there enough physical infrastructure to meet demand?"
                 [ MEGA-CAP EARNINGS DISPERSION ]
                               │
       ┌───────────────────────┴───────────────────────┐
       ▼                                               ▼
Cloud Infrastructure                         Consumer Hardware
 (MSFT / AMZN)                                    (Apple)
 ── Accelerating Demand                       ── Margin Pressure
 ── Azure +43% YoY                            ── Sept Qtr Guided +9–11%
 ── AWS +60% YoY ($496B Backlog)              ── Sequential Node/Memory
 ── Capex Raised ($220B)                         Supply Bottlenecks
Microsoft (MSFT): Detailed in Microsoft’s Q4 Earnings Release, Azure revenue jumped +43% YoY, pushing full-year Azure revenue past $100 billion. Backlog remains elevated across the Intelligent Cloud segment ($39.3 billion, +32%).
Amazon (AMZN): According to Amazon’s Q2 8-K Filing, AWS revenue surged +60% YoY to $42.2 billion (fastest growth in 18 quarters) with an operating income of $16.6 billion and a contracted backlog of $496 billion. Amazon raised 2026 cash CapEx guidance to $220 billion (from $200 billion), attributing the entire increase to rising memory costs, while warning that capacity will remain insufficient through 2027.
Apple (AAPL): In Apple's Q3 Financial Results, despite record June revenue ($109.4 billion), Apple guided September-quarter revenue to +9% to +11% (below consensus of ~12%) as sequential supply constraints in advanced nodes and memory now directly cap output across iPhone, Mac, and iPad franchises.
Portfolio Implementation Matrix
This section translates the macro/micro synthesis into active pre-market positioning:
| Asset Class | Strategy / Direction | Rationale & Catalysts |
|---|---|---|
| Equities (Overweight) | Cloud Hyperscalers & AI Infrastructure | Strong pricing power to pass through memory input costs; multi-year demand visibility (MSFT, AMZN). |
| Equities (Underweight / Short) | Unhedged Hardware & Long-Duration Tech | Consumer hardware facing squeezed gross margins from memory shortages; high-multiple tech vulnerable to real yield expansion. |
| Rates & Fixed Income | Bear-Steepener / Pay Fixed (Long End) | Expressing higher term premium and supply-shock inflation risks; short 10Y/30Y vs. short-end notes. |
| Foreign Exchange (FX) | Long US Dollar (DXY) vs. High-Import EMs | Higher U.S. real rates combined with elevated energy/semiconductor input costs favor dollar strength over vulnerable EM importers. |
Today’s Session Execution Plan
Critical Technical & Yield Levels
S&P 500 (Futures):
Pivot / Resistance: 7,565 (Overnight Highs / Extension Target)
Support: 7,489 (Friday Close) / 7,450 (Key Gamma Flip Level)
10-Year Treasury Yield:
Critical Pivot: 4.75%. A sustained break above 4.80% triggers broader multiple compression in high-beta tech. A move below 4.68% signals a relief rally in long-duration equities.
Intraday Scenarios
Scenario A (Cloud Lead Holds): S&P futures maintain >7,540 through the open despite 10Y yields holding >4.75%.
Action: Maintain long exposure in hyper-scale cloud names; buy intraday pullbacks to support.
Scenario B (Rate Spike Drag): 10Y yield surges past 4.80% following a hot 10:00 AM ISM Manufacturing Prices Paid print.
Action: Trim tech exposure; activate short hedges in high-multiple, non-profitable software and hardware names.
Session Falsifiers (When to Abandon the Bias)
The macro edge remains valid unless one of the following conditions occurs over the coming sessions:
Yield Breakout Reversal: The 10-year Treasury yield sustains a drop below 4.50% (driven by weakening economic data or energy price drops).
Fed Repricing: September FOMC hike odds collapse below 40% following Friday’s BLS Employment Situation Report.
Hardware Relief: Primary reports or foundry announcements indicate sequential easing in advanced-node/memory supply constraints earlier than projected.
Related Reading
How to Analyze Earnings Reports with AI
Understanding Market Breadth with AI
How to Build a Pre-Market Briefing with AI
Disclaimer: This article is an educational analysis of market data and macro scenarios for informational purposes only. It is not investment, financial, legal, or tax advice, and is not a recommendation or solicitation to buy, sell, or hold any security or to adopt any investment strategy.