
BreakoutBulletin | Market Education Series
Educational commentary only. Not investment advice. Past performance does not guarantee future results.
The Single Biggest Drag on Trading Performance Nobody Talks About
Most trading education focuses on finding better setups, improving entry timing, reducing losses. The implicit assumption is that the primary constraint on performance is setup quality - find better trades, get better results.
That assumption is partially correct. But it misses the single most powerful lever available to any trader with a positive-expectancy system: position sizing based on conviction.
Consider two traders using identical setups with identical win rates and identical average R:R. Trader A sizes every position at 1% risk regardless of setup quality. Trader B sizes at 0.5% risk on standard setups and 2% risk on the highest-conviction setups - the ones where macro alignment, sector leadership, technical structure, and volume confirmation all arrive simultaneously.
Over 100 trades, assuming a 60% win rate and 2:1 average R:R, Trader A generates consistent but modest returns. Trader B, using the same setups but allocating aggressively when conviction is highest, generates substantially larger returns from the same analytical work - because the best setups are sized to actually move the portfolio.
This is the power momentum framework. Not a new setup. Not a new pattern. A systematic methodology for identifying when multiple independent confirmation factors align simultaneously - and a direct, rules-based approach for sizing those setups appropriately without emotional override.
Q&A: RS vs RSI - The Critical Distinction (FAQ Schema)
Q: Is Relative Strength (RS) the same as RSI?
A: No. While they share a name, Relative Strength (RS) compares a stock’s performance against a benchmark like the S&P 500, whereas the Relative Strength Index (RSI) measures a single stock's internal price momentum to identify overbought or oversold conditions.
Q: What is a good RS Rating for a stock?
A: In the William O'Neil methodology, an RS Rating above 80 is considered strong, indicating the stock is outperforming 80% of the market. Top-tier "true market leaders" often maintain an RS Rating of 90 or higher.
Q: Should I use RS or RSI for swing trading?
A: For swing trading, RSI is often used to time entries and exits. However, RS is essential for selecting which stocks to trade, as it ensures you are only focusing on the strongest names in the market.
RS vs RSI: The Comparison Table (Don't Get These Confused)
I’ve seen too many traders mix these up. Here’s the side-by-side:
| Feature | Relative Strength (RS) | Relative Strength Index (RSI) |
|---|---|---|
| Purpose | Measures stock performance vs a benchmark (S&P 500) | Measures internal price momentum (overbought/oversold) |
| Calculation | Stock Price ÷ Index Price | Average gain vs average loss over 14 periods |
| Primary Use Case | Screening for market leaders (which stock to trade) | Timing entries/exits (when to trade) |
| William O'Neil | Core of CANSLIM - RS Rating > 80 for leaders | Not used in O'Neil methodology |
| Range | No fixed range - line goes up or down | Fixed 0-100 scale (overbought >70, oversold <30) |
| What a “New High” Means | Stock is outperforming the market - institutional accumulation | Stock is overbought - potential reversal |
For this strategy, ignore RSI. Focus entirely on the RS Line. A stock can have an RSI of 75 and still be a screaming buy if the RS line is making new highs during a base. That’s the power momentum signal.
What "Power Momentum" Actually Means
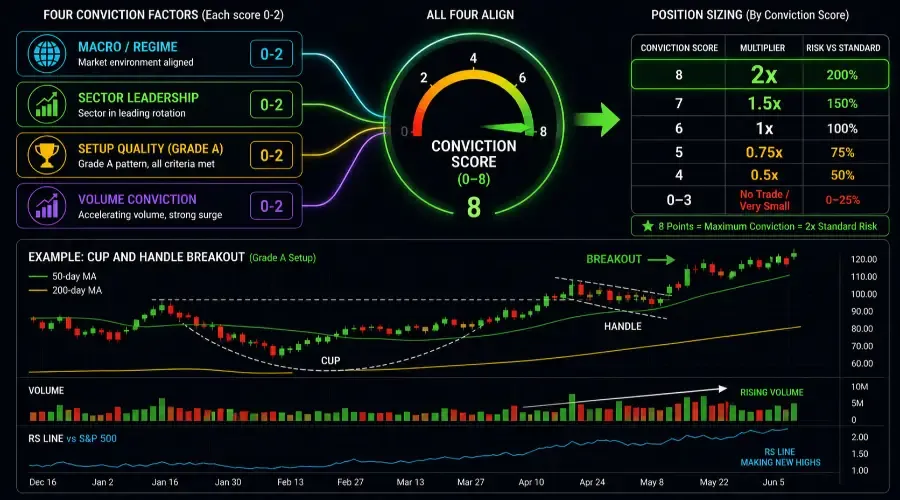
Power momentum is not a specific chart pattern. It is a convergence state - a configuration where four distinct analytical factors from four different domains are all pointing in the same direction simultaneously.
The four factors are:
Factor One - Macro and Regime Alignment
Factor Two - Sector Leadership
Factor Three - Setup Quality
Factor Four - Volume Conviction
When all four factors are present at maximum quality simultaneously, the setup is not just a good trade - it is a power momentum configuration. It deserves different treatment than a standard setup where one or two factors are present and the others are marginal.
The power momentum framework exists to answer the question every trader faces but rarely answers systematically: when should I size up? The answer is not "when I feel confident" - feeling confident is a psychological state that correlates poorly with objective setup quality. The answer is "when the objective factors score at maximum" - a measurable, reproducible determination that removes the emotion from the most important sizing decision in active trading.
The Four-Factor Conviction Scoring System
Each of the four factors is scored independently on a 0-2 scale. The maximum total score is 8. The position sizing table maps directly to the score - higher score, larger position.
Factor One: Macro and Regime Score (0-2 points)
| Regime Condition | Score |
|---|---|
| Full risk-off - regime score 0 or 1 | 0 points |
| Selective risk-off - regime score 2 | 1 point |
| Full risk-on or selective risk-on - regime score 3 | 2 points |
Factor Two: Sector Leadership Score (0-2 points)
| Sector Condition | Score |
|---|---|
| Sector in active distribution - institutional selling dominant | 0 points |
| Sector neutral - no clear rotation signal | 1 point |
| Sector in active leading rotation - Participation Heatmap confirms | 2 points |
Factor Three: Setup Quality Score (0-2 points)
| Setup Condition | Score |
|---|---|
| Grade C or no recognisable setup | 0 points |
| Grade B - most but not all criteria met | 1 point |
| Grade A - all criteria met, no marginal qualifications | 2 points |
Factor Four: Volume Conviction Score (0-2 points)
| Volume Condition | Score |
|---|---|
| Volume at or below 50-day average at breakout | 0 points |
| Volume meets minimum market-cap-tier threshold (30-40% above 50-day avg) | 1 point |
| Volume significantly exceeds threshold AND shows accelerating progression in prior sessions | 2 points |