
A five-step relay. Four market regimes. One reusable lens for reading any oil-and-rates episode.
By Manish T. · BreakoutBulletin
A sharp move in crude rarely stays in the energy aisle.
It travels–through inflation expectations, into bond yields, into equity valuations, and finally into sector rotation.
Understanding that chain is one of the most reusable skills in macro, because it fires again every time geopolitics flares or energy prices lurch.
This is a mechanism, not a forecast.
Once you can see the loop, you can read almost any oil-and-rates episode without waiting for someone to explain it to you.
Here's how the pieces connect–and, just as important, how the connection changes across different market regimes.
The Loop, in Five Steps
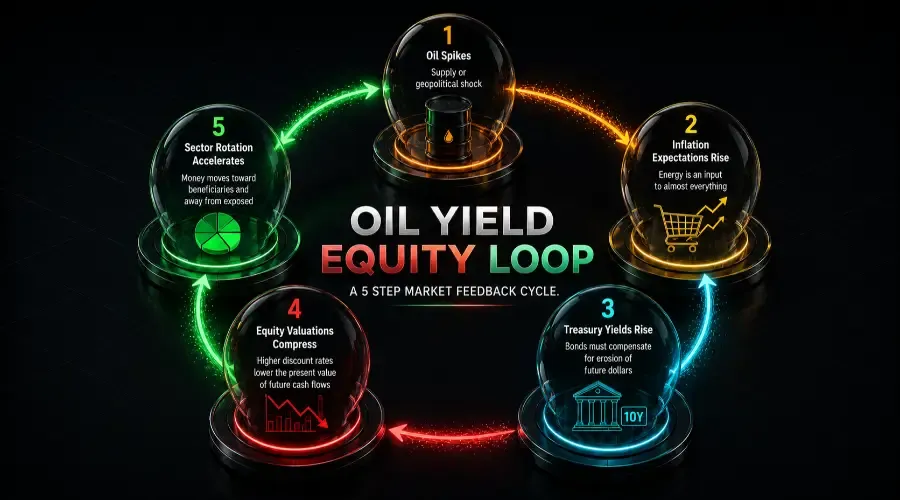
At its simplest, the loop is a five-step relay:
Oil spikes – a supply or geopolitical shock.
Inflation expectations rise – energy is an input to almost everything.
Treasury yields rise – bonds must compensate for the erosion of future dollars.
Equity valuations compress – higher discount rates lower the present value of future cash flows.
Sector rotation accelerates – money moves toward beneficiaries and away from the most exposed.
Then it loops : the rotation and the shift in risk appetite feed into the next move.
The key word is reflexive.
This isn't a one-way street; it's a feedback loop that can amplify itself in either direction.
How the Loop Has Actually Moved (By the Numbers)
Here's the quantitative reality–how the loop has translated in recent episodes:
| Oil Shock Magnitude | Typical 5Y Breakeven Move | Typical 10Y Yield Move | Typical S&P 500 P/E Compression | Historical Context |
|---|---|---|---|---|
| +20–25% (geopolitical) | +15–25bps | +20–40bps | -0.5 to -1.0x | 2022 Ukraine invasion |
| +10–15% (OPEC cut) | +5–10bps | +5–15bps | -0.2 to -0.4x | 2023 Saudi production cuts |
| +5–10% (demand-driven) | Flat or falling | Flat or falling | Minimal to positive | 2024 Chinese stimulus hopes |
Case Study: The 2022 Ukraine Invasion
When Brent spiked from ~$90 to ~$120 in March 2022:
- 10-year breakevens rose from ~2.5% to ~3.0%
- 10-year Treasury yields rose from ~1.8% to ~2.5% by May
- The Nasdaq (long-duration growth) fell ~15% while the Dow (value) fell ~5%
- Energy rose ~25%; airlines and transports fell ~10%
This wasn't noise - it was the loop running in real time.
The Sector Map: A Simple Matrix
Forget the sprawling sector table.
The loop's sector impact boils down to two variables: duration risk (how far in the future a company's cash flows sit) and input-cost sensitivity (how much fuel or oil-derived materials it burns).
| Low Input-Cost Sensitivity | High Input-Cost Sensitivity | |
|---|---|---|
| Long Duration (high growth) | Mega-cap SaaS (MSFT, ORCL) – yields hurt multiples, but margins are insulated | Unprofitable / speculative tech – worst of both worlds: multiple compression + no cushion |
| Short Duration (value / mature) | Energy producers – pure revenue tailwind; no input-cost drag | Airlines, trucking, chemicals – direct margin squeeze from fuel or feedstock costs |
Pricing power is the modifier: Within any box, companies that can pass through higher costs (P&G, defense contractors with cost-plus contracts) perform better than those that cannot (discount airlines, commoditized industrials).
And banks?
They don't fit neatly into this matrix.
They care about the shape of the curve.
A steepening curve (long yields rising faster than short yields) expands net interest margins and helps banks.
A flattening or inverted curve–where higher oil just pushes the long end up while the Fed holds the front end–actually hurts them.
The signal for banks is the 2s10s spread, not oil itself.
Variation by Regime: Four Scenarios
The loop is a framework, not a law.
How it expresses itself depends entirely on the regime:
| Regime | What's Driving Oil? | What Happens to Yields? | Equity Impact | Typical Context |
|---|---|---|---|---|
| Supply Shock | Geopolitics, OPEC, outages | Rise (inflation expectations + risk premium) | Broadly negative; growth stocks hit hardest | 1973, 1979, 1990, 2022 |
| Demand Boom | Strong global growth (especially China) | Rise (growth + higher real rates) | Broadly positive; cyclicals and energy lead | 2004–2006, 2021 reopening |
| Growth Scare | Demand destruction (recession fears) | Fall (flight to safety) | Broadly negative; defensives outperform | 2008, 2020 COVID crash |
| Fiscal / Debt Shock | Mixed or flat | Rise (term premium / deficit fears) | Negative; pressure independent of oil | 2023 US downgrade, bond vigilante episodes |
The critical skill: diagnose the regime before you apply the loop.
A supply-driven oil spike and a demand-driven oil spike look identical on the WTI screen.
They produce diametrically opposite portfolio outcomes.
The Monitoring Dashboard
Five indicators tell you most of what you need about which way the loop is running and how hard:
| Indicator | What It Tells You |
|---|---|
| WTI / Brent crude | The shock itself |
| 5Y / 10Y Breakeven Inflation | The live link between oil and yields |
| 2Y & 10Y Treasury yields | The rate response; front end = Fed path, long end = inflation + term premium |
| U.S. Dollar Index (DXY) | Cross-check: strong dollar = rate-driven move |
| VIX | Is this just rotation, or is the market stressed? |
Watch them together, because the signal is in how they move relative to each other, not in any single reading.
When the Loop Breaks: The Sharp Version
This is the article's best differentiator.
The loop is powerful–but it fails in specific, identifiable ways.
Here's when to throw the framework out or invert it:
| Break Condition | Why It Breaks | What to Watch Instead |
|---|---|---|
| Demand-driven oil drop | Oil falls because of growth fears, not supply relief. Yields fall on flight-to-safety, not easing inflation. | Falling oil + falling yields + falling equities = recession signal, not relief |
| Fed is actively cutting rates | Yields may not rise even on an inflation impulse, because the Fed's commitment to ease overrides the signal | Forward guidance; 2Y yield vs. Fed funds |
| Central bank policy error | If the Fed treats a supply shock as "transitory" when it's not, the loop runs late–and hard | Core inflation persistence; wage growth; breakevens vs. realized inflation |
| Fiscal dominance | Long yields rise on deficit concerns, not inflation. Oil may be flat while yields spike. | Primary deficit; 10Y term premium; sovereign CDS |
| Risk-premium-only shock | Oil may not spike (if supply is unaffected), but equity risk premium rises anyway | VIX + gold + FX safe havens; oil not moving with equities |
The practical rule: Before assuming the loop is running its standard direction, ask two questions in order:
- Why is oil moving–supply or demand?
- What is the Fed doing or signaling–and does the market believe them?
Get those two wrong, and every downstream read is wrong too.
The China Factor
Any serious macro reading of oil and yields needs to acknowledge that China is the swing demand factor.
The country consumes over 16% of global oil demand and is the marginal buyer.
When Chinese PMI data surprises to the upside, oil and global yields often rise together–but this is a demand-driven rise, which supports cyclicals rather than punishing the broad market.
The practical takeaway: Before you assume an oil move is a "supply shock" loop, check Chinese data.
A strong China PMI print is a regime-defining signal.
The Full Cycle: Growth Sacrifice and the Reversal
The loop doesn't end at sector rotation.
There is a longer, slower, and more consequential chapter:
Oil spike → Inflation and yields surge → Fed aggressively tightens → Growth slows → Demand destruction for oil → Oil falls → Yields fall → Equity recovery
This is the 1970s stagflation dynamic, and it's precisely what played out in 2022–2023: the Fed hiked aggressively, recession fears mounted, and oil fell from $120 back toward $70 within a year.
The investing implication: Oil spikes are often more bearish in the long run than they appear in the moment.
They contain the seeds of their own destruction via Fed reaction.
The full cycle is why a "buy the dip" response to an oil spike is often premature–but a "buy the dip" response to the recession that follows the oil spike is often exactly right.
Has the Loop Changed?
The mechanism still works–but the speed, amplitude, and sector sensitivity have shifted.
The loop is not broken; it's just faster, more automated, and occasionally hijacked by fiscal policy.
The old "wait for the secondary effects" mindset no longer applies; today, the loop is often fully priced within a single session.
The skill lies not in catching the move, but in distinguishing whether it's a real supply shock, a demand reflation, or a debt/fiscal shock wearing an oil costume.
The Bigger Picture
The oil–yield–equity loop is really a lesson in how modern markets are wired: nothing trades in isolation.
An energy shock is an inflation event is a rates event is a valuation event is a rotation event–one impulse, five expressions, often within a single session.
The traders who look calm during these episodes aren't guessing; they're watching the chain.
They check whether oil is supply- or demand-driven.
They check breakevens.
They check the dollar.
They check VIX.
And they know that banks need a steep curve, not just higher yields; that not all tech is created equal; that China's PMI matters more than OPEC's press release; and that the Fed's reaction function is the secret ingredient that can invert the entire loop.
Learn to trace it once and you've built a reusable lens.
The skill isn't predicting the shock; it's knowing exactly how it will travel once it lands.
Related Reading
Financials Sector Analysis: A Hawkish Fed Hold and a 19-Year-High Long Bond → https://www.breakoutbulletin.com/article/financials-sector-analysis-fed-rate-hold-xlf
Wall Street's Closing Auction Keeps Breaking Records (Market Structure) → https://www.breakoutbulletin.com/article/closing-auction-liquidity-fragmentation-etf-dark-pools
Disclaimer
BreakoutBulletin publishes educational and analytical content only. Nothing here is investment, financial, legal, or tax advice, or a recommendation or solicitation to buy, sell, or hold any security. This article describes general market mechanisms, not guidance for any individual or any specific security. Past performance does not indicate future results, and relationships between assets can change or break down. Readers should conduct their own research and consult a qualified, registered financial adviser before making any decision.
Data Sources
- Bloomberg / LSEG – Treasury breakeven and yield data (2022–2026)
- EIA / IEA – Global oil demand and China consumption figures
- Federal Reserve – Historical Fed funds target and forward guidance transcripts
- S&P Dow Jones Indices – Sector performance data (2022 Ukraine invasion period)
- BIS – Research on passive flows and market transmission speed (2025)
- FRED – 10Y yield, DXY, and breakeven time series