
What Actually Happened
Between May 14 and 18, 2026, U.S. markets experienced a swift, interconnected sequence of cross-asset events that worth understanding clearly. This wasn’t just a localized patch of volatility; it was a textbook manifestation of a macro transmission chain that tends to repeat when financial conditions tighten.
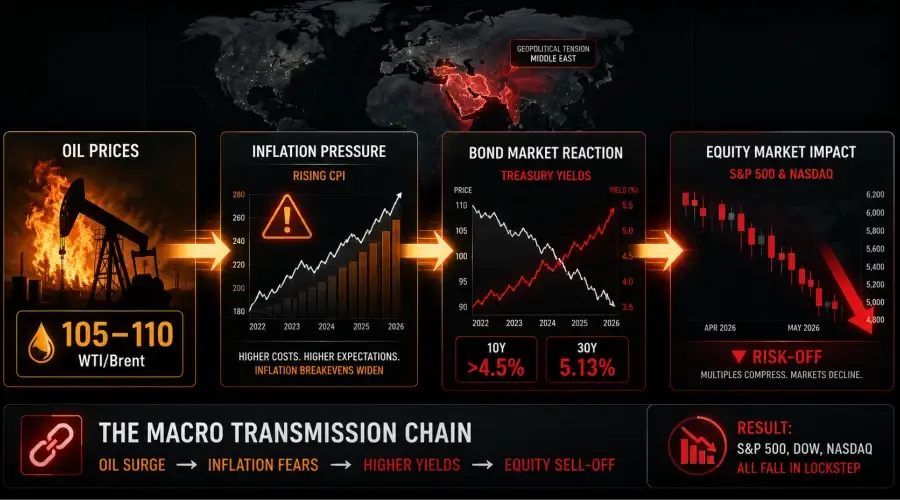
Crude oil prices climbed aggressively, with West Texas Intermediate (WTI) breaking past $105 per barrel and Brent crude touching the $109–$110 range. This surge immediately pushed inflation fears back into sharp focus for market participants. The bond market reacted via a sharp selloff, driving Treasury yields significantly higher across the curve.
Higher discount rates quickly pressured equity valuations–particularly long-duration technology and growth stocks. The final result: the S&P 500 posted its biggest single-day drop since March, the Dow Jones Industrial Average shed over 500 points on Friday, May 15, and Nasdaq futures plummeted over 1.2%.
Major financial outlets–including Bloomberg, the Wall Street Journal, CNBC, and Reuters–independently confirmed this identical sequence of events. When multiple independent tracking desks report the exact same cause-and-effect mechanism, it indicates that a real macro regime signal is shifting the market, rather than a single-source anomaly.
Let’s break down how each piece of this transmission chain connected to the next.
The Starting Point: Why Oil Triggered This
During this window, oil wasn't just an isolated energy story; it functioned as a leading inflation signal.
When WTI crosses $105 and Brent approaches $110, the impact does not stay confined within the energy sector. Instead, it feeds directly into forward-looking inflation expectations across the broader market. It impacts downstream transportation costs, influences corporate profit margins, raises the Consumer Price Index (CPI) inputs monitored by the Federal Reserve, and widens inflation breakevens in the fixed-income market.
Reporting from Reuters highlighted mounting Middle East geopolitical risk as the primary catalyst behind the sudden crude oil squeeze. This supply-side pressure collided directly with a fresh batch of macro data on Friday morning, May 15, showing hotter-than-expected import prices and firming manufacturing input costs. The two inputs arrived simultaneously and pointed in the exact same direction: inflation pressures are proving stickier than the market had anticipated.
Consequently, fixed-income investors immediately demanded a higher term premium to hold U.S. Treasuries. The combination of persistent energy inflation and stubborn raw data effectively compressed the Federal Reserve's runway to implement projected rate cuts. When the fixed-income market senses that the policy pivot is being delayed or pushed further out, duration-sensitive assets reprice instantly. That repricing is what spilled over from bonds into the equity markets.
The Transmission Chain, Step by Step
A common mistake among retail traders is viewing equity market drops in isolation, missing how momentum actively travels across asset classes before hitting stock indices.
The precise cross-asset mechanism moved through the following structural sequence:
[Geopolitical Risk + Hot Import Data]
               │
               ▼
   [Crude Oil Sustained > $105-$110]
               │
               ▼
[Inflation Breakevens Widening & Expectations Tick Higher]
               │
               ▼
[Bond Market Selloff: Investors Demand Higher Term Premium]
               │
               ▼
[10-Yr Yield Crosses 4.5% | 30-Yr Yield Spikes to 5.131%]
               │
               ▼
[Real Yields (TIPS) Rise + Equity Discount Rates Shift Up]
               │
               ▼
[Nasdaq & S&P 500 Futures Drop > 1% Pre-Market]
               │
               ▼
[Cash Equities Open Under Pressure -> Broad Breadth De-leveraging]
The Friday Dow drop of over 500 points on May 15 was the first highly visible equity shock in this chain. Follow-up macro coverage on May 17–18 confirmed that this yield-driven pressure did not resolve quickly over the weekend–it extended right into the consecutive trading week. This persistence is vital: a single-day drop that reverses immediately is noise, but a move that holds and extends across multiple sessions represents a true regime signal.
What the Other Markets Were Doing
Treasury Yields & The Real Rate Dynamic
The 10-year Treasury yield aggressively crossed the 4.5% threshold. Concurrently, the 30-year yield hit 5.131%–marking its highest level since May 2025. Crucially, this selloff was not isolated to the short end of the curve; it hit the full duration spectrum, proving it was a comprehensive macro repricing rather than a temporary technical blip.
Furthermore, this move was driven by a rise in both nominal yields and real yields (Treasury Inflation-Protected Securities, or TIPS). When real yields spike, the hurdle rate for taking equity risk jumps instantly, applying a direct mathematical squeeze to equity multiples.
Crude Oil
With WTI trading comfortably above $105 and Brent tapping the $110 level, crude oil acted as the ultimate macro input. It is important to note that oil price spikes do not always trigger equity corrections uniformly across history; rather, oil acts as a systemic risk accelerator when it occurs in a highly sensitive, restrictive Federal Reserve environment where market valuations are already stretched.
Equities and Market Breadth
The Dow, S&P 500, and Nasdaq all declined in unison. When all three major indices drop sharply together, it signals broad risk-off asset liquidation rather than a healthy sector rotation. Investors weren't taking capital out of tech to buy defensive havens; traditional low-beta sectors like Utilities and Consumer Staples fell alongside growth names.
Technology and high-growth stocks led the downward move. This aligns perfectly with basic financial theory: because tech and growth names have cash flows weighted far into the future, they possess high duration sensitivity. When discount rates rise due to a real yield spike, those future cash flows are worth less today, triggering a sharp contraction in stock prices.
One Thing Worth Noting: Sequencing and Lag
Market analysis from May 18 highlighted an interesting divergence: the intense fixed-income selloff showed signs of stabilizing at the margin, even as stock indices continued to grind lower and Brent crude held firmly near $110.
This divergence–yields flattening while equities remain under pressure–is a common sequencing pattern during macro risk repricings. The bond market is highly institutional, extraordinarily liquid, and typically adjusts to incoming inflation risk first. Equities often lag by 24 to 72 hours. This occurs because equity fund managers require several sessions to systematically rebalance portfolios, adjust risk-parity exposures, and manage liquidity constraints or margin requirements. The fact that stocks were still sliding on May 18 while yields stabilized does not invalidate the chain; it simply highlights that equities were still catching up to the bond market's initial shock.
The Structural Takeaways
Analyzing this market episode reveals several core macro realities:
The Inflation-Yields-Equity Chain is Alive and Active: This remains the dominant transmission mechanism governing the current market cycle. Despite periods of relative equity calm, market multiple sensitivity to fixed-income pressure has not diminished.
Oil is a Systemic Risk Asset: When crude oil moves past critical price ceilings, it functions as a macroeconomic trigger that alters equity risk premiums and bond math. It is completely relevant to market strategists who do not trade commodities directly.
Breadth Contraction Signals De-leveraging: The lockstep drop across defensive and growth spaces alike confirms that institutional fund managers were executing absolute risk reduction, prioritizing cash preservation over sector positioning.
How Different Portfolios are Positioned
Growth and Tech-Heavy Allocations
This episode serves as an explicit reminder of the underlying duration risk embedded in growth valuations. When macro inputs push yields higher, equity multiples reprice rapidly. Diversifying by understanding your true duration exposure is crucial.
Direct Fixed-Income Holdings
Spiking nominal yields cause immediate mark-to-market losses on existing long-duration bond positions, even though the higher yielding environment improves the yield-to-maturity outlook for fresh capital allocations.
Diversified Portfolios
Inflation-driven shocks complicate traditional diversification. Because rising inflation expectations push bonds and stocks down simultaneously, the classic inverse correlation between equities and fixed-income breaks down, causing asset class correlations to rise across the board.
The Bigger Picture
This cross-asset episode doesn't mark the birth of a new market regime; rather, it confirms the persistence of the current one.
Inflation risks remain unresolved, the Federal Reserve's policy path remains highly sensitive to commodity shocks, and the bond market continues to wield immense gravity over stock market valuations. While these events cannot predict where the market moves next, they prove that the transmission chain connecting energy costs to macro risk appetite is fully intact, operational, and ready to activate the next time oil makes a move.
Q: Why do rising oil prices trigger a selloff in the stock market?
A: Oil operates as a major systemic inflation signal. When crude prices scale above key thresholds (like WTI crossing $105 or Brent hitting $110), it increases transportation and manufacturing costs across the broader economy. This causes inflation expectations to tick higher, forcing the bond market to reprice and putting immediate pressure on equity valuations.
Q: How do higher Treasury yields impact growth and tech stocks specifically?
A: High-growth and technology companies are considered long-duration assets because their peak cash flows are weighted heavily toward future years. Financial analysts value these companies using a discount rate based on current bond yields. When nominal and real yields spike, the discount rate goes up, which sharply reduces the present value of those future earnings, forcing a downside repricing.
Q: What is the difference between sector rotation and a broad market risk-off event?
A: In a sector rotation, investors pull capital out of one area (like tech) and move it into another (like defensives or consumer staples), causing indices to diverge. In a broad macro risk-off event, market breadth contracts completely–the Dow, S&P 500, and Nasdaq all fall together in lockstep as fund managers systematically reduce overall equity exposure.
Q: Why do stocks continue to fall even after bond yields begin to stabilize?
A: This is a standard sequencing delay in the financial markets. The bond market is highly sensitive and typically reprices macro risk first. Equities often lag because institutional fund managers require multiple trading sessions to work through large-scale positioning adjustments, systematic risk-parity rebalancing, and margin calls.