
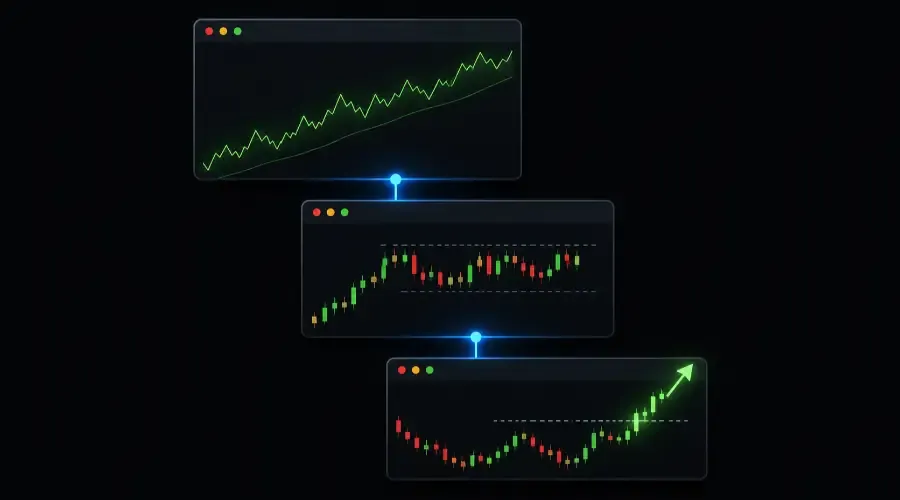
Most traders look at one chart. They pick a timeframe – usually the daily – find a setup that looks clean, and take the trade. What they often don’t check is whether the weekly chart is fighting against them or whether the intraday structure is actually ready to trigger.
That disconnect is where a lot of technically correct trades go wrong at the wrong moment. Multi-timeframe analysis – looking at the same stock across two or three different timeframes before entering – is the habit that closes that gap. And AI makes it faster to run properly than doing it manually.
Multi-timeframe analysis is the third of five technical analysis tasks in this hub. Technical Analysis with AI gives the overview and covers what AI does and doesn't do in technical work before you get into the specifics.
Why Timeframe Alignment Actually Matters
Here’s the core idea: each timeframe tells you something different.
The weekly chart sets the bigger picture. Is the stock in a long-term uptrend or a downtrend? Where is it relative to its 200-week moving average? What’s the broad direction of the momentum? This is the map.
The daily chart shows the current setup. Is there a consolidation forming? Is the stock pulling back to a key level within the broader trend? Is a pattern completing? This is where most traders do most of their analysis.
The 4-hour or 1-hour chart shows the immediate entry opportunity. Is there a specific trigger forming – a breakout from a tight range, a bounce off support with volume picking up? This is where the entry gets precise.
When all three are pointing in the same direction, the trade has the wind behind it. When they’re fighting each other, you’re taking on extra risk that isn’t always priced into your stop.
The Three-Timeframe Approach
The standard framework most swing traders use breaks down like this:
Weekly – the trend filter. If the weekly chart is in a clear uptrend, you’re looking for long setups on the daily. If the weekly is in a downtrend or deeply extended, you need a strong reason to be positioned long on the daily. The weekly doesn’t give you an entry – it gives you permission (or a warning).
Daily – the setup timeframe. This is where you identify whether a trade is actually worth considering. Pullbacks to moving averages, consolidation bases, breakout setups – these live on the daily chart. The setup has to make sense here before you move down to the shorter timeframe.
4-hour or 1-hour – the entry trigger. Once the weekly says the trend is right and the daily says the setup is right, the shorter timeframe shows you when to actually get in. A tight consolidation breaking out on the 4-hour, RSI resetting from oversold on the 1-hour – these are the precise trigger signals that tell you the entry is ready rather than just possible.
The Alignment Rule
Before you enter any trade, at least 2 of the 3 timeframes should support the trade direction.
Not 3-of-3 – that’s often too strict and means you’ll miss valid setups where one timeframe is neutral rather than outright against you. But 1-of-3 isn’t enough either. If only the daily is bullish and both the weekly and the intraday are sending mixed signals, the setup isn’t ready.
The 2-of-3 rule gives you a clear, binary test before you enter. Either you pass it or you don’t.
However, there is an important constraint: the higher-timeframe trend filter – the weekly – must be either supportive or neutral. It should never actively fight the trade. A bullish daily and hourly setup cannot override a hostile macro weekly trend. If the weekly chart is in a clear downtrend, even a strong daily pattern and a clean 4-hour trigger don’t make the trade a 2-of-3 pass for a long. The weekly effectively holds veto power when it is in direct conflict with the trade direction.
Timeframe alignment is the structural confirmation. Volume confirmation tells you whether the move has participation behind it. How to Analyze Volume and Market Breadth Data with AI covers how to add the volume layer so the full picture is in front of you before you enter.
Running a three-timeframe analysis requires formatting three separate data sets correctly. What to Paste into AI for Chart Analysis covers the OHLCV table structure, indicator formatting, and text description approach that makes multi-timeframe input work.
How to Structure the Multi-Timeframe AI Prompt
AI can’t read your charts directly in its standard form – as covered in What to Paste into AI for Chart Analysis, you need to describe what you’re seeing and provide the underlying data. For a multi-timeframe analysis, that means structuring your input in three separate sections, one for each timeframe.
The prompt format that works:
“Act as a technical analyst reviewing a potential swing trade in [ticker] across three timeframes. I’ll describe each timeframe below.
Weekly timeframe: [describe the trend structure, key moving averages, where price sits relative to prior highs/lows, RSI reading, recent volume behaviour]
Daily timeframe: [describe the setup – what pattern or structure is forming, price relative to 20-day and 50-day EMAs, indicator readings, recent price behaviour in detail]
4-hour timeframe: [describe the immediate price action – consolidation range, RSI level and direction, any trigger forming, volume behaviour in the most recent sessions]
Based only on the information I’ve provided:
(1) Identify whether the three timeframes are aligned, in partial conflict, or in full conflict – and state specifically what each timeframe suggests about the trade direction.
(2) Apply the 2-of-3 alignment rule (with the weekly veto constraint described above) – does this setup currently pass?
(3) Identify the specific trigger on the shorter timeframe that would signal the entry is ready.
(4) State the level that would invalidate the setup based on the daily chart structure.
No directional recommendation – frame this as a confirmation assessment.”
Pro-Tip for Visual Traders: If you are using a multimodal AI that can process images, you can take a single clean screenshot of your multi-timeframe layout (Weekly, Daily, 4H side-by-side) from TradingView, upload it, and use the exact same prompt structure. The AI will cross-reference the visual patterns with any text descriptions you include. This can speed up the process, but the discipline of writing out your observations remains valuable – it forces you to verify what you think you see.
AMD in Q4 2024 – A Three-Timeframe Walkthrough
Here’s what the multi-timeframe process looked like in practice on AMD during Q4 2024, a period when semiconductor stocks were broadly in favour following AI infrastructure demand momentum.
Weekly timeframe: AMD was in an established long-term uptrend – higher highs and higher lows over the prior 18 months. The stock was above its 200-week moving average. RSI on the weekly was around 58, which is neutral-to-positive territory. No exhaustion signals. The weekly said: trend is intact, nothing to argue against a long setup.
Daily timeframe: After a run higher, AMD had pulled back roughly 12% from its recent high over 8 trading sessions and was sitting right at the 21-day EMA – a level that had acted as dynamic support during prior pullbacks in the trend. Volume on the pullback days was below average, which is what you want to see in a healthy consolidation. RSI on the daily had reset from 68 down to 48. No breakdown. Just a normal correction within an uptrend.
4-hour timeframe: On the 4-hour chart, AMD had been trading sideways in a roughly $8 range for 4 sessions, with RSI hovering between 42 and 50 – resetting but not oversold. No major sell-side volume. A tight consolidation forming right at the daily EMA support.
The prompt was sent to Claude with all three descriptions included.
What Claude identified:
Timeframe alignment: The weekly and daily were both supportive of a long position – trend intact on the weekly, healthy pullback to key support on the daily. The 4-hour was neutral, not yet showing a directional trigger but not contradicting the longer-term picture either.
2-of-3 alignment rule assessment: Pass. Two of three timeframes (weekly and daily) supported the bullish thesis. The 4-hour was neutral, which is not the same as being against the trade. Crucially, the weekly was supportive – no veto in play.
Entry trigger on the 4-hour: A break above the upper boundary of the 4-hour consolidation range on above-average volume within that timeframe – price would need to reclaim momentum rather than drift higher passively.
Invalidation level: A daily close below the 50-day EMA, which sat roughly $9 below the current price at the time. A close there would suggest the pullback had become something more structural and the daily setup had failed.
What the trader did with this:
The timeframe analysis confirmed the setup was worth watching but not yet ready to enter. The 4-hour trigger hadn’t fired. Rather than chasing the daily setup, the trader set a price alert at the top of the 4-hour range and waited. When AMD broke that level two days later on volume, the entry triggered cleanly with a stop placed just below the 50-day EMA identified as the invalidation level.
The AI analysis didn’t generate the trade. It confirmed the structural logic across three timeframes, applied a clear rule, and defined the specific conditions for both entry and exit. The trader still made the call.
When Timeframes Conflict
Not every multi-timeframe review ends with a pass. Sometimes the weekly is bearish while the daily is setting up a long. Sometimes the daily has a great-looking pattern but the 4-hour is showing exhaustion rather than consolidation.
When timeframes conflict, AI helps you frame the risk – it doesn’t resolve the conflict.
A weekly downtrend with a bullish daily setup isn’t an automatic pass on the 2-of-3 rule, even if the 4-hour also turns bullish. That’s exactly the scenario where the weekly veto applies: the bigger trend is hostile, so the trade is effectively fighting the macro structure. You might still take it at reduced size if the daily and 4-hour signals are exceptionally strong, but you do so aware that the weekly permission is absent. AI can articulate the conflict clearly – but the risk decision is yours.
What you should never do is cherry-pick the timeframe that supports what you already want to do and call that research. The three-timeframe process works because it’s systematic – you look at all three and let the alignment (or conflict) emerge from the data, not from your bias going in.
Building Multi-Timeframe Analysis Into Your Process
This analysis fits into the pre-trade evaluation stage – after you’ve identified a potential setup on the daily but before you enter.
For most swing traders, it adds 15 to 20 minutes per setup when done properly. That time pays for itself by filtering out entries where the timeframe picture is mixed, keeping you out of trades where you’d be fighting the broader structure.
For data sourcing and formatting guidance, Technical Analysis with AI covers the hub overview, and What to Paste into AI for Chart Analysis covers exactly how to format OHLCV data and indicator readings for each timeframe before they go into the prompt.
The setup structures that benefit most from multi-timeframe confirmation – pullbacks to moving averages, base breakouts, range compressions – are covered in depth in our Trading Setups & Patterns pillar. That’s the right reference for understanding what each pattern requires across timeframes before you describe it in an AI prompt.