
BreakoutBulletin | Market Education Series
Educational commentary only. Not investment advice. Past performance does not guarantee future results.
Why Moving Averages Work - The Mechanism, Not the Myth
Moving averages are the most widely used technical tool in existence. That ubiquity is both their strength and their trap. Because so many participants watch the same levels simultaneously, moving averages become self-fulfilling - institutional algorithms, retail traders, and systematic funds all reference the same lines, creating concentrated order flow at those levels when price returns to them.
But "self-fulfilling" is not the full explanation. Each of the four EMAs covered in this guide works for a different reason, serves a different participant type, and requires a different trading approach. Treating them as interchangeable - using the 8 EMA the same way you use the 200 EMA - is the most common moving average mistake and the primary source of losses for traders who understand the concept but misapply it.
The 8 EMA is a short-term momentum tool used by active day traders and swing traders in strong trending stocks.
The 21 EMA is the intermediate trend reference used by institutional desks for position management.
The 50 EMA is the medium-term trend filter used by fund managers and swing traders as a primary trend indicator.
The 200 EMA is the long-term institutional benchmark - the line that separates bull markets from bear markets in the minds of the largest capital allocators in the world.
Each line attracts different participants. Each bounce carries different characteristics. Each requires different confirmation, different stops, and different position sizing.
The Hierarchy of Moving Averages (Enhanced Content Structure)
Not all EMAs are created equal. To trade successfully, you must match the line to the participant type:
8 EMA: The Momentum Pulse - Used by day traders and active swing traders. Requires a regime score of 3 (full risk-on). The fastest line, with the tightest stops but the highest regime sensitivity.
21 EMA: The Institutional Manager - Used by portfolio managers for position allocation. Reliable at regime score 2-3. Serves as an add-level for funds actively managing existing positions.
50 EMA: The Medium-Term Filter - Used by swing traders and fund managers as a primary trend reference. The most regime-resilient EMA bounce, viable at score 2 in leading sectors.
200 EMA: The Long-Term Benchmark - Used by pensions, systematic funds, and the largest capital allocators. The deepest demand level, requiring wider stops but offering the highest success rate at regime score 3.
Q&A: Moving Average Bounce Mechanics (FAQ Schema)
Which moving average is most important for institutional traders?
The 200-day EMA is the primary benchmark for the largest capital allocators. It acts as the definitive "bull/bear" line. When a stock in a long-term uptrend touches a rising 200 EMA, it represents the deepest concentration of institutional demand.
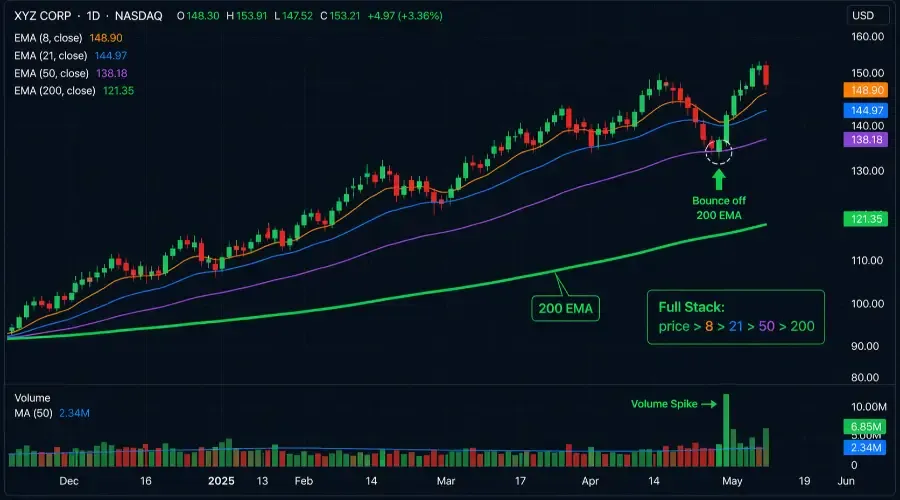
What is a "Full Stack" moving average alignment?
A "Full Stack" occurs when the faster EMAs are positioned above the slower ones in sequence: price > 8 EMA > 21 EMA > 50 EMA > 200 EMA. This alignment confirms that the trend is healthy across every timeframe simultaneously. In backtest, full stack alignment added 5-7 percentage points to success rates across all EMAs.
Can I trade an 8 EMA bounce in any market environment?
No. The 8 EMA is a high-momentum tool that requires a Regime Score of 3 (Full Risk-On). In a selective risk-off environment (Score 2), such as April 2026, the 8 EMA loses reliability as short-term trend consistency breaks down. The performance data shows its success rate drops to 38% at 0.9:1 R:R at score 2.
Why do moving average bounces fail?
The most common failure mode is trading a declining EMA. If the moving average is sloping downward, it indicates price deterioration. A valid bounce setup requires a rising or flat EMA to ensure you are trading with the prevailing trend.
The Regime Scoring System
Before any EMA analysis, establish the macro environment. The same three-point scoring system applies across all BreakoutBulletin setups.
SPY trend positive: SPY above its 20-day SMA → +1 point
Volatility contained: VIX below 20 → +1 point
Breadth positive: NYSE A/D line not diverging from SPY → +1 point
Scoring rules:
Score 3 → Full intended position size
Score 2 → Half intended position size
Score 1 or 0 → Paper trade only
Regime-specific EMA guidance:
8 EMA – requires regime score 3. Do not trade 8 EMA bounces at score 2 or below.
21, 50, 200 EMA – viable at score 2 in leading defensive sectors, but half size only.
Current April 2026 selective risk-off baseline (Score 2): Target 50 EMA bounces in Grade A leading sector stocks as the primary EMA setup.
The Four EMAs: Distinct Mechanisms, Distinct Applications
The 8 EMA - Momentum Pulse
The 8 EMA tracks the most recent eight sessions of price action, weighted toward recent closes. It is not an institutional benchmark — it is a momentum signal used by active traders to identify whether short-term trend momentum is intact.
Works best on: Individual growth stocks and sector leaders in full risk-on environments (score 3). In selective risk-off (current), pass entirely.
The 21 EMA - Institutional Position Manager
The 21 EMA represents approximately one month of trading sessions. Institutional portfolio managers use this line as a position management tool — they add to positions when price holds above the 21 EMA and trim when price breaks below it.
Works best on: S&P 500 large-caps with significant institutional ownership (>60%). Viable at regime score 2 in current rotation leading sectors.
The 50 EMA - Medium-Term Trend Line
The 50 EMA represents approximately 10 weeks of price action. It is the primary trend reference for swing traders and one of the most widely published technical indicators. The 50 EMA also frequently aligns with Fibonacci retracement levels (38.2% or 50%), creating confluence.
Works best on: S&P 500 stocks, sector ETFs, and index ETFs. Viable at score 2 - the most regime-resilient EMA bounce.
The 200 EMA - The Institutional Bull/Bear Line
The 200 EMA is the most important single moving average in institutional analysis. Every major asset manager, pension fund, and systematic strategy uses the 200-day moving average as a primary bull/bear filter.
Works best on: S&P 500 large-caps and major ETFs. Valid at score 2 in defensive and value sectors. The 200 EMA bounce has the highest success rate and R:R at score 3 (71%, 2.8:1).
Setup Quality Grading Across All Four EMAs
| Grade | EMA | Trend Requirement | Touch Count | Volume at Prior Touches | Last Touch | Max Size (Score 3) | Max Size (Score 2) |
|---|---|---|---|---|---|---|---|
| A | Any | Higher highs/lows on daily and weekly | First or second | Above average at prior bounces | 10+ sessions ago | Full 1% risk | 0.5% – 50/200 only |
| B | 21/50/200 only | Higher highs/lows on daily only | Second or third | Mixed – one clear above-average | 5-10 sessions ago | 0.75% risk | 0.4% – 50/200 only |
| C | Any | Unclear or counter-trend | Fourth touch or more | Declining at each touch | Recently overworked | No trade | No trade |
8 EMA Grade A requirement: regime score 3 only, first touch in the current trend leg, stock in top 20% of relative strength performers. Grade B does not apply to the 8 EMA - it is either Grade A conditions or a pass.
Quick-Reference Table for Traders
| EMA | Primary Use | Regime Requirement | Key Condition | Typical Stop | Best Timeframe |
|---|---|---|---|---|---|
| 8 | Momentum pulse | Score 3 only | First touch, rising EMA, 3+ higher closes above | 0.3× ATR below bounce low | Intraday (15-min / 1-hour) |
| 21 | Position manager | Score 2-3 | Rising EMA, fresh (10+ sessions since last touch) | 0.5× ATR below EMA | Daily / 4-hour |
| 50 | Swing trend line | Score 2-3 | Fib confluence, full stack alignment | 0.5-0.8× ATR below EMA | Daily |
| 200 | Bull/bear line | Score 2-3 (leading sectors) | 20+ sessions above before pullback, first touch | 1× ATR below EMA | Daily / weekly |
The Grade A Setup Checklist (Enhanced)
Before entering any EMA bounce, ensure the following technical "Fingerprints" are present:
Rising slope: The EMA must be rising, not flat or declining.
Fresh touch: The line should not have been touched in the last 10 sessions (5-10 for Grade B).
Decreasing volume: The pullback to the EMA occurs on lower-than-average volume.
Confirmation: A candle close back above the EMA on expanding volume (above 20-period average).
Fibonacci confluence (for 50 EMA): Alignment with 38.2% or 50% retracement upgrades the setup.
Full stack alignment: Price > 8 > 21 > 50 > 200 EMA (adds 5-7 percentage points to success rates).
No binary catalyst within 5 sessions: Earnings calendar checked.
Identification Rules by EMA
8 EMA Bounce Rules
Stock has made at least three consecutive higher closes above the 8 EMA establishing the trend leg.
This is the first pullback to the 8 EMA in the current trend leg.
Pullback candles show declining volume.
The 8 EMA is still rising — a flat or declining 8 EMA disqualifies the setup.
Requires regime score 3.
21 EMA Bounce Rules
Stock is in an established uptrend on the daily chart — higher highs, higher lows, above 50 EMA.
Price has not touched the 21 EMA in the prior 10 sessions minimum.
The 21 EMA is rising at a consistent angle.
Volume during pullback below the stock's 20-day average.
50 EMA Bounce Rules
Stock is above the 200 EMA — the long-term trend is intact.
The 50 EMA is rising or flat — not declining.
This is the first or second touch in the current trend. Third touch → downgrade to Grade B.
Look for Fibonacci confluence — alignment with 38.2% or 50% retracement upgrades the setup.
Prior bounces from the 50 EMA in this trend showed volume confirmation.
200 EMA Bounce Rules
Stock has been above the 200 EMA for at least 20 sessions before the pullback.
The 200 EMA is rising — a flat 200 EMA indicates consolidation; declining means broken long-term trend.
This is a first touch in the current trend — multiple rapid touches signal weakness.
Broader sector or market context is constructive.
Entry, Stop, and Target by EMA
| EMA | Entry | Stop | Target 1 | Target 2 |
|---|---|---|---|---|
| 8 | Close of 15-min confirmation candle above EMA with volume >20-period average | Below low of bounce candle + 0.3× ATR | Prior session high | Trail using 8 EMA |
| 21 | Close of daily or 4-hour confirmation candle >21 EMA with above-avg volume | Below 21 EMA by 0.5× ATR | Prior swing high | Trail using 21 EMA |
| 50 | Close of daily confirmation candle >50 EMA with above-avg volume | Below 50 EMA by 0.5-0.8× ATR | Prior swing high | Measured move via Fib extension |
| 200 | Close of daily confirmation candle >200 EMA (two consecutive closes for highest conviction) | Below 200 EMA by 1× ATR | 50 EMA | Prior swing high above 50 |
Position Sizing: Full Calculation With EMA Stop Examples
Formula: Shares = (Account × Risk%) ÷ Stop Distance in dollars
Example (50 EMA bounce): Stock ADV 6M shares, 14-day ATR = $1.80. EMA at $72.00. Confirmation candle closes at $72.60. Stop: $72.00 − (0.6 × $1.80) = $70.92. Stop distance = $1.68.
| Account | EMA / Grade / Regime | Dollar Risk | Stop Distance | Shares |
|---|---|---|---|---|
| $10,000 | 50 EMA / Grade A / Score 3 (1%) | $100 | $1.68 | 59 |
| $10,000 | 50 EMA / Grade A / Score 2 (0.5%) | $50 | $1.68 | 29 |
| $25,000 | 50 EMA / Grade A / Score 3 (1%) | $250 | $1.68 | 148 |
| $25,000 | 50 EMA / Grade A / Score 2 (0.5%) | $125 | $1.68 | 74 |
| $50,000 | 50 EMA / Grade A / Score 3 (1%) | $500 | $1.68 | 297 |
| $50,000 | 50 EMA / Grade A / Score 2 (0.5%) | $250 | $1.68 | 148 |
200 EMA produces wider stops (1× ATR buffer) → reduce share count accordingly.
8 EMA produces tighter stops → share counts are higher, but the setup requires regime score 3.
Failure Mode Analysis
Wrong EMA for the timeframe being traded — 8 EMA on a daily chart produces too many false signals; 200 EMA on a 5-minute intraday chart has no institutional meaning.
Declining EMA — a falling moving average signals price deterioration. All setups require a rising or flat EMA.
Overworked lines — fourth or more touch of any EMA within a short period carries significantly reduced reliability.
Ignoring the relationship between EMAs — before entering, check the "full stack": price > 8 > 21 > 50 > 200. Missing stack alignment reduces success rates by 5-7 percentage points.
EMA compression — when the 8, 21, and 50 EMAs converge into a narrow band, the trend is uncertain. Wait for re-separation.
Rising volume on the pullback — above-average volume on declining candles approaching an EMA signals institutional distribution, not a healthy pullback.
Observed Performance Data (Grade A Only)
Based on systematic review of EMA bounce setups on S&P 500 large-cap stocks across daily timeframes, January 2022–December 2025. Grade A setups meeting full checklist criteria (including full stack alignment). Grade B success rates are typically 8-10 percentage points lower. n values per EMA below. Live results will differ.
| EMA | Qualifying Setups (n) | Score 3 Success Rate | Score 3 R:R | Score 2 Success Rate | Score 2 R:R |
|---|---|---|---|---|---|
| 8 EMA | 312 | 64% | 1.9:1 | 38% | 0.9:1 |
| 21 EMA | 487 | 66% | 2.1:1 | 54% | 1.5:1 |
| 50 EMA | 623 | 68% | 2.3:1 | 59% | 1.8:1 |
| 200 EMA | 218 | 71% | 2.8:1 | 52% | 1.6:1 |
Key takeaways:
The 8 EMA collapses at score 2 (38% success, 0.9:1 R:R) — do not trade it in selective risk-off.
The 50 EMA at score 2 (59%, 1.8:1 R:R) is the most reliable EMA setup for current April 2026 conditions.
The 200 EMA at score 3 (71%, 2.8:1 R:R) is the highest-conviction EMA bounce when conditions are right.
The EMA Relationship to VWAP and Fibonacci (Confluence)
EMA + VWAP: When the daily 21 EMA aligns with intraday VWAP, two institutional reference points converge.
EMA + Fibonacci: The 50 EMA frequently aligns with the 38.2% or 50% Fibonacci retracement of the prior swing.
EMA + Support level: When a major EMA coincides with a prior support zone, the combination creates Grade A+ entry conditions.
Walk-Forward Analysis: 10 Consecutive Paper Trades
| Trade | EMA | Grade | Regime | Stack Aligned | Outcome | Notes |
|---|---|---|---|---|---|---|
| 1 | 50 | A | 3 | Yes – full stack | +2.3R | Fibonacci confluence present |
| 2 | 8 | A | 3 | Yes | +1.8R | First touch, strong momentum |
| 3 | 21 | A | 2 (half) | Yes | +0.9R | Half size, regime score 2 |
| 4 | 200 | A | 3 | Yes | +2.9R | Deepest demand – strong bounce |
| 5 | 8 | A | 2 | N/A | Skipped | Score 2 – 8 EMA not valid |
| 6 | 50 | A | 3 | Yes | -1.0R | All criteria met – valid loss |
| 7 | 21 | B | 3 | Partial – below 200 | Skipped | Stack not aligned – correct pass |
| 8 | 50 | A | 3 | Yes – Fib confluence | +2.5R | Dual framework confirmation |
| 9 | 200 | A | 2 (half) | Yes | +1.2R | Half size, defensive sector |
| 10 | 8 | C | 3 | EMA compressing | Skipped | Compression – correct pass |