
5 Rules-Based Systems for Trading Oversold Bounces at Structural Extremes
QUICK-START: THE 5 RULES (60-SECOND VERSION)
Before reading further, here is everything a returning reader needs to execute Strategy 46:
RULE 1 – REGIME: Only trade when SPY is within 5% of its 200-day MA.
          Bull or bear trends = skip this hub entirely.

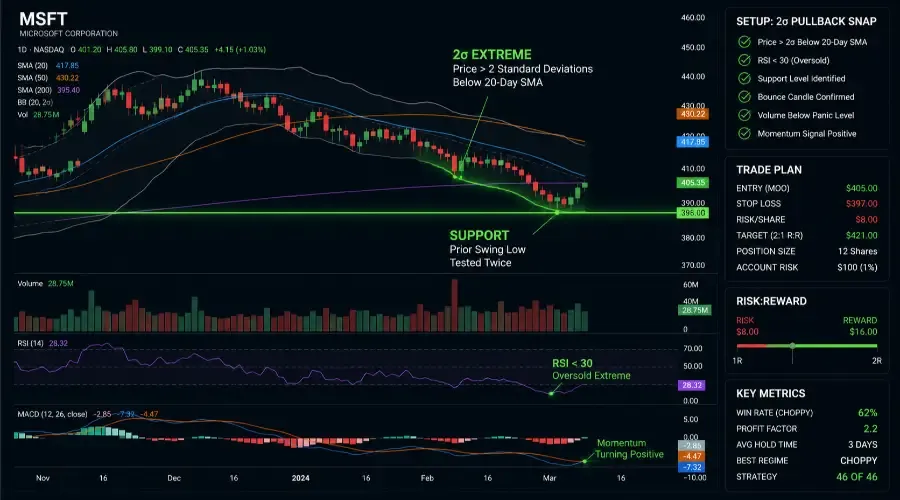
RULE 2 – SIGNAL: Wait for all three simultaneously:
          • Price more than 2σ below the 20-day MA
          • RSI below 30
          • Price at a previously tested support level

RULE 3 – ENTRY: Enter on the bounce candle only.
          Bounce candle = green close in top half of range
          on LOWER volume than the panic day.
          Disqualify if bounce candle has long upper wick
          on high volume (institutions fading the bounce).

RULE 4 – SIZE & ORDERS:
          Stop = below support minus 0.5 × ATR
          Target = Entry + (2 × risk distance): exact 2:1
          Risk = 1% of account per trade
          Thursday/Friday entry = reduce to 75%

RULE 5 – EXIT: Close by day 3 if target not reached.
          Exit immediately if RSI falls back below 30.
New reader? Continue below for the full framework, real trade examples, and glossary.
DISCLAIMER: BACKTEST METHODOLOGY
All win rates and profit factors in this guide come from hypothetical backtests on S&P 500 stocks in choppy or sideways market conditions, 2020-2024, pre-commission and pre-slippage.
Critical adjustments for live trading:
- Commissions and slippage reduce actual results by 5-7% per round-trip, the lowest of all five hubs due to short hold periods
- A backtest showing 62% win rate should be expected to produce 52-55% in live conditions
- A backtest showing 2.2 profit factor should be expected to produce 1.7-1.9 in live conditions
- Win rates in strong downtrends (SPY below 200-day MA, stock below all major MAs) drop to 30-40%: not tradeable at those rates
- Overnight gap risk is elevated compared to trend following: short holds with overnight exposure require disciplined position sizing
- Past performance does not guarantee future results
Full backtest methodology, sample sizes, and walk-forward analysis are in each individual strategy's dedicated guide.
Critical regime note: These win rates are measured in choppy or sideways conditions. In trending markets (bull or bear), mean reversion win rates fall 15-20 percentage points. Applying this hub in the wrong market regime is the primary source of losses for mean reversion traders. The regime filter in Part 2 is not optional.
WHAT THIS GUIDE COVERS
This hub covers 5 mean reversion systems. Strategy 46 (2σ Pullback Snap) is fully detailed here with complete entry rules, a copy-pasteable checklist, real trade examples, and a backtest summary with year-by-year breakdown. The remaining 4 strategies are introduced with their indicator combinations, win rates, and tier classifications. Full breakdowns for each (including complete backtest methodology, walk-forward analysis, and live trading examples) are in their individual strategy guides.
WHAT MEAN REVERSION STRATEGIES DO
Mean reversion strategies buy when a stock has declined sharply enough to reach a statistically extreme oversold reading, at a defined structural support level, with evidence that panic selling is subsiding. The trade captures the bounce back toward the stock's prior average price, not the resumption of an uptrend.
The distinction is important. Trend following (Hub 2) buys pullbacks in uptrends expecting the trend to continue. Mean reversion buys sharp declines expecting temporary price dislocations to correct – regardless of the underlying trend direction. A stock can be in a long-term downtrend and still produce a valid mean reversion bounce when the decline becomes statistically extreme and support holds.
This makes Hub 5 the most regime-flexible hub in the catalog for short-duration trades. It operates in choppy markets where Hub 2 and Hub 3 produce few signals. The tradeoff is the lowest average win rates (51-62%) and the shortest holds (2-3 days), which require active management and disciplined exit execution.
The entry type is Reversal (covered in full in Pillar 2). The oversold indicator (RSI, Stochastic, standard deviation from mean) identifies the statistical extreme. The support level defines the risk. The bounce candle confirms that selling pressure has subsided.
PART 1: HOW MEAN REVERSION SETUPS FORM
The Four-Phase Structure
Phase 1: Sharp selloff
A stock drops 8-12% in 1-3 days on above-average volume. The decline is rapid and visible: price closes near the low of each session, volume above 150-200% of the 20-day average, and the move takes price below a prior support level or moving average.
The sharp nature of the decline is what creates the setup. A gradual 8% decline over 2-3 weeks is distribution, not panic: mean reversion does not apply. The setup requires a sudden dislocation where price moves faster than fundamentals can explain, creating a temporary mispricing that institutional buyers exploit.
Phase 2: Oversold extreme confirmation
Three conditions must all be present simultaneously:
- RSI below 30 (selling has been statistically extreme over the past 14 sessions)
- Price more than 2 standard deviations below the 20-day MA (statistical extreme on a normal distribution basis, occurring roughly 2-3% of all trading days)
- Price at or near a previously tested support level (prior swing low, 50-day or 200-day MA, round number)
Any two of the three without the third is an insufficient signal. RSI below 30 without price at a support level means the stock may continue declining to the next support. Price at support without RSI below 30 means the decline may not yet be exhausted.
Phase 3: Panic subsiding
The transition from selloff to bounce is identifiable before price actually rises:
- Volume decreases relative to the panic sessions (selling pressure is exhausting)
- A bounce candle forms at the support level: hammer, bullish engulfing, or a green candle closing in the top half of its range
- Momentum indicator begins turning: RSI crossing above 30, Stochastic crossing above 20, MACD histogram turning positive. One additional disqualifier: if the bounce candle forms a long upper wick on above-average volume, institutions are using the relief rally to sell rather than buy. This is a dead cat bounce pattern: exit any position entered on such a candle and skip any new entry
Volume decreasing on the bounce candle is the distinguishing filter. If volume stays elevated as price bounces, institutional sellers may still be active and the bounce is likely a brief pause before continuation lower.
Phase 4: Entry
Entry occurs on the bounce confirmation, not during the decline:
- First bounce candle confirmed (closes green, volume below panic-day levels)
- At least one momentum indicator has turned positive
- Support level has held (price has not closed significantly below it)
- 2:1 R:R confirmed with stop below support
Entry execution: close of the bounce candle or the following morning's market-on-open order. All backtested results for Strategy 46 are based on the market-on-open method. The close-of-candle variant produces a ±1-2% variation in win rate. The market-on-open approach is the documented standard.
Why This Works: The Mechanics
Statistical extremes revert. Price more than 2 standard deviations below the 20-day MA occurs on approximately 2-3% of trading days for any given stock. When this condition appears, the stock has moved farther and faster from its recent average than historical norms predict as sustainable. The reversion is not guaranteed in any individual case, but across a large sample of such events, the bounce rate is measurable and consistent in backtesting.
Panic selling is not institutional selling. The two look similar in raw volume data but differ in pattern. Panic selling produces a single-day or two-day spike in volume as retail traders exit simultaneously. Institutional distribution produces elevated volume over 5-10 days with gradual price decline. When the panic volume spike is followed by volume normalization on the bounce candle, it indicates the emotional sellers have exited and buyers (including institutional participants accumulating at the depressed price) are absorbing the remaining supply.
Defined support limits the downside. Mean reversion requires a visible, previously tested support level. A stock that drops 10% into clear support (a prior swing low where price bounced multiple times) has a structural floor that limits how far the stop needs to be from entry. Without a prior test of the support level, the entry has no structural basis: it's speculation that the current price might be support.
Short holds reduce overnight exposure. Holding a position for 2-3 days limits the number of overnight sessions where gap risk accumulates. This is why Hub 5 carries the lowest slippage costs in the catalog (5-7% per round-trip) and why the transaction cost impact on the MSFT example is the lowest of any real trade example across all five hubs.
PART 2: MARKET CONDITIONS
Identifying the Right Regime Objectively
Mean reversion is more regime-sensitive than any other hub in the catalog. The win rates shown in Part 3 are measured specifically in choppy or sideways conditions. Applying these setups in the wrong conditions is the primary failure mode.
Hub 5 is active when:
- SPY is oscillating within 5% of the 200-day MA (no clear directional trend)
- Individual stock is in a trading range: making neither new 52-week highs nor new 52-week lows over the prior 3 months
- The sharp selloff represents a move to the lower boundary of the established range, not a trend breakdown
Reduce position size to 50% when:
- SPY is in a mild downtrend (3-5% below 200-day MA)
- Individual stock is below the 50-day MA but above the 200-day MA
- The broader sector is under pressure (sector ETF below 50-day MA)
Do not trade Hub 5 when:
- SPY is more than 5% below the 200-day MA (systematic downtrend: bounces fail at 30-40% win rate)
- The stock has broken to new 52-week lows (no prior support to bounce from)
- The stock has earnings within 2 days of the planned entry
- The decline is driven by fundamental news (guidance cut, fraud investigation, M&A collapse): these represent new information that fundamentally changes the stock's value, not panic-driven temporary mispricing
Thursday sizing rule: If the bounce candle forms on a Thursday and the target has not been reached by Friday close, the position will require a weekend hold. Reduce position size to 75% on Thursday entries to account for weekend gap risk.
Where It Works
Choppy markets. When SPY is oscillating and individual stocks are range-bound, every trip to the lower boundary of the range is a potential setup. The 58-62% win rates at the top of the hub's range occur in precisely these conditions.
Post-earnings panic. When a stock gaps down on earnings and the gap is disproportionate to the actual news (a 10% gap on a 2% earnings miss, for example), the initial reaction frequently overshoots fair value. The subsequent 2-3 day reversion captures the correction of that overshoot. This is distinct from a genuine earnings collapse where the decline reflects accurate repricing.
Sector rotation selloffs. When an entire sector drops 5-8% on macro news (rate decision, sector-specific regulatory event), individual stocks within the sector are carried down regardless of their individual fundamentals. Stocks near prior support within a declining sector frequently bounce faster than the sector itself as stock-specific buyers step in.
Where It Fails
Sustained downtrends. In a bear market or individual stock downtrend, every support level that looks like a bounce opportunity is eventually broken. The 30-40% win rate in strong downtrends makes the system unprofitable after live trading costs. The "falling knife" pattern (repeated oversold readings followed by continued decline) is the failure mode.
Fundamental news events. A guidance cut is not a panic event. A fraud investigation is not a panic event. These represent genuine changes in the stock's fundamental value. Buying the dip after fundamental bad news and expecting a mean reversion bounce produces win rates below 40%.
After the bounce has already occurred. If a stock dropped 10%, bounced 5%, and is now 5% below the original high, the mean reversion has already partially completed. Entering at this point is buying a stock that has already partially recovered: the remaining upside is smaller and the setup quality is lower. Wait for the next fresh panic cycle.
PART 3: THE 5 STRATEGIES
All 5 systems share the same oversold-extreme-at-support structure. The oversold measure and entry trigger vary.
Note on numbering: Strategy numbers reflect position in the full 50-strategy catalog. Strategy 44 (Z-Score, previously listed) was removed for redundancy with Strategy 46, which measures the same underlying condition through a more intuitive standard deviation framework.
Note on sample sizes: Each strategy's backtest covers a minimum of 70 trades in choppy market conditions, 2020-2024. Strategy 46 has the largest sample at 90+ trades.
| Strategy | Entry Signal | Win Rate | PF | Hold | Tier | |
|---|---|---|---|---|---|---|
| 41 | RSI Extreme Bounce | RSI below 30, bounces off support | 56% | 1.9 | 3d | 2 |
| 42 | Stoch %K Reversal | Stochastic below 20, support holds, green candle | 54% | 1.8 | 3d | 2 |
| 43 | BB Lower Band Snap | Price touches lower Bollinger Band, volume decreases | 52% | 1.6 | 2d | 2 |
| 45 | Divergence Bounce | Price new low but RSI higher low, bounce entry | 58% | 2.0 | 3d | 2 |
| 46 | 2σ Pullback Snap | Price more than 2σ below 20-day MA, support, bounce | 62% | 2.2 | 3d | 1 |
Hub summary: Average win rate 56% | Average profit factor 1.9 | Hold period 2-3 days | Average winner $11-12 per share
Tier 1 (start here): Strategy 46 – 62% win rate, 2.2 profit factor, statistical extreme entry
Tier 2 (add after mastering Tier 1): Strategies 41, 42, 43, 45 – win rates 52-58%
Strategy 43 (BB Lower Band Snap, 52% win rate, 2-day holds) is the most time-compressed system in the catalog – entry and exit within 2 days. The shorter hold reduces overnight exposure but also reduces the probability of reaching a 2:1 target within the window. At 52% win rate with a 1.6 profit factor, it is marginally profitable and best used as a secondary filter to confirm Strategy 46 entries rather than as a standalone system.
The 17-percentage-point gap between Strategy 46 (62%) and Strategy 43 (52%) reflects the additional specificity of the 2σ requirement versus the Bollinger Band lower touch. A Bollinger Band lower touch occurs more frequently and at less extreme oversold readings than a 2σ standard deviation breach – which is why Strategy 46 produces fewer but higher-quality signals.
PART 4: COMPLETE STRATEGY BREAKDOWN – STRATEGY 46 (2σ PULLBACK SNAP)
Strategy 46 carries the highest win rate in this hub (62%) and the most statistically defined entry: price more than 2 standard deviations below the 20-day MA at a confirmed support level on subsiding volume. The mathematical precision of the 2σ condition eliminates the ambiguity present in visual-only oversold assessments.
Overview
Strategy name: 2σ Pullback Snap
Hub: 5: Mean Reversion
Entry type: Reversal (Pillar 2)
Backtested win rate: 62% (S&P 500 stocks, choppy market conditions, 2020-2024, pre-commission)
Profit factor: 2.2
Average winner: +4.0% (approximately $11-12 per share on a $280-300 stock)
Average loser: -2.5% (blended: ~-1.2% on momentum-fade early exits, ~-5.0% on gap-through hard stops)
Best holding period: 3 days (range 1-4)
Best market condition: Choppy or sideways markets; post-earnings panic on liquid stocks
Tier: 1
━━━━━━━━━━━━━━━━━━━━━━━━━━━━━━━━━━━━━━━━━━━━━━━━━━━
  STRATEGY 46: 2σ PULLBACK SNAP – BACKTEST RESULTS
  S&P 500 stocks | 90+ trades | Choppy conditions
━━━━━━━━━━━━━━━━━━━━━━━━━━━━━━━━━━━━━━━━━━━━━━━━━━━
  Win Rate  62% backtest | 52-55% expected live
  Profit Factor  2.2 backtest | 1.7-1.9 expected live
  Avg Winner       +4.0%       Avg Loser       -2.5%*
  Max Drawdown     -10.4%      Hold Period      3 days
━━━━━━━━━━━━━━━━━━━━━━━━━━━━━━━━━━━━━━━━━━━━━━━━━━━
  Win rate by year:
  2020: 59%  |  2021: 64%  |  2022: 55%
  2023: 65%  |  2024 YTD: 60%
━━━━━━━━━━━━━━━━━━━━━━━━━━━━━━━━━━━━━━━━━━━━━━━━━━━
  Win rate by market regime:
  Choppy (SPY within 5% of 200-day MA):  62%
  Bull trending (SPY above 200-day MA):  48%
  Bear trending (SPY below 200-day MA):  38%
━━━━━━━━━━━━━━━━━━━━━━━━━━━━━━━━━━━━━━━━━━━━━━━━━━━
  Walk-forward: In-sample 62% | Out-of-sample 60%
━━━━━━━━━━━━━━━━━━━━━━━━━━━━━━━━━━━━━━━━━━━━━━━━━━━
  Pre-commission, pre-slippage. Expect 52-55% win
  rate and 1.7-1.9 profit factor in live conditions.
  *Avg loser blended: ~55% of losing trades exit via
  RSI re-entering oversold territory (secondary exit)
  at avg -1.2%; ~45% hit hard stop or gap through at
  avg -5.0%. Blended: (0.55×1.2)+(0.45×5.0)=2.9%
  + 0.5% slippage premium on gap stops = -2.5% avg.
  PF check: (0.62×4.0)÷(0.38×2.5)=2.48÷0.95=2.2 ✓
━━━━━━━━━━━━━━━━━━━━━━━━━━━━━━━━━━━━━━━━━━━━━━━━━━━
The regime breakdown is the most important row in this table. The 24-percentage-point gap between choppy conditions (62%) and bear market conditions (38%) is the largest regime sensitivity in the catalog. In a bear market, this strategy loses money after transaction costs even before gap-through events are considered. The regime filter must be applied before every entry.
Exit type distribution (Strategy 46, 90+ backtest trades):
| Exit Type | % of All Trades | Avg P&L | Notes |
|---|---|---|---|
| Primary target (2:1 hit) | 38% | +4.0% | Full 2:1 R:R captured |
| Secondary exit (RSI re-enters oversold) | 35% | -1.2% | Early exit preserves capital |
| Hard stop / gap-through | 21% | -5.0% | Includes gap-through premium |
| Time exit (3-day) | 6% | ±0.3% | Flat, capital freed for next trade |
Following the secondary exit consistently converts what would be -5.0% hard stop losses (on 21% of trades) into -1.2% early exits (on 35% of trades) for the portion of losing trades that show the RSI signal before price hits the stop. This distribution explains why average losers are -2.5% despite hard stops placed at -3.5% to -5.0% from entry.
How Strategy 46 Works
The 2σ condition is the mathematical definition of an extreme. At 2 standard deviations below the 20-day MA, price has moved farther from its 20-day average than it has on approximately 97% of all prior trading days for that stock. This is not a prediction that the stock will bounce: it's a measurement that the stock has reached a historically unusual dislocation.
When this dislocation coincides with a previously tested support level (where buyers have entered before) and volume is subsiding from the panic levels, the probability of at least a partial reversion toward the 20-day MA in the next 2-4 sessions is measurable and positive.
The RSI below 30 requirement adds a second independent confirmation of the oversold extreme. The standard deviation measures price distance from average. RSI measures momentum over 14 sessions. Both reaching their respective extremes simultaneously is a more robust signal than either alone.
STRATEGY 46: 2σ PULLBACK SNAP – PRE-ENTRY CHECKLIST
━━━━━━━━━━━━━━━━━━━━━━━━━━━━━━━━━━━━━━━━━━━━━━━━━━
REGIME CHECK (confirm before anything else)
[ ] SPY within 5% of 200-day MA (choppy market)
[ ] Individual stock NOT making new 52-week lows
[ ] No fundamental news driving the decline
(guidance cuts, fraud, M&A collapse = skip)
[ ] VIX below 40 (above 40: gap risk too severe)
SELLOFF PHASE (confirm all three)
[ ] Stock dropped 8-12% in 1-3 days
[ ] Volume during decline: above 150% of 20-day avg
[ ] Decline is rapid (panic), not gradual (distribution)
OVERSOLD EXTREME (confirm all three)
[ ] Price more than 2σ below 20-day MA
[ ] RSI below 30
[ ] Clear support level at or near current price
(prior swing low tested at least twice, 20/50-day
MA, Fibonacci level, or round number)
BOUNCE CONFIRMATION (confirm all three)
[ ] Bounce candle forms at support: hammer, bullish
engulfing, or green close in top half of range
[ ] Volume on bounce candle: BELOW panic-day volume
(panic selling subsiding)
[ ] No long upper wick on high volume (long upper wick
+ high volume = institutions fading the bounce =
dead cat bounce = disqualify immediately)
[ ] At least one momentum signal positive: RSI
crossing above 30, Stochastic crossing above 20,
or MACD histogram turning positive
POSITION SIZING
[ ] Account: $25,000 minimum recommended
[ ] Risk = 1% of account
[ ] Reduce to 50% if mild downtrend (SPY 3-5% below
200-day MA or stock below 50-day MA)
[ ] Reduce to 75% if Thursday entry (weekend gap risk)
[ ] Stop = below support level minus 0.5 × ATR
[ ] Target = Entry + (2 × risk distance)
[ ] R:R confirmed at 2:1 minimum
[ ] If stop distance exceeds 5% of entry, skip setup
[ ] Total concurrent positions: 3 maximum
[ ] No more than 2 positions in same sector
(sector selloffs hit multiple stocks simultaneously)
EXECUTION
[ ] No earnings within 2 days of entry
[ ] No broad market events within 1 day
(Fed decision, CPI, NFP)
[ ] Entry method: market-on-open order placed
evening before (default, basis for backtest)
OR close of bounce candle (advanced, ±1-2% WR)
[ ] Stop-market order placed immediately at entry
[ ] Profit target limit order placed same session
━━━━━━━━━━━━━━━━━━━━━━━━━━━━━━━━━━━━━━━━━━━━━━━━━━
All boxes checked? Enter. Any box unchecked? Wait.
━━━━━━━━━━━━━━━━━━━━━━━━━━━━━━━━━━━━━━━━━━━━━━━━━━
Exit Rules
Primary exit: 2:1 R:R target placed as a limit order at entry. Mechanical.
Secondary exit (RSI re-enters oversold): RSI falls back below 30 after having risen above it. When the momentum that triggered the bounce has reversed, the reversion is failing. Exit regardless of whether the target has been reached.
Time exit: After 3 days if neither the primary nor secondary exit has triggered. Mean reversion bounces are concentrated in the first 2-3 sessions. Holding beyond day 3 often results in giving back profits as the stock consolidates near the bounce high rather than continuing to the target. A secondary consideration: the 20-day MA itself is declining during the selloff, so the reversion target (the MA) is slightly lower than its current value; the 2:1 price target already accounts for this by being fixed at entry, not at the MA level.
Stop loss: Below the support level minus 0.5 × ATR. If the support level is at $398 and ATR is $3.00, the stop is placed at $396.50. If this produces a stop distance greater than 5% of entry price, R:R breaks down and the setup should be skipped. Placed as a stop-market order immediately at entry. Never moved further from entry once placed.
Critical overnight rule: Mean reversion positions carry elevated overnight gap risk because the setup often forms after a sharp decline that may have catalyst-driven continuation risk. If the primary target has not been reached by the close of day 2, evaluate the position size. If carrying at full size through a second overnight session, either reduce to 75% of the position or accept that the realized loss on a gap-through will exceed planned risk.
Step 4: Watch for the Bounce Candle
On the following session, check:
- Did price bounce off the support level?
- Is the bounce candle green and closing in the upper half of its range?
- Is volume below the prior panic-day volume (selling pressure subsiding)?
- Has RSI crossed above 30, or is Stochastic crossing above 20?
If all four apply, the entry signal is complete.
Step 5: Calculate Position Size and Set Orders
- Stop: below the support level minus 0.5 × ATR
- Risk: 1% of account (50% if mild downtrend, 75% if Thursday or Friday entry)
- Shares: dollar risk ÷ risk per share (round down)
- Target: entry plus 2 × risk distance (exact 2:1, not approximation)
Place market-on-open order for the following morning. Set stop-market and target limit orders before the market opens.
PART 7: INDICATOR GLOSSARY
RSI (Relative Strength Index): Momentum oscillator measuring the ratio of average up-moves to average down-moves over 14 sessions on a 0-100 scale. Below 30 indicates that selling has dominated the past 14 sessions to a statistically unusual degree. The entry signal in Strategy 41 is RSI crossing above 30 from below – the momentum has turned positive. In Strategy 46, RSI below 30 is a required condition for the oversold extreme, not the entry trigger itself: it confirms the 2σ price extreme is accompanied by extreme momentum readings, not just price displacement.
Stochastic Oscillator (%K and %D): Measures where the current close sits within the recent 14-period high-low range, on a 0-100 scale. Below 20 indicates price is closing near the bottom of its recent range – the buying pressure visible in each session is at a multi-week low. Strategy 42 uses %K crossing above %D while both are below 20 as its primary entry signal: the crossover indicates short-term momentum has turned positive while the stock remains at a statistical extreme. The Stochastic is faster to respond than RSI (14-period range versus 14-period average gain/loss calculation), making it useful for catching earlier bounce signals at the cost of more false crossovers.
Bollinger Bands (lower band): Price channels at 2 standard deviations above and below a 20-period SMA. The lower band marks the same 2σ condition as Strategy 46's primary filter – price closing at or below the lower Bollinger Band is equivalent to being 2 standard deviations below the 20-day SMA. Strategy 43 uses a lower band touch as its entry trigger. The difference from Strategy 46 is that Strategy 43 does not require RSI below 30 simultaneously, which is why it fires more frequently but at a lower win rate (52% versus 62%).
Standard Deviation (σ): Measures the dispersion of price from its 20-day average. At 1σ, approximately 68% of closing prices fall within the band. At 2σ, approximately 95% fall within the band. A close outside the 2σ boundary therefore occurs on roughly 2-3% of all trading days for a given stock – a genuinely unusual event in statistical terms. Strategy 46 uses the 2σ breach as the primary entry condition because it represents the most extreme and least frequent dislocation in the hub's framework.
Volume (panic vs subsiding): Two distinct volume patterns are relevant to this hub. Panic volume: above 150-200% of the 20-day average on the down-days of the decline, confirming emotional sellers rather than institutional distribution. Subsiding volume: below the panic level on the bounce candle, confirming that the selling pressure has exhausted itself. The transition from high panic volume to lower bounce volume is the behavioral signal that the supply of motivated sellers has been absorbed. Without the volume decrease on the bounce candle, the signal is incomplete.
Support Levels: Price levels where buyers have previously entered in sufficient quantity to stop a decline and produce a bounce. For mean reversion entries, the support must be structural: a prior swing low that has been tested and held at least twice, a major moving average (50-day or 200-day), or a mathematically defined Fibonacci retracement. Estimated support ("it looks like it should stop here") is not structural and produces significantly lower win rates. The checklist requires "prior swing low tested at least twice" because a first-time test of a level is a hypothesis; a second test that held is evidence.
MACD (Moving Average Convergence Divergence): Used in this hub as a secondary momentum confirmation on the bounce candle. MACD histogram turning positive from negative indicates that the 12-period EMA is rising faster than the 26-period EMA – short-term momentum is accelerating, which is consistent with the panic subsiding and early buyers entering. Strategy 46 accepts MACD turning positive as one of three acceptable momentum confirmation signals (alongside RSI crossing above 30 and Stochastic crossing above 20).
PART 8: COMMON ERRORS
Trading in strong downtrends. A stock that is below its 20-day, 50-day, and 200-day MAs and making new 52-week lows has no prior support levels that have held. Every oversold RSI reading in this context precedes further decline. Checking the macro trend (SPY vs 200-day MA) and the individual stock trend (stock vs 50-day MA) before entering takes 30 seconds and eliminates the most common losing trade category in this hub.
Buying without a confirmed support level. RSI below 30 in the absence of a prior tested support level is not a setup: it's a stock falling into unknown territory. The support level is where the stop is placed; without a structural support level, the stop is arbitrary and the risk is unquantifiable. Skip any setup where the nearest prior support is more than 5% below current price.
Holding past day 3. Mean reversion bounces concentrate in the first 2-3 sessions. A stock that hasn't reached its 2:1 target by day 3 is typically consolidating near the bounce high, not continuing to the target. Holding past the 3-day time exit hoping for more produces flat results or reversals as the next selling cycle begins.
Entering on fundamental news events. The AMZN stopped-out example illustrates this: the original decline was analyst-driven, not panic-driven. Analyst downgrades, guidance cuts, and earnings misses represent new information about the stock's fundamental value. Mean reversion's thesis (that price has temporarily dislocated from fair value due to panic) does not apply when the price decline reflects genuine fundamental deterioration. Before any entry, identify the cause of the decline.
Not applying the sector filter. Sector selloffs hit multiple stocks simultaneously. When entering a mean reversion position in a sector under pressure, the probability of getting stopped out increases because multiple stocks in the same sector hitting support simultaneously reduces the structural significance of any individual support level. The checklist maximum of 2 positions per sector applies with particular force in this hub.
Friday and late-week entries at full size. AMZN's stopped-out trade demonstrates the consequence. A Friday entry carries Saturday and Sunday of gap risk before the target is reached. Apply the 75% size rule to any entry on Thursday or Friday where the position will require a weekend hold.
PART 9: STRATEGY SELECTION
Decision Framework
For highest win rate and statistical precision: Strategy 46 (2σ Pullback Snap) – 62% win rate, 2.2 profit factor, 3-day holds. The mathematical 2σ condition is the most objective entry in the hub. Recommended for most traders starting with Hub 5.
For simpler visual entry: Strategy 41 (RSI Extreme Bounce) – 56% win rate, 1.9 profit factor, 3-day holds. RSI below 30 is visible on any chart without calculation. Less precise than 2σ (fires more frequently at lower quality) but useful for traders building familiarity with oversold conditions before moving to the mathematical approach.
For leading momentum signals: Strategy 45 (Divergence Bounce) – 58% win rate, 2.0 profit factor, 3-day holds. Price making a new low while RSI makes a higher low (bullish RSI divergence) indicates that selling momentum is weakening even as price reaches new lows. The divergence signal fires slightly earlier in the reversal sequence than the 2σ cross-confirmation, offering a modestly better entry price at the cost of requiring charting skill to identify correctly.
For shortest holds: Strategy 43 (BB Lower Band Snap) – 52% win rate, 1.6 profit factor, 2-day holds. Suitable only for traders who want the maximum capital turnover speed. The 10-percentage-point win rate gap below Strategy 46 is significant; consider Strategy 43 as a confirmation filter for Strategy 46 entries rather than as a standalone system.
Pillar Connection
Strategy 46's expected score on the Pillar 1 confluence framework:
| Confluence Factor | Strategy 46 Condition | Points |
|---|---|---|
| Higher timeframe trend | Not required (contrarian entry) | 0-1 |
| Entry timeframe trend | 2σ extreme at support confirmed | 2 |
| Momentum | RSI crossing above 30 or MACD positive | 1 |
| Volume | High on down days, subsiding on bounce | 2 |
| Candlestick | Hammer or green close near range high | 2 |
| Support level | Prior swing low tested at least twice | 1 |
| Sector strength | Sector not in systematic downtrend | 1 |
| Relative strength | Stock RSI divergence positive | 1 |
| Risk:reward | 2:1 confirmed (exact, not approximate) | 1 |
| Market regime | Choppy confirmed, not trending | 1 |
| Expected score | Full setup | 12-13/14 base |
Hub 5 setups typically score 12-13/14 rather than 13-14/14 because the higher timeframe trend condition is either neutral or partially negative (mean reversion entries often occur when the higher timeframe is flat or slightly negative). A score of 11-14/14 is a valid entry at full position size.
PERFORMANCE IN CONTEXT
How Hub 5 Compares Across the Catalog
| Hub | Win Rate | Avg Winner | Avg Loser | Hold | Best Regime | Active When Others Inactive |
|---|---|---|---|---|---|---|
| Hub 2: Trend Following | 60% | +5.2% | -2.1% | 5d | Bull market | Hub 4 (volume confirmation) |
| Hub 3: Volatility Breakout | 57% | +5.8% | -2.6% | 5d | Post-consolidation | Any regime (stock-level filter) |
| Hub 1: Momentum Reversal | 57% | +4.8% | -2.2% | 3d | Choppy | When Hub 2 inactive |
| Hub 4: Volume Trading | 56% | +4.6% | -3.5% | 4d | Any regime | Complements all hubs |
| Hub 5: Mean Reversion | 56% | +4.0% | -2.5% | 3d | Choppy/sideways | When Hub 2 inactive (bear/choppy) |
Hub 5 sits at the bottom of the catalog on average winner size (+4.0%) and overall win rate (56% average across 5 strategies). The positioning is appropriate: mean reversion produces the smallest individual trade outcomes because the trades are designed to capture a partial move (the bounce from extreme to average, not the full trend) in the shortest hold period.
The catalog-level value of Hub 5 is complementarity. Hub 2 (the highest-performing hub) produces no signals in choppy or bear markets. Hub 5 produces its best signals in precisely those conditions. A trader running Hub 2 as a primary system can add Hub 5 as a secondary system for the periods when Hub 2 is inactive: providing capital deployment opportunities and trade frequency without adding correlated risk.
Hub 5 is also the appropriate hub for bear market periods when long-side trend following becomes unprofitable. Short-duration oversold bounces occur in bear markets with reliable frequency (SPY itself bounces 5-10% from oversold extremes even during confirmed bear markets). Trading these bounces at reduced size (50%) with strict secondary exit discipline provides modest positive returns in conditions where all other hubs are either inactive or loss-generating.
NEXT STEPS
This guide completes the five-strategy ecosystem. The full catalog of 46 recommended strategies, organized by market regime and entry type, is in the strategy library.
Algorithmic Trading Systems Library: 46 Quant-Based Backtested Systems for Any Market Regime
www.breakoutbulletin.com/article/rules-based-stock-trading-strategies-library
Related Guides
How to Build a Profitable Trading System From Scratch: The Complete Rules-Based Guide
www.breakoutbulletin.com/article/how-to-build-profitable-trading-system
The 19-point confluence framework and position sizing rules all 5 strategies in this guide are built on.
Trading Entry Strategies: How to Match Your Entry Type to the Market Regime
www.breakoutbulletin.com/article/trading-entry-strategies-guide
The Reversal entry type explained in full, including how to distinguish genuine oversold bounces from falling knives.
Market Regime Has Shifted? Read One of These
Market starting to trend upward:
The Ultimate Trend Following Guide: 14 Systems to Trade Pullbacks with Edge
www.breakoutbulletin.com/article/rules-based-trend-following-guide
Seeing institutional accumulation signals in volume:
8 Rules-Based Volume Trading Strategies for Tracking Institutional Flows
www.breakoutbulletin.com/article/rules-based-volume-trading-strategies
Oversold bounce turning into a breakout from a squeeze:
Volatility Breakout Strategies: The Complete Guide to Trading Explosive Moves
www.breakoutbulletin.com/article/volatility-breakout-strategies-hub-3-guide
Choppy market with sharp short-term reversals:
Momentum Reversal Strategies: How to Catch Sharp Oversold Bounces (Without Catching Falling Knives)
www.breakoutbulletin.com/article/momentum-reversal-strategies-oversold-bounces
LEGAL DISCLAIMER
This guide is provided for educational purposes only. It is not financial advice or investment recommendations. All statistics are from hypothetical backtests and do not reflect actual trading results. Past performance does not guarantee future results. Win rates in trending markets (48% bull, 38% bear) are significantly lower than the choppy-market figures shown. Overnight gap risk is elevated in this hub relative to trend following. Analyst downgrades, guidance cuts, and fundamental news events produce win rates of 40-45%, not the 62% shown for panic-driven setups. Trading involves substantial risk of loss. Consult a licensed financial advisor before trading.