
BreakoutBulletin | Trading Education
Educational commentary only. Not investment advice. Past performance does not guarantee future results.
Why Structure Comes Before Every Other Setup
The Classic cluster establishes entry mechanics. The Momentum cluster identifies acceleration. The Options cluster prices volatility. None of these clusters can be applied correctly without the foundational skill that the Structure cluster teaches: reading what the market is actually doing before you decide what to trade.
Market structure is not a trading setup. It is the context that determines which trading setups are appropriate. A VWAP bounce in an uptrending stock with higher highs and higher lows is a Classic setup in its optimal environment. A VWAP bounce in a stock forming lower highs and lower lows is a counter-trend trade fighting the dominant structure – a fundamentally different risk proposition that the Classic cluster's win rates do not reflect.
The seven setups in this cluster teach the analytical reading skill that precedes every entry across all five BreakoutBulletin clusters. A trader who cannot identify whether a stock is trending, reversing, or range-bound cannot correctly apply the regime score, cannot select the appropriate Classic or Momentum setup, and cannot assess whether an options position's risk-reward is appropriate for the stock's current behaviour. Structure is prerequisite – not optional background knowledge.
In practice, market structure and price action structure are the same thing: the map you read before you choose the vehicle. Whether you're trading higher highs and higher lows or waiting for a descending channel breakout, the stock market trends of 2026 still obey the same structural rules.
Current May 2026 context: MSFT is currently compressing into a symmetrical triangle on the daily chart – a series of higher lows and lower highs converging toward an apex. This is the Structure cluster's most visible current example: a stock that has been in a clear HH/HL uptrend, now showing the early compression that precedes a directional resolution. The triangle pattern is building energy. The breakout – when it comes – will produce either a Classic consolidation breakout setup or a Momentum continuation entry. The Structure cluster identifies the compression. The other clusters execute the resolution.
The Three Market States Every Trader Must Identify
Before any setup in any cluster is considered, the market state of the individual stock must be identified. There are exactly three states.
State One – Trending (HH/HL or LH/LL)
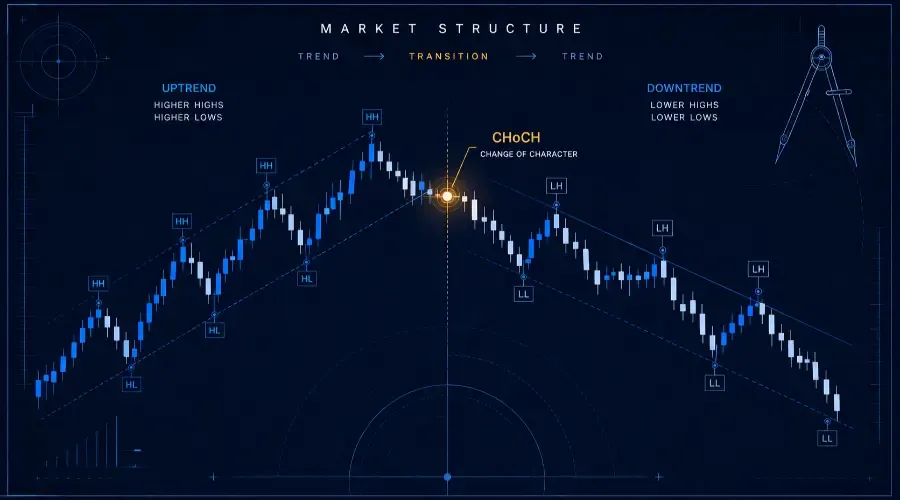
A stock making higher highs and higher lows is in a confirmed uptrend. Every swing high exceeds the prior swing high. Every swing low is above the prior swing low. This is the structural prerequisite for Classic and Momentum long setups – buying pullbacks, bouncing off support, and entering breakouts all require the HH/HL structure to be intact.
A stock making lower highs and lower lows is in a confirmed downtrend. The LH/LL structure is the exit signal for existing long positions and the prerequisite for short setups or bearish options positions.
State Two – Transitioning (Change of Character)
The moment a stock in a confirmed HH/HL uptrend produces a lower low – breaking the sequence of ascending lows – is the Change of Character (CHoCH). This is not yet a confirmed downtrend. It is the first warning that the trend may be reversing. The CHoCH is the most important single structural signal in this cluster – it tells the trader to reduce exposure, tighten stops, and avoid new entries on the long side until the structure re-establishes.
State Three – Ranging
A stock that is neither making new highs nor new lows – oscillating between defined support and resistance without directional progression – is in a range. Ranging conditions require a completely different approach: mean-reversion entries near support and resistance rather than trend-following entries at breakouts and pullbacks.
The structure cluster's seven setups cover all three states and the transitions between them. Understanding which state the stock is in is the first filter applied – before regime score, before volume, before any pattern identification.
The Structure Cluster's Unique Position in the Architecture
The Structure cluster is the only cluster in the BreakoutBulletin architecture that operates as both a standalone trading framework and a prerequisite skill for every other cluster. A trader reading the Advanced cluster's Elliott Wave guide without first understanding HH/HL and LH/LL will misidentify impulse and corrective waves. A trader reading the Classic cluster's cup and handle guide without understanding range-bound structure will enter bases that are actually distribution ranges rather than accumulation bases.
Structure is the language. Every other cluster is a dialect of that language applied to specific market conditions.
The Seven Structure Setups
1. Higher Highs and Higher Lows: Market Structure Guide
The primary definition of an uptrend – each successive swing high exceeds the prior swing high, and each successive swing low is higher than the prior swing low. The HH/HL pattern sounds simple. Its application requires precision.
The guide establishes three specific rules for identifying swing highs and lows correctly: the minimum number of candles that must separate a swing high from the adjacent price action (three candles on each side – preventing single-day spikes from being misidentified as structural swing points), the timeframe hierarchy (daily chart structure takes precedence over intraday structure for swing trading), and the distinction between a swing low and a pullback (a swing low must show a complete reversal with at least one higher close, not merely a single down-day within an uptrend).
The practical trading application: the HH/HL identification is the prerequisite filter for every Classic and Momentum long setup. If the daily chart structure is HH/HL, Classic and Momentum setups at the current regime score are valid. If the structure is transitioning or LH/LL, no new long entries – the structural context undermines the setup's historical win rates.
Current relevance: In the May 2026 selective risk-off environment, stocks maintaining HH/HL structure on the daily chart while the index shows mixed signals are demonstrating the early relative strength signal that the Momentum cluster's early relative strength setup specifically targets.
→ Complete Higher Highs and Higher Lows Guide
2. Lower Highs and Lower Lows: Bearish Structure Explained
The bearish structural counterpart – each successive swing high is lower than the prior, and each successive swing low is lower than the prior. The LH/LL guide covers two distinct applications: identifying an existing downtrend that disqualifies long setups, and identifying the Change of Character transition where an uptrend begins showing LH/LL characteristics.
The CHoCH identification methodology is the guide's most practically valuable section. The transition from HH/HL to LH/LL does not happen instantaneously – it occurs through a sequence: first a swing high that fails to exceed the prior high (lower high forming), then a swing low that breaks below the prior low (lower low confirmed). The point at which both conditions are met is the CHoCH – the structural signal to exit long positions and reassess the thesis.
The guide documents the failure mode that traps most traders: buying the "higher low" within a developing LH/LL structure, interpreting it as a pullback in an ongoing uptrend when it is actually the second lower high in a new downtrend. The diagnostic tool – checking whether the most recent swing high exceeded the prior swing high – eliminates this confusion mechanically.
The bearish structure guide also covers the structural prerequisites for short setups: LH/LL on the daily chart, sector in active distribution (Participation Heatmap confirming outflows), and regime score below 2. All three conditions must be present before bearish setup entries are considered.
→ Complete Lower Highs and Lower Lows Guide
3. Range-Bound Trading Strategy
The mean-reversion framework for stocks oscillating between defined support and resistance without directional progression. Range-bound conditions produce the opposite trading approach from trending conditions – entries near support target the upper range boundary, entries near resistance target the lower range boundary, and exits before the level rather than at it.
The guide's analytical framework covers three range types with distinct trading implications. The tight range (less than 8% from support to resistance) is the institutional accumulation base – the Classic cluster's consolidation breakout setup applies here. The wide range (15-30% from support to resistance) requires genuine mean-reversion discipline – the full range must be visible and both levels must have multiple prior tests. The choppy range (irregular oscillation without clear levels) is the trap – it appears tradeable but lacks the defined structure that produces edge.
The volume signature distinguishes the genuine range from the distribution pattern. In accumulation ranges, volume decreases as the range continues – sellers are exhausting themselves. In distribution ranges, volume is erratic or increasing on down-days – institutional selling is occurring during apparent stability. The volume analysis from the Classic cluster's volume confirmation framework is essential for this distinction.
The exit discipline is the range trader's primary challenge. Taking profits before the opposite boundary – rather than holding for the full range width – produces significantly higher win rates than holding to the theoretical target, because ranges frequently reverse before completing the full expected move.
→ Complete Range-Bound Trading Strategy Guide
4. Triangle Chart Patterns: Ascending, Descending, Symmetric
The comparative guide to three structurally distinct triangle patterns – each with different directional implications, different formation requirements, and different volume signatures. The guide's central contribution is the disambiguation framework that competitors' guides consistently blur: the ascending triangle, descending triangle, and symmetric triangle are not three versions of the same pattern. They are three different structural situations requiring three different trading approaches.
The ascending triangle has a flat upper boundary and rising lower boundary – each pullback is shallower than the last. This is an accumulation pattern. Buyers are becoming more aggressive on each test of the resistance level. The flat top reflects a defined supply level being tested repeatedly. The breakout direction is typically upward – the accumulating buying pressure eventually overwhelms the defined supply. Volume should decline during formation and surge on the breakout.
The descending triangle has a flat lower boundary and declining upper boundary – each rally is weaker than the last. This is a distribution pattern. Sellers are becoming more aggressive on each test of the support level. The breakout direction is typically downward. Volume should decline during formation and expand on the breakdown.
The symmetric triangle has both converging boundaries – neither buyers nor sellers have a structural advantage. The breakout direction is not predetermined by the pattern itself – it is determined by the prevailing trend direction before the triangle formed. A symmetric triangle in an uptrend is a continuation pattern. A symmetric triangle in a downtrend is a continuation pattern downward.
MSFT's current symmetrical triangle on the daily chart – the live May 2026 example – is forming within a prior uptrend. The structure cluster's analysis: this is a continuation pattern with an upward resolution bias based on the prevailing HH/HL structure. The breakout direction must be confirmed by volume before entry – the symmetric triangle's unresolved nature requires this confirmation more than the ascending or descending triangle.
→ Complete Triangle Chart Patterns Guide
5. Wedge Patterns: Rising and Falling – Complete Guide
The counter-trend consolidation patterns that resolve in the opposite direction of their slope – the Structure cluster's primary reversal signal alongside the double bottom from the Classic cluster. Both rising and falling wedges are defined by two converging trendlines sloping in the same direction – distinguishing them from triangles (where one trendline is horizontal) and channels (where the trendlines are parallel).
The rising wedge in an uptrend signals exhaustion. Each new high within the wedge is made on declining momentum – the slope of the upper trendline is rising, but less steeply than the lower trendline. The convergence itself is the exhaustion signal: buyers can no longer push price as far above the lower boundary before sellers reassert control. Volume typically declines throughout the wedge formation and expands on the breakdown below the lower trendline.
The falling wedge in a downtrend signals capitulation. Each new low within the wedge is made on declining selling pressure – sellers are losing conviction even as price continues lower. Volume declines throughout the formation. The breakout above the upper trendline – on above-average volume – is the reversal signal.
The guide's failure mode section covers the most damaging wedge trading error: entering the breakdown from a rising wedge too early, before the lower trendline is definitively broken on volume. Many rising wedges produce one or two false breakdowns before the genuine break – the volume confirmation requirement eliminates the majority of false entries.
→ Complete Wedge Patterns Guide
6. Ascending Channel Trading Strategy
The parallel trendline framework for trading within an established uptrending channel – two parallel lines where the lower line connects the swing lows and the upper line connects the swing highs, both sloping upward at the same angle. The ascending channel is the structural formalisation of the HH/HL uptrend: the parallel lines quantify the trend's pace and provide specific, objective entry and exit levels.
The guide's trading framework distinguishes three entry types within a channel. The channel lower boundary entry – buying the pullback to the lower trendline – is the primary mean-reversion entry within a trend. The mid-channel entry – entering after the lower boundary hold is confirmed but before price reaches the upper boundary – is the lower-risk, lower-reward alternative for traders who miss the precise lower boundary touch. The channel upper boundary short – selling the rally to the upper trendline – is the counter-trend entry appropriate only for options traders and experienced short sellers in regime score 2 or below.
The channel validity requirements are more rigorous than standard trendline requirements: both the upper and lower boundaries must have at least two confirmed anchor points each (not just the lower boundary), the channel width must be consistent across the entire formation (not expanding or contracting), and the slope must be sustainable – channels sloping more than 45 degrees are typically unsustainable and should be treated as consolidations rather than ongoing trends.
The ascending channel connects directly to the pullback trading strategy in the Classic cluster – the lower channel boundary often aligns with Fibonacci retracement levels, producing the confluence entries that the Classic cluster identifies as highest-conviction.
→ Complete Ascending Channel Strategy Guide
7. Descending Channel Breakout Setup
The breakout setup from a downtrending parallel channel – identifying when the upper channel boundary is decisively broken on above-average volume, signalling a potential trend reversal from LH/LL to the beginning of a new HH/HL structure. The descending channel breakout is the Structure cluster's primary reversal entry signal – the moment the bearish structure that the LH/LL guide identified begins to fail.
The descending channel breakout has one structural advantage over other reversal patterns: the upper boundary is a precise, objective level rather than an interpreted resistance zone. Unlike a double bottom where the neckline must be estimated from prior price action, the descending channel's upper trendline is drawn from the confirmed swing highs – the breakout level is unambiguous.
The volume requirement on the breakout candle is more stringent than for Classic continuation breakouts: 75%+ above the 50-day average for large-caps rather than the standard 40%. Reversal breakouts from confirmed downtrends require more institutional conviction than continuation breakouts – the supply overhang from sellers trapped in the downtrend creates additional selling pressure that must be absorbed before the reversal is sustainable.
The guide's management framework covers the most important post-breakout decision: whether to hold through the first retest of the broken upper channel boundary (now acting as support) or to exit and re-enter at the retest. Data across the guide's qualifying setups shows that holding through the retest – provided the retest occurs on declining volume – produces higher average returns than exiting and re-entering, because the re-entry requires a second entry signal that does not always appear at a favourable price.
→ Complete Descending Channel Breakout Guide
Structure Setups: State and Condition Reference
| Setup | Market State | Regime Condition | Direction | Primary Entry Signal |
|---|---|---|---|---|
| Higher Highs/Lows | Trending up | Score 2-3 | Long bias | Swing low confirmed above prior low |
| Lower Highs/Lows | Trending down | Any – exit signal | Short bias / exit | CHoCH – first lower low confirmed |
| Range-Bound | Ranging | Score 2-3 | Mean-reversion | Support or resistance touch with volume |
| Triangle Patterns | Compressing | Score 2-3 | Breakout direction | Volume surge clearing boundary |
| Wedge Patterns | Counter-trend | Score 2-3 | Opposite of slope | Volume breakout through trendline |
| Ascending Channel | Trending up | Score 2-3 | Long at lower boundary | Lower boundary touch, declining volume |
| Descending Channel | Trending down – reversal | Score 1-2 (caution) | Long on breakout | Upper boundary break, 75%+ volume |
Reading the Current Market Through the Structure Framework
The May 2026 market provides clear examples of all three market states simultaneously – demonstrating why structure identification must precede any setup entry.
MSFT's symmetrical triangle compression is the clearest current example of State Three transitioning – the prior HH/HL uptrend has paused into a compressing range. The triangle is neutral until the breakout direction is confirmed by volume. No entry is appropriate until resolution.
Stocks maintaining HH/HL structure on the daily chart despite the index's moderate volatility are demonstrating State One – the prerequisite for Classic and Momentum long setups at half-size in the current score 2 environment. These are the stocks the early relative strength setup and the cup and handle guide identify as primary candidates.
Stocks showing the CHoCH – their first lower low after a prior HH/HL uptrend – are in the transition between State One and State Two. These are the exit signals for existing long positions, not entry points for new ones, regardless of how tempting the apparent "discount" appears.
The Structure Cluster's Role in the Broader Architecture
The Structure cluster is the analytical foundation for every other cluster. Without HH/HL identification, the Classic cluster's pullback and support bounce setups cannot be applied correctly – they require the trend to be intact. Without LH/LL identification, the exit from Classic and Momentum positions becomes discretionary rather than structural. Without range identification, the consolidation breakout setup cannot be distinguished from a genuine range trade.
The Advanced cluster's Elliott Wave guide is the most direct extension of the Structure cluster – Wave Theory is fundamentally a framework for categorising HH/HL (impulse waves) and LH/LL or corrective sequences within a larger trend context. Proficiency in the Structure cluster's HH/HL and LH/LL identification is the prerequisite for applying Elliott Wave analysis correctly.
The triangle and wedge guides connect directly to the Classic cluster's consolidation breakout setup – the entry mechanics, volume requirements, and stop placement are identical. The difference is analytical: the Structure cluster's guides teach the trader to identify which type of compression is forming before the breakout occurs, allowing more precise entry timing and more appropriate directional expectations.
For the complete overview of all five clusters and 36 individual setup guides, see the Trading Setups and Patterns Master Guide.
FAQ
Q: What is the "Change of Character" (CHoCH) in market structure?
A: The Change of Character (CHoCH) occurs when a stock in a confirmed uptrend (HH/HL) produces its first lower low. This is a critical structural warning that the trend may be reversing, signaling traders to tighten stops and avoid new long entries.
Q: How do you distinguish between a triangle and a wedge?
A: Triangles (Ascending, Descending, Symmetric) typically have at least one horizontal boundary or converging boundaries with opposite slopes. Wedges (Rising and Falling) are defined by two converging trendlines that slope in the same direction, signaling price exhaustion or capitulation.
Q: Why does the "Descending Channel Breakout" require higher volume?
A: Reversal breakouts from a descending channel require a volume surge of at least 75% above the 50-day average. This is because the breakout must absorb significant "overhead supply" from sellers trapped during the prior downtrend to sustain a new uptrend.
BreakoutBulletin | Trading Education. Educational commentary only. Not investment advice. Market structure examples referenced as of May 2026 – MSFT triangle formation cited as current example. Verify current chart conditions before applying any setup. Past performance does not guarantee future results.