
BreakoutBulletin | BB Macro Intelligence Series
Part of the Macro Intelligence Master Guide
Educational commentary only. Not investment advice.
When Fear Enters the Market
Every market cycle eventually reaches a phase when uncertainty rises. Economic growth slows. Inflation becomes unpredictable. Interest rates move sharply. Recession concerns surface.
When this happens, a consistent pattern emerges. Capital moves toward a specific group of companies: utility providers, consumer staples firms, telecommunications businesses, and large healthcare names. These are defensive stocks, and their defining characteristic is not rapid growth – it is earnings reliability across economic cycles.
In 2022, when the S&P 500 fell 19%, utilities declined only 1%. Consumer staples gained slightly. That divergence is the defensive sector in operation, and understanding it explains why market leadership shifts so decisively during periods of stress. It also completes the four-house framework in the Sorting Hat for Stocks – defensive companies belong to House Hufflepuff.
What Makes a Stock Defensive
Defensive companies share three structural characteristics that distinguish them from cyclical or growth businesses.
First, they sell products or services that consumers continue purchasing regardless of economic conditions. Electricity is needed whether the economy is expanding or contracting. Household goods are purchased through recessions. Prescription medications are not deferred because markets fall.
Second, their revenues do not fluctuate as sharply as those of cyclical industries. During the 2008 financial crisis, S&P 500 earnings fell 23%. Consumer staples earnings fell only 5%. Utilities earnings rose slightly. That earnings stability is the foundation of defensive performance – not the absence of risk, but the reduction of earnings volatility.
Third, most defensive companies pay regular dividends. Predictable income becomes particularly attractive when capital gains are uncertain and market volatility is elevated.
Why Capital Rotates Into Defensives
During market stress, investor priorities shift from growth to stability. Defensive sectors offer consistent revenue streams from businesses providing essential services, which makes their earnings relatively resistant to economic deterioration.
This rotation is measurable. In the 2022 bear market, defensive sectors fell approximately 5–10% while cyclicals fell 20–30%. The protection is real but not absolute – defensives still decline during broad selloffs, just significantly less than the broader market.
During strong economic expansions, the opposite holds. When investors become optimistic about growth, capital rotates toward higher-growth sectors. In the 2020–2021 recovery, the S&P 500 gained over 40% while utilities gained roughly 15%. Stability in downturns comes at the cost of underperformance in recoveries. That trade-off is the defining characteristic of the Hufflepuff house.
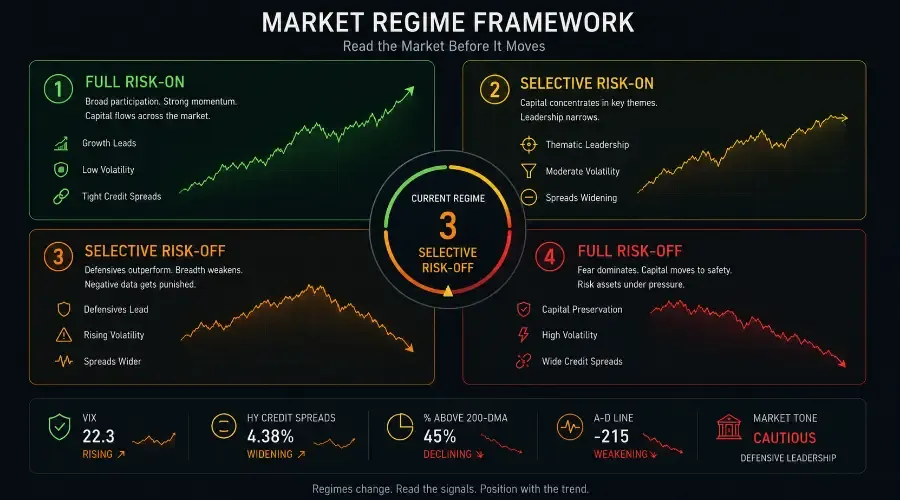
This risk-on/risk-off dynamic connects directly to the Risk-On vs Risk-Off Markets framework, where defensive sector leadership is one of the primary signals that the market has shifted into a risk-off regime.
The Dividend Yield Mechanism
Defensive sectors attract income-oriented capital during uncertain periods, but dividend attractiveness is not fixed – it moves with interest rates.
A utility paying a $2.00 annual dividend and trading at $40 yields 5%. If the 10-year Treasury rises to 4.5%, that utility yield looks considerably less attractive relative to a risk-free government bond. The stock price may need to fall to approximately $36 to offer a sufficient premium over the risk-free rate to justify the additional equity risk.
This is arithmetic, not speculation. A utility yielding 4% when Treasuries yield 1% (as in 2020) is very different from the same utility yielding 4% when Treasuries yield 4.5%. The same dividend stream carries different relative value at different rate levels.
Investors monitor payout ratios as the primary indicator of dividend sustainability. Payout ratios below 70% are generally stable. Ratios above 80% warrant scrutiny, particularly if earnings come under pressure from an economic slowdown. These figures appear in company financial statements and quarterly earnings releases.
The interaction between defensive stocks and interest rates is covered in more depth in Why Rising Interest Rates Hurt Growth Stocks, which explains the discount rate mechanics that affect both long-duration growth names and dividend-paying defensives.
Which Sectors Qualify as Defensive
Several S&P 500 sectors carry structural defensive characteristics.
Utilities provide electricity, water, and gas – services with stable demand regardless of economic conditions. Their revenues are largely regulated, which limits both upside and downside. Key ETF: Utilities Select Sector ETF (XLU).
Consumer Staples sell everyday products with consistent demand across cycles: groceries, household goods, personal care items. Coca-Cola, Procter & Gamble, and Colgate-Palmolive are frequently cited examples. Key ETF: Consumer Staples Select Sector ETF (XLP).
Health Care provides treatments and services that are not easily deferred during economic slowdowns. Patients do not defer cancer treatment or essential prescriptions because of a recession. Key ETF: Health Care Select Sector ETF (XLV), which covers pharmaceuticals, insurers, and medical equipment makers.
Telecommunications generates recurring subscription revenue from phone and internet services that have become structural necessities. Key ETFs: iShares U.S. Telecom ETF (IYZ), Vanguard Communication Services ETF (VOX).
REITs occupy a middle position. Their dividends and essential real estate services carry some defensive characteristics, but their high debt loads and rate sensitivity made them one of the worst-performing sectors in 2022, down significantly more than traditional defensives. They function as partial defensives, not full ones – and the distinction matters during rate-hike cycles.
Interest Rates: The Primary Risk to Defensive Stocks
Utilities and REITs carry high debt levels and are typically valued relative to their dividend yield. When Treasury yields rise, investors require a higher yield from these sectors to justify holding equities over risk-free bonds – and that adjustment happens through price declines, not yield increases.
With the 10-year Treasury near 4.15% in March 2026, utilities yielding 3.5% face a structural valuation challenge. In 2020, with yields at 1%, those same utility dividends looked substantially more attractive by comparison.
This rate sensitivity also creates the defensive sector's central tension in the current environment: slowing growth increases the appeal of earnings stability, while elevated yields pressure valuations. The Market Regime Identification Framework addresses this tension directly, classifying market conditions by whether rate pressure or growth fear is the dominant force – a distinction that determines whether defensives attract or repel institutional flows.
What to Monitor in Defensive Sectors
Four indicators carry the most weight when evaluating defensive sector conditions.
Dividend sustainability – Payout ratios below 70% signal a comfortable margin. Above 80%, earnings would need to hold steady or grow to maintain the dividend. Check these quarterly in earnings reports.
Debt levels – Defensive sectors are capital-intensive. Utilities commonly carry debt-to-equity ratios above 100%. Ratios above 150% become concerning when interest rates are rising, as refinancing costs increase directly. Balance sheet strength separates resilient defensives from vulnerable ones during rate-hike cycles.
Regulatory environment – Utilities and telecoms operate under regulatory frameworks that determine pricing power. Rate case outcomes from state utility commissions, spectrum auctions, and political developments can shift profit outlooks materially.
Earnings standard deviation vs the broader market – The defining quantitative measure of defensive character is earnings volatility. A genuine defensive stock shows significantly lower earnings standard deviation than the S&P 500 over a full cycle. This comparison appears in most institutional research on sector characterisation.
Where We Are Now: March 2026
As of March 2026, defensive sectors face competing forces. The 10-year Treasury yield sits near 4.15%, creating valuation headwinds for dividend-paying sectors – utilities and REITs carry the most direct exposure to this pressure.
At the same time, recession concerns are building. February's payrolls report showed a surprise decline of 92,000 jobs. Oil above $100 per barrel is feeding through into input costs across industries. Geopolitical tensions involving Iran are disrupting supply expectations and elevating uncertainty.
This combination – slowing growth alongside still-elevated yields – is the most difficult environment for defensives to navigate. Rate pressure compresses valuations while growth fears simultaneously attract capital toward stability. If yields stabilize or decline as growth slows further, defensive sectors are positioned to attract significant institutional flows. If yields continue rising despite slowing growth, even stable earnings may not protect stock prices from valuation compression. The dynamic is covered in the context of full recession positioning in Best Stocks During a Recession.
Note: By April 2026, the 10-year yield has risen to approximately 4.4%, intensifying the valuation headwind for dividend-paying defensives.
Implementation: Gaining Defensive Exposure
Sector ETFs provide the most direct access to defensive sectors without single-stock risk.
For broad defensive baskets, the Invesco S&P 500 High Dividend Low Volatility ETF (SPHD) selects defensive, high-dividend names across sectors. The iShares MSCI USA Min Vol Factor ETF (USMV) targets low-volatility stocks across the full market.
Individual sector ETFs: XLU for utilities, XLP for consumer staples, XLV for healthcare, IYZ or VOX for telecommunications.
Widely followed single-stock names in the space include Procter & Gamble (PG), Coca-Cola (KO), Johnson & Johnson (JNJ), and NextEra Energy (NEE). Single stocks offer higher return potential but carry company-specific risks that ETFs diversify away.
Key Takeaways
| Concept | Summary |
|---|---|
| Defensive characteristic | Stable earnings from essential services; limited cyclical exposure |
| 2022 comparison | Utilities -1% vs S&P 500 -19%; consumer staples gained |
| 2008 comparison | Staples earnings fell 5% vs S&P 500 earnings fell 23% |
| Primary risk | Rising interest rates compress valuations through yield competition |
| Payout ratio threshold | Below 70% stable; above 80% warrants scrutiny |
| Rate-sensitive defensives | Utilities and REITs most exposed; healthcare and staples less so |
| Current environment | Slowing growth supports appeal; 4.15% Treasury yields pressure valuations |
Go Deeper: Breakout Bulletin Macro Intelligence Series
- The Sorting Hat for Stocks – Master guide to all four macro stock groups
- How to Read the Stock Market Like a Professional: The 5-Layer Framework – Regime identification, internals, and daily execution
- Why Rising Interest Rates Hurt Growth Stocks – How rate cycles affect defensive valuations
- How a Strong Dollar Affects the S&P 500 – Currency effects on multinational earnings
- Why Commodity Booms Lift Cyclical Stocks – The rotation out of defensives during expansion phases
- Best Stocks During a Recession – Applied recession positioning across defensive and non-defensive sectors
- Stocks Rising While Market Falls – Hidden strength signals in defensive sectors during downturns
- Stocks Rising While Market Falls: Case Studies – Real examples from 2022, 2008, and 2020
- Risk-On vs Risk-Off Markets Explained – How defensive leadership signals regime shifts
- Market Regime Identification Framework – Classifying the current environment
This article is published by BreakoutBulletin for educational purposes only. It does not constitute investment advice or a recommendation to buy or sell any security. Defensive sector performance varies across market cycles and should be interpreted within broader macroeconomic conditions. References to specific ETFs, sectors, and historical examples are for illustrative purposes only. Past performance is not indicative of future results. BreakoutBulletin is an educational content platform and is not a registered investment advisor, broker-dealer, or financial institution.