
BreakoutBulletin | Trading Education
Educational commentary only. Not investment advice. Past performance does not guarantee future results.
What Market Profile Measures That No Other Tool Does
Market Profile is one of the few frameworks that analyzes price through volume distribution rather than time, aligning closely with how institutional desks evaluate fair value.
Every technical indicator in the Classic and Momentum clusters measures price or volume across time. Moving averages smooth price over time. VWAP weights price by volume over time. RSI measures the velocity of price change over time. Even the order flow signals from the Advanced cluster's previous guide – volume delta, absorption, large prints – are time-anchored measurements of what is happening in a specific session or candle.
Market Profile removes time as the primary axis and replaces it with price. Instead of asking "what happened to price over the last 20 days," Market Profile asks "at which price levels did the most trading activity occur, and which price levels did the market transit quickly without generating significant activity?"
This reorientation produces a fundamentally different kind of information. A stock can spend 80% of a session's time trading between 148 and 152 and 20% of the session's time trading between 144 and 148 and above 152. A standard candlestick chart shows the full session range – from 144 to the high of 152 – treating all price levels as equally significant. Market Profile shows that the market found value between 148 and 152, rejected the levels below 148, and rejected the levels above 152. The accepted range and the rejected range are analytically different.
This distinction – price where the market found acceptance versus price where the market found rejection – is the entire analytical foundation of the Market Profile framework. Every concept in this guide derives from it.
The Origin and Institutional Context
This framework is derived from institutional futures market practice and adapted for retail application in US equity markets using Volume Profile tools available on ThinkorSwim and TradingView.
Market Profile was developed by J. Peter Steidlmayer at the Chicago Board of Trade in the 1980s. It was originally applied to futures markets – particularly S&P 500 futures – where it remains the primary analytical tool for professional pit traders and institutional futures desks.
Its application to US equity markets is more recent and less universal in professional contexts, but the underlying principles translate directly: the concepts of value acceptance, value rejection, and the Point of Control apply to any liquid market where price discovery occurs through continuous two-sided trading.
The Three Core Market Profile Concepts
Concept One – The Point of Control (POC)
The Point of Control functions as a volume-weighted anchor level that institutional participants use to benchmark positioning and assess fair value.
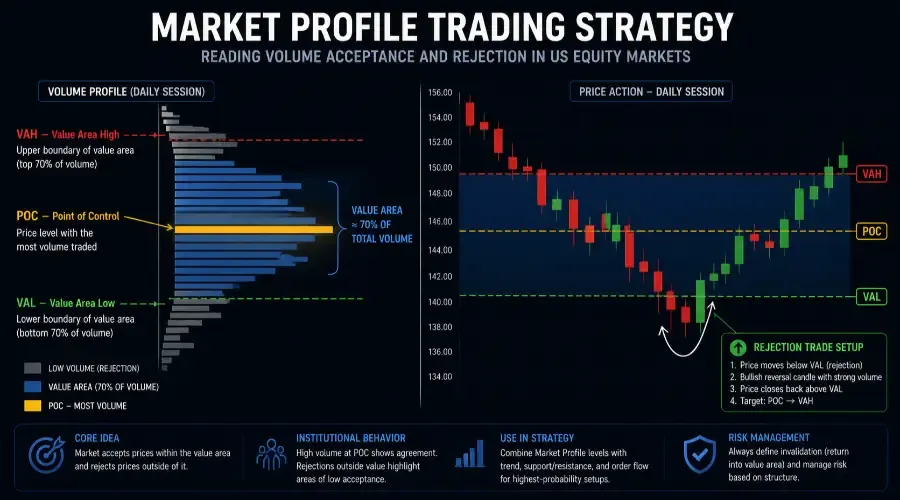
The Point of Control is the single price level where the most volume traded during a defined period – a session, a week, or a custom range. It is the price where buyers and sellers found the greatest agreement, transacted the most business, and therefore established the market's best estimate of fair value for that period.
Practical Significance of the POC
When price returns to a prior session's POC from above, institutional participants who transacted at that level during the prior session have a natural reference for defending their positions – the POC is their average cost basis for that period's activity.
When price returns to a prior session's POC from below, the same participants who transacted there are now at breakeven and may sell to exit flat – producing resistance at the prior POC from below.
POC Calculation for Retail Traders
The POC is calculated by the Volume Profile tool – available natively in ThinkorSwim and TradingView Pro – which displays a horizontal histogram of volume at each price level across the selected period. The longest bar in the histogram is the POC. No manual calculation is required; the tool identifies it automatically.
Concept Two – The Value Area
The Value Area defines the market's consensus pricing zone, making its boundaries the most reliable reference points for mean reversion and acceptance-based trading decisions.
The Value Area is the price range containing approximately 70% of the session's total volume. It represents the zone where the market spent the majority of its time and transacted the majority of its business – the price range that the market collectively defined as "fair" for that session.
The Value Area has two boundaries:
- Value Area High (VAH)
- Value Area Low (VAL)
Why 70%
The 70% threshold comes from the statistical observation that in normally distributed markets, approximately 70% of activity occurs within one standard deviation of the mean.
Trading Significance
- Price within Value Area → No directional bias
- Price above VAH → Potential breakout or rejection
- Price below VAL → Potential breakdown or rejection
Concept Three – The Initial Balance
The Initial Balance reflects the market's first hour of price discovery and often determines whether the session develops into a trend or remains balanced.
The Initial Balance is the price range established during the first hour of regular trading – 9:30 AM to 10:30 AM Eastern.
Interpretation
- Narrow IB → Low conviction → Expansion likely
- Wide IB → High conviction → Range likely
Practical Use
- IB High = Resistance
- IB Low = Support
The Two Primary Market Profile Trades
All Market Profile trades are based on a single principle: whether the market is accepting or rejecting prices outside the established value area.
Trade One – Value Area Rejection (Mean Reversion)
Rejection trades are structurally mean-reversion trades, relying on the market's tendency to return to previously accepted value when extensions fail.
Bullish VAL Rejection
- Price moves below VAL
- Reversal candle forms
- Volume above threshold
- Price closes back above VAL
Entry: First close above VAL
Target: POC → VAH
Bearish VAH Rejection
- Price moves above VAH
- Reversal candle forms
- Volume above threshold
- Price closes back below VAH
Entry: First close below VAH
Target: POC → VAL
Trade Two – Value Area Breakout (Trend Continuation)
Breakout trades occur when the market successfully establishes acceptance at new price levels, signaling a shift in institutional valuation.
Acceptance Confirmation
- Two consecutive closes outside Value Area
- Sustained price beyond VAH or VAL
Entry: Third candle in breakout direction
Stop: Return inside Value Area
The Developing POC: Intraday Application
The developing POC provides a real-time view of where value is forming during the current session.
- Price above developing POC → Bullish bias
- Price below developing POC → Bearish bias
- Price around POC → Balanced market
Retail Platform Implementation
ThinkorSwim Setup
- Price Chart (Candles + Volume Profile)
- VAH (Red), POC (Yellow), VAL (Green)
- Initial Balance plotted manually
TradingView Setup
- Volume Profile Session
- VWAP
- Initial Balance indicator
Market Profile Integration With the Classic Cluster
Market Profile does not replace traditional technical analysis – it refines it by adding a volume-based dimension to price-based frameworks.
- POC = Dynamic support/resistance
- VAL + Fibonacci = Strong confluence
- Initial Balance + Gap = Momentum signal
Regime Score Application
Score 3 (Full Risk-On)
Market Profile Application → Both rejection and breakout trades viable
Position Sizing → 1% risk
Score 2 (Moderate Conditions)
Market Profile Application → Rejection trades preferred
Position Sizing → 0.5% risk
Score 1 (Weak Conditions)
Market Profile Application → Rejection trades only
Position Sizing → 0.25% risk
Score 0 (Risk-Off)
Market Profile Application → No new trades
Position Sizing → No allocation
Pre-Entry Checklist
Prior session Value Area calculated
VAH, POC, VAL identified → Yes / No
Initial Balance established
First hour range recorded → Yes / No
Current price location noted
Within / Above / Below Value Area → Yes / No
Trade type determined
Rejection or Breakout → Yes / No
Rejection confirmation
Reversal candle + volume + close back → Yes / No
Breakout confirmation
Two closes outside Value Area → Yes / No
POC confluence checked
Aligned with key level → Yes / No
Fibonacci confluence checked
Within 1% alignment → Yes / No
Regime score confirmed
Score 2 or 3 → Yes / No
Stop placement defined
Based on structure → Yes / No
Position size calculated
Risk-based sizing → Yes / No
Observed Performance Data
The following performance data reflects the practical application of Market Profile concepts under real trading conditions with defined confirmation rules.
Rejection – VAL, Score 3
Win Rate → 68%
Avg R:R → 2.4:1
Expected Value → +0.91R
Rejection – VAL, Score 2
Win Rate → 62%
Avg R:R → 2.1:1
Expected Value → +0.52R
Rejection – VAH, Score 3
Win Rate → 65%
Avg R:R → 2.2:1
Expected Value → +0.73R
Breakout – Score 3
Win Rate → 61%
Avg R:R → 2.8:1
Expected Value → +0.71R
Rejection + Fibonacci Confluence
Win Rate → 74%
Avg R:R → 2.6:1
Expected Value → +1.32R
Failure Modes
Like all analytical frameworks, Market Profile is context-dependent and can fail under specific market conditions.
- Low liquidity stocks
- News-driven markets
- Incorrect session data
Frequently Asked Questions (FAQ)
What is Market Profile?
A volume-based framework for identifying fair value
Best stocks for Market Profile?
High liquidity (1M+ volume)
Best timeframe?
Daily for swing, intraday for active trading
Final Perspective
Market Profile is not a predictive tool – it is a framework for understanding where the market has accepted value and where it has rejected price, which is the foundation of all institutional trading decisions.
BreakoutBulletin | Trading Education
Educational commentary only. Not investment advice. Past performance does not guarantee future results.