
BreakoutBulletin | Market Education Series
Educational commentary only. Not investment advice. Past performance does not guarantee future results.
If you’ve ever watched the VIX spike above 30 and wondered, “Is this the time to sell premium?” – you’re asking the right question, but at the wrong scale. Most traders look at a single stock’s elevated IV and sell an iron condor. That’s the theta decay approach. But when the entire market is in a panic – when the VIX hits the 90th percentile and the term structure inverts – you’ve entered the territory of the IV extremes setup. This isn’t routine premium selling. It’s volatility mean-reversion trading at the macro level. And it requires a completely different playbook.
Let’s walk through that playbook – signal by signal, filter by filter.
The Scale Difference That Changes Everything
The IV crush guide covers premium selling around individual earnings events. The theta decay guide covers premium selling in elevated non-event IV environments at the individual stock level. Both operate on single-stock IV rank as the primary signal.
The IV extremes setup operates at a different scale entirely. It is not triggered by an individual stock's IV rank. It is triggered when the entire options market reaches a volatility extreme – when the VIX, the market-wide measure of implied volatility on S&P 500 options, moves to a reading that historically signals structural overpricing across the entire options market simultaneously.
This scale difference changes everything about how the signal is identified, how positions are structured, and how they are managed. At the individual stock level, IV rank above 50 is moderately elevated. At the market level, VIX above the 90th percentile represents a fear spike that historically mean-reverts with a consistency that individual stock IV extremes do not match.
The IV extremes setup is the macro-level premium selling strategy. It uses market-wide volatility measurement to identify when the entire options market is paying excessive fear premium – and positions to collect that premium across multiple sectors simultaneously rather than in a single stock.
VIX as the Primary Signal
The VIX measures the 30-day implied volatility of S&P 500 index options. It represents the market's collective pricing of uncertainty across the entire large-cap US equity universe. When investors are fearful, they buy put options aggressively for portfolio protection – driving up option prices and therefore driving up the VIX. When fear subsides, options become cheaper and VIX declines.
The structural tendency that makes the IV extremes setup viable: VIX spikes are historically mean-reverting. A VIX reading of 40 has never persisted for more than a few weeks before declining toward long-term averages. This mean reversion is not guaranteed in any specific instance – but the historical tendency is documented and consistent enough to build a systematic strategy around.
VIX percentile vs VIX absolute level:
The VIX absolute level is less useful than VIX percentile – where the current reading sits relative to its 52-week historical range. A VIX of 25 is alarming in a low-volatility regime but unremarkable in a historically volatile period. VIX percentile contextualises the current reading against the full historical distribution.
VIX percentile = Current VIX closing value ranked against all daily closing values over the past 252 trading days
Practical calculation for retail traders:
VIX percentile is not displayed natively on most retail platforms. Three methods to calculate it:
Method One – ThinkorSwim: The PercentRank thinkScript function implements this directly. Search "VIX percentile" in the ThinkorSwim indicator library – multiple community scripts are available that calculate the rolling 252-day percentile automatically. Add VIX as the underlying and the indicator plots the percentile.
Method Two – Excel or Google Sheets: Download VIX daily closing prices from Yahoo Finance (ticker: ^VIX). Take the last 252 rows (one trading year). In an empty cell, enter =PERCENTRANK.INC(range, current_value) where range is the 252 closing values and current_value is today's VIX close. The result is a decimal – multiply by 100 for the percentile. Update weekly rather than daily.
Method Three – TradingView: Search "VIX percentile 52 week" in the TradingView indicator library. Multiple community-authored scripts implement this directly and plot the percentile as a separate panel below the VIX chart.
Update the percentile reading weekly – VIX extreme signals at this strategy's scale do not require intraday monitoring.
VIX Percentile Table
| VIX Percentile | Market Condition | IV Extremes Signal |
|---|---|---|
| Above 90th percentile | Extreme fear – panic put buying | Primary signal – strongest setup |
| 75th-90th percentile | Elevated fear – meaningful overpricing | Secondary signal – selective entry |
| 50th-75th percentile | Moderate – no extreme present | No signal – use theta decay instead |
| Below 50th percentile | Complacency – IV low | No signal – buyer's market |
VIX Absolute Level Reference
| VIX Absolute Level | Historical Context |
|---|---|
| Below 15 | Complacency – historical low-vol regime |
| 15-20 | Normal – baseline market uncertainty |
| 20-30 | Elevated – meaningful fear premium present |
| 30-40 | High fear – significant overpricing likely |
| Above 40 | Extreme fear – historical mean-reversion setups strongest |
VIX above 40 has occurred in a small number of documented historical episodes: the 2008 financial crisis, March 2020 COVID crash, August 2015 China devaluation, and the April 2025 tariff shock. Each episode eventually resolved with VIX mean-reverting toward 15-20. Premium sellers who entered during these spikes collected historically elevated premium with subsequent strong mean-reversion tailwinds.
The Term Structure Confirmation
VIX percentile alone is necessary but not sufficient. The VIX term structure – the relationship between near-term and longer-term volatility expectations – provides the confirmation signal.
VIX term structure:
Contango (normal): Near-term VIX below longer-term VIX. Market expects volatility to remain elevated but not escalate. Premium selling is viable but not confirmed.
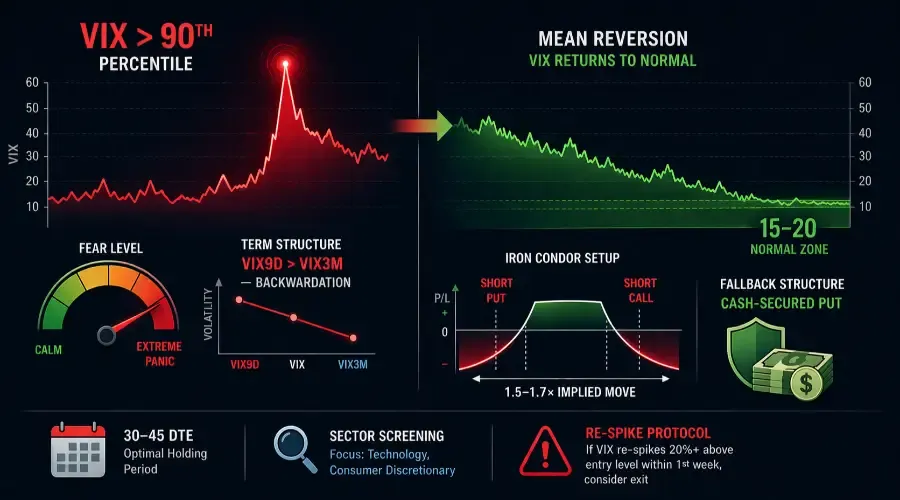
Backwardation (inverted): Near-term VIX above longer-term VIX. Market expects immediate volatility to subside. This is the condition most favourable to premium sellers – near-term fear is maximally priced and expected to normalise.
VIX9D vs VIX vs VIX3M comparison:
VIX9D measures 9-day implied volatility. VIX measures 30-day. VIX3M measures 3-month. When VIX9D is significantly higher than VIX3M, the term structure is in steep backwardation – near-term fear is maximally elevated relative to medium-term expectations. This confirms the IV extreme is a fear spike rather than a structural volatility regime shift.
Where to find VIX term structure data: VIX9D trades under ticker VIX9D on ThinkorSwim and can be added as a separate symbol for comparison. On TradingView, search VIX9D directly. VIX3M trades as VIX3M on both platforms. On Interactive Brokers, both are available as index quotes. If your platform does not provide VIX9D, the CBOE website (cboe.com/volatility) publishes all VIX family indices daily – a morning check before market open is sufficient for this strategy's entry timing.
Term structure confirmation rule: Proceed with the IV extremes setup only when VIX is in backwardation – VIX9D above VIX3M. If VIX9D is below VIX3M (contango), the market is pricing escalating volatility ahead – not a suitable premium selling environment regardless of VIX absolute level or percentile.
From Market Signal to Individual Position: The Three-Step Screening Process
Step One – Sector IV rank screening:
Not all sectors spike equally during market fear events. High-beta sectors (technology, consumer discretionary, communication services) experience the most dramatic IV spikes because institutional investors purchase the most put protection on these positions. Target sectors where individual stock IV rank is above 70.
Step Two – Individual stock Move Ratio confirmation:
Within the high-IV-rank sectors, apply the Move Ratio filter using annualised figures:
Annualised 30-day Historical Realised Volatility ÷ Annualised 30-day Implied Volatility
Both inputs must be annualised – use HV(30) on ThinkorSwim, Historical Volatility on Tastytrade, or Hist Vol on Interactive Brokers. Both should read in the same 20-60% range for liquid S&P 500 names. If one reads as a decimal and one as a percentage, one platform is displaying non-annualised data – standardise before calculating.
Stocks where this ratio is below 0.70 – implied volatility substantially exceeds recent actual movement – are the individual position candidates.
Important practical note during severe selloffs: When VIX is above 40, realised volatility rises alongside implied volatility as stocks actually move more day to day. The Move Ratio may remain above 0.70 for most stocks even though IV is elevated in absolute terms – because both numerator and denominator are elevated simultaneously. This is normal and expected. Do not lower the threshold to force trades. In severe episodes, the eligible candidate set genuinely shrinks. Fewer trades at higher quality is the correct outcome. If the Move Ratio filter eliminates all candidates, the cash-secured put on a fundamentally strong name with the highest IV rank is the appropriate fallback – not a stretched iron condor on a marginal candidate.
Step Three – No catalysts within holding period:
No earnings, no FOMC within the holding period, no company-specific events. The IV extremes setup profits from market-wide fear subsiding – individual catalysts introduce company-specific risk that the market-level signal does not price.
Position Structures for IV Extremes
Primary structure – Iron condor (30-45 DTE):
Strike placement follows the theta decay guide's methodology with one modification: short strikes placed wider than the theta decay default to acknowledge elevated realised volatility alongside elevated implied volatility.
| VIX Percentile | Short Strike Placement | Rationale |
|---|---|---|
| 75th-90th | 1.3-1.5× 30-day implied move | Standard-to-wide placement |
| Above 90th | 1.5-1.7× 30-day implied move | Wider placement – elevated realised vol |
Critical liquidity warning specific to VIX extremes: During panic episodes, bid-ask spreads on OTM option wings can widen dramatically – sometimes to 50%+ of the short strike premium. The 20% spread threshold from the theta decay guide may be temporarily unachievable. If you cannot get a reasonable fill on both wings within 20% of mid-price after two limit order attempts, do not trade the iron condor. The structure is not executable at that moment. Use the cash-secured put or put credit spread instead – two-leg or single-leg structures maintain better liquidity during panic than four-leg iron condors.
Secondary structure – Cash-secured put on high-quality names:
During market-wide fear spikes, high-quality companies with strong balance sheets experience put IV spikes driven by macro fear rather than company-specific deterioration. Selling cash-secured puts on S&P 500 large-cap names with strong fundamentals during VIX extremes is the most straightforward IV extremes trade. If assigned, you own shares of a fundamentally strong company at a price below the pre-spike level – an additional benefit beyond the premium collected.
Tertiary structure – Put credit spread (when iron condor wings are illiquid):
During VIX extremes, put implied volatility is typically higher than call implied volatility due to institutional put buying – put skew is elevated. When iron condor wing liquidity fails the spread test, the put credit spread captures the elevated put skew with only two legs:
Sell OTM put at 1.3-1.5× expected 30-day move below current price. Buy further OTM put $5-10 lower for protection. Net credit collected. Maximum profit: credit collected. Maximum loss: (strike width – credit) × 100.
The put credit spread sacrifices the call-side premium of the iron condor but maintains executable liquidity during the most extreme VIX readings when four-leg execution is impractical. It is the correct structural fallback when iron condor wings cannot be filled within acceptable spread parameters.
The Mean-Reversion Timeline
| VIX Starting Level | Median Sessions to Return to 20 | Median Sessions to Return to 15 |
|---|---|---|
| 30-35 | 15-25 sessions | 35-55 sessions |
| 35-45 | 25-40 sessions | 55-80 sessions |
| Above 45 | 40-65 sessions | 80-120 sessions |
Based on VIX extreme episodes January 2000-December 2025 where VIX closed above the stated threshold for at least 3 consecutive sessions.
Mean-reversion DTE alignment:
| VIX Level at Entry | Recommended DTE | Rationale |
|---|---|---|
| 30-40 | 30-35 DTE | Standard – mean reversion aligns with holding period |
| 40-50 | 35-45 DTE | Extended – allows more reversion time |
| Above 50 | 45 DTE | Maximum – extreme readings take longest to normalise |
The Regime Paradox and How to Resolve It
The IV extremes setup creates an apparent contradiction with the regime scoring system. The regime score framework says no new premium selling positions at regime score 0-1 – the exact conditions when VIX extremes occur.
This is not a contradiction. It is a distinction between strategy types.
The theta decay guide's regime score filter is designed for routine non-event premium selling. In regime score 0-1 environments, routine theta decay positions face elevated gap risk and sustained trend momentum that can breach short strikes across multiple sessions. The regime filter correctly suppresses routine premium selling in these conditions.
The IV extremes setup is specifically designed for regime score 0-1 environments – trading against the fear spike rather than alongside the trend. The two strategies are designed for opposite market conditions. Apply the regime score filter to the theta decay strategy. Apply the VIX percentile and term structure filters to the IV extremes strategy. Do not cross-apply.
Signal strength and portfolio allocation are separate dimensions. The highest-conviction signal (VIX above 90th percentile) occurs in regime score 0 environments – which simultaneously carry the highest tail risk. The smaller total allocation at score 0 versus score 1 reflects that tail risk constraint, not a weaker signal. More premium per position is available at score 0; fewer total positions are appropriate because the path to mean-reversion may include additional VIX spikes before resolution.
| Regime Score at Entry | VIX Percentile | Position Size | Total Portfolio Cap |
|---|---|---|---|
| Score 1 | 75th-90th | 3% per position | 15% total |
| Score 0 | 75th-90th | 2% per position | 10% total |
| Score 0 | Above 90th | 3% per position | 12% total – strongest signal, elevated tail risk |
Managing Positions After Entry
The 50% profit rule: Close when the position reaches 50% of maximum profit – identical to the theta decay and IV crush guides. Do not hold for the remaining 50% through escalating gamma and tail risk.
If VIX re-spikes after entry:
A VIX re-spike – particularly if VIX rises more than 20% above the entry-day level – means short strikes are under increased pressure because realised volatility has escalated further.
Two scenarios: if the re-spike occurs within the first week of the holding period and the position has not yet lost more than 30% of net premium collected, close the position for a small loss or breakeven – the risk-reward at the new VIX level has deteriorated beyond the entry parameters. If the re-spike occurs after the position has already collected 30-40% of maximum profit, the existing buffer provides some protection – hold but monitor daily against the adjustment triggers. Do not add new positions during a re-spike. The re-spike extends the mean-reversion timeline and increases gap risk simultaneously.
The adjustment triggers:
- Stock moves within 2% of either short strike → close the entire position or close the threatened leg
- Position at 21 DTE without reaching 50% profit → assess gamma risk and close or roll
- VIX re-spikes more than 20% above entry level within first week → close for small loss
Pin risk: Exit all legs before 3:30 PM ET on expiration Friday – identical guidance as all other Options cluster posts.
Pre-Entry Checklist
| Condition | Threshold | Check |
|---|---|---|
| VIX percentile confirmed | Above 75th – ideally above 90th | Yes / No |
| VIX percentile calculated correctly | 252-day daily closes, PERCENTRANK or platform indicator | Yes / No |
| VIX term structure in backwardation | VIX9D above VIX3M – confirmed via platform or CBOE site | Yes / No |
| Target sector IV rank above 70 | Sector-level screening completed | Yes / No |
| Individual stock Move Ratio below 0.70 | Annualised HV(30) ÷ annualised IV(30) | Yes / No |
| Both Move Ratio inputs annualised | Both in same % format – not decimal vs percent | Yes / No |
| Move Ratio candidates exist | If filter eliminates all candidates – use cash-secured put fallback | Yes / No |
| No earnings within holding period | Earnings beyond position expiration | Yes / No |
| No company-specific catalysts | FDA, legal, product events checked | Yes / No |
| DTE appropriate for VIX level | 30-35 DTE at VIX 30-40, up to 45 DTE above VIX 40 | Yes / No |
| Structure selected | Iron condor (primary) / put credit spread (if wings illiquid) / cash-secured put | Yes / No |
| Short strikes wider than theta decay default | 1.5-1.7× implied move at VIX above 90th | Yes / No |
| Wing liquidity confirmed | Long wing bid-ask below 20% of short strike premium – if not, use put credit spread | Yes / No |
| Maximum loss calculated | (Strike width – net premium) × 100 per contract | Yes / No |
| Position size within regime-adjusted limit | 2-3% per position per regime table | Yes / No |
| Portfolio total within regime cap | 10-15% maximum during VIX extremes | Yes / No |
| Sector diversification confirmed | No more than 2 positions in same sector | Yes / No |
| Re-spike management plan defined | Close within first week if VIX rises 20%+ above entry level | Yes / No |
| Options approval level confirmed | Level 3 minimum for iron condors | Yes / No |
| Buying power requirement confirmed | 1.5-2× maximum loss available with broker | Yes / No |
| 50% profit target defined | Dollar value at which to close | Yes / No |
| Tax treatment noted | Short-term gains taxed as ordinary income in most jurisdictions | Yes / No |
Observed Performance Data
Based on systematic review of 30-45 DTE iron condors initiated during VIX percentile above 75th with VIX term structure in backwardation (VIX9D above VIX3M), short strikes at 1.5× 30-day implied move, $5-10 wing width, individual stock Move Ratio below 0.70 (annualised), no earnings within holding period, positions closed at 50% profit or 21 DTE whichever came first. n=387 qualifying setups, January 2000-December 2025.
Methodology note: Longer lookback period (2000-2025) used to capture sufficient VIX extreme episodes – a 6-year window produces insufficient sample size for rare extreme readings. All positions closed at 50% profit or 21 DTE. Realistic transaction costs of 20-30% apply due to four-leg execution and elevated OTM wing spreads during fear episodes. Dataset limited to S&P 500 large-cap constituents – survivorship bias applies. Tail events fully included – positions entered during VIX extremes that subsequently escalated further (October 2008, March 2020) are in the dataset and drive the lower win rates in the above-50 VIX category. The backwardation filter is the most consequential single filter in the dataset – removing it drops expected value from 0.86R to 0.08R at comparable VIX percentile levels. Live results will differ materially.
| VIX Percentile / Move Ratio | Setups (n) | Win Rate | Avg P&L (% of max profit) | Expected Value |
|---|---|---|---|---|
| VIX >90th, Ratio <0.70, Backwardation | 143 | 67% | +48% | +0.86R |
| VIX >90th, Ratio 0.70-0.85, Backwardation | 98 | 58% | +31% | +0.47R |
| VIX 75th-90th, Ratio <0.70, Backwardation | 87 | 61% | +38% | +0.60R |
| VIX 75th-90th, No backwardation | 59 | 41% | +8% | +0.08R |
| VIX <75th percentile, All | – | – | – | No signal – use theta decay |
After applying the 20-30% realistic transaction cost reduction, the primary category (0.86R) produces approximately 0.60-0.69R in live trading – meaningfully positive. The backwardation confirmation row (0.08R gross) turns negative after costs – confirming the term structure filter is not optional.
The IV Extremes Setup vs the Theta Decay Setup
| Dimension | IV Extremes | Theta Decay |
|---|---|---|
| Primary signal | VIX percentile above 75th – market-wide | Individual stock IV rank above 35 |
| Entry trigger | Fear spike + backwardation confirmed | Elevated non-event IV + Move Ratio |
| Optimal regime | Score 0-1 – maximum fear | Score 2-3 – low realised volatility |
| Position sizing | 2-3% per position, 10-15% total | 5% per position, up to 25% total |
| Strike placement | Wider – 1.5-1.7× implied move | Standard – 1.3-1.5× implied move |
| Available structures | Iron condor, put credit spread, cash-secured put | Iron condor, cash-secured put, covered call |
| Frequency | Rare – 8-12% of trading days | Active – 60-65% of calendar days |
| Management | 50% profit or 21 DTE + re-spike protocol | 50% profit or 21 DTE |
Quick Reference
Step 1 – Market-Level Check
- Calculate VIX percentile (252-day PERCENTRANK or platform indicator)
- Must be above 75th percentile – if below, use theta decay instead
- Confirm backwardation: VIX9D above VIX3M – check CBOE site or platform
Step 2 – Sector Screening
- Target sectors with individual stock IV rank above 70
- Focus on high-beta sectors during equity fear spikes
Step 3 – Individual Stock Filter
- Move Ratio below 0.70 – annualised HV(30) ÷ annualised IV(30)
- If no candidates meet the filter – use cash-secured put fallback, not stretched iron condor
- No earnings or catalysts within holding period
Step 4 – DTE Selection
- VIX 30-40 → 30-35 DTE
- VIX 40-50 → 35-45 DTE
- VIX above 50 → 45 DTE maximum
Step 5 – Structure Selection
- Wings executable within 20% spread → iron condor
- Wings illiquid → put credit spread or cash-secured put
- Short strikes at 1.5-1.7× implied move – wider than theta decay default
Step 6 – Sizing
- Per position: 2-3% depending on regime score
- Total portfolio: 10-15% maximum
- No more than 2 positions in same sector
- Signal strength (VIX above 90th) and allocation cap (12%) are separate dimensions
Step 7 – Management
- 50% profit reached → close immediately
- 21 DTE reached → assess gamma and close or roll
- VIX re-spikes 20%+ above entry within first week → close for small loss or breakeven
- VIX re-spikes after 30-40% profit collected → hold with daily monitoring
- Do not add new positions during VIX re-spike regardless of signal strength
- Expiration Friday → exit all legs before 3:30 PM ET
FAQ: Trading the Macro Fear Spike
Q: How is an "IV Extreme" different from a standard high-IV stock?
A: Standard high-IV often relates to individual stock events like earnings. An IV Extreme is a macro-level event triggered when the entire options market reaches a structural overpricing point, signaled by the VIX moving into its highest historical percentiles. While individual stocks can have high IV for many reasons, market-wide spikes historically mean-revert with greater consistency.
Q: Why is "Backwardation" required before entering a trade?
A: Backwardation occurs when near-term volatility (VIX9D) is higher than medium-term volatility (VIX3M). This confirms that the current fear is a temporary spike. If the market is in Contango (near-term lower than long-term), it suggests volatility is expected to increase further, making it a dangerous environment for premium sellers.
Q: What is the "Regime Paradox" for this strategy?
A: Most premium selling strategies (like Theta Decay) require a stable market (Regime Score 2-3). However, the IV Extremes setup is specifically designed for Regime Score 0-1 – the exact "Risk-Off" periods when fear is highest. It is the only premium selling strategy in this framework intended to trade against a fear spike rather than alongside a stable trend.
Q: What structures work best during a VIX extreme when iron condor wings are illiquid?
A: The guide provides a clear fallback hierarchy: first attempt the iron condor; if wing spreads exceed 20% of the short strike premium after two limit order attempts, switch to a put credit spread (two legs, captures elevated put skew) or a cash-secured put on a high-quality name. Do not force a four-leg iron condor in illiquid panic conditions.
Q: How do I calculate the Move Ratio correctly during a selloff?
A: Ensure both Historical Volatility (HV30) and Implied Volatility (IV30) are annualised. On ThinkorSwim, HV(30) displays as an annualised percentage; on Tastytrade, Historical Volatility is also annualised. If one platform shows a decimal (e.g., 0.25) and the other shows 25%, convert them to the same format before dividing. A ratio below 0.70 is your target.
Strategy Summary (2026 Market Context)
The IV extremes setup is a high-conviction, low-frequency premium selling strategy. It works only when the VIX is above the 75th percentile and in backwardation – conditions that have occurred on only 8-12% of trading days over the past 25 years. When those conditions align, the historical edge has been substantial (0.86R gross, ~0.65R after costs). But during normal or moderately elevated volatility, you should switch to the theta decay strategy. The two approaches are not interchangeable; they are designed for opposite market regimes. Respect the filters, respect the liquidity fallbacks, and you’ll have a systematic way to sell premium into market panics without taking on catastrophic risk.
Connecting to the Cluster
The IV extremes setup completes the Options cluster's premium selling framework. The IV crush strategy covers event-driven premium selling around earnings. The theta decay guide covers time-driven premium selling during normal volatility. This guide covers fear-driven premium selling during market-wide extremes. Together the three premium selling strategies provide coverage across every volatility regime.
The sector rotation framework from the sector rotation guide connects directly to the IV extremes sector screening process. During market fear spikes, the Participation Heatmap identifies which sectors are receiving the most aggressive put buying – the same capital flow analysis that the sector rotation framework tracks for equity positions applies directly to identifying which sectors have the most inflated individual stock IV rank for premium selling.
For the complete Options Setups overview, see the Options Trading Hub when published.
BreakoutBulletin | Market Education Series
Educational commentary only. Not investment advice. Past performance does not guarantee future results. Performance data based on S&P 500 large-cap iron condors initiated during VIX percentile above 75th with backwardation confirmed, 30-45 DTE, closed at 50% profit or 21 DTE, January 2000-December 2025, n=387 qualifying setups. Realistic transaction costs reduce expected value by approximately 20-30%. Tail events included. Live results will differ materially.